| Param | Original file | Final file |
|---|---|---|
| Filename | modeM0/AS1A03_074T01_9000001192_08466cztM0_level2.evt | modeM0/AS1A03_074T01_9000001192_08466cztM0_level2_quad_clean.evt |
| Size (bytes) | 443,194,560 | 97,499,520 |
| Size | 422.7 MB | 93.0 MB |
| Events in quadrant A | 3,212,411 | 617,179 |
| Events in quadrant B | 3,419,398 | 628,020 |
| Events in quadrant C | 3,161,667 | 630,451 |
| Events in quadrant D | 3,169,769 | 606,550 |
| Mode SS | |||
|---|---|---|---|
| Quadrant | BADHDUFLAG | Total packets | Discarded packets |
| A | 0 | 138 | 0 |
| B | 0 | 138 | 0 |
| C | 0 | 138 | 0 |
| D | 0 | 138 | 0 |
| Mode M9 | |||
|---|---|---|---|
| Quadrant | BADHDUFLAG | Total packets | Discarded packets |
| A | 0 | 25 | 0 |
| B | 0 | 25 | 0 |
| C | 0 | 25 | 0 |
| D | 0 | 25 | 0 |
| Mode M0 | |||
|---|---|---|---|
| Quadrant | BADHDUFLAG | Total packets | Discarded packets |
| A | 0 | 13938 | 3 |
| B | 0 | 14590 | 2 |
| C | 0 | 13898 | 2 |
| D | 0 | 14040 | 2 |
| Quadrant | Total seconds | Saturated seconds | Saturation percentage |
|---|---|---|---|
| A | 6754 | 25 | 0.370151% |
| B | 6754 | 62 | 0.917975% |
| C | 6754 | 23 | 0.340539% |
| D | 6754 | 17 | 0.251703% |
Noise dominated data is calculated using 1-second bins in cleaned event files. If a bin has >2000 counts, and if more than 50% of those come from <1% of pixels, then it is considered to be noise-dominated and hence unusable.
| Quadrant | # 1 sec bins | Bins with >0 counts | Bins with >2000 counts | High rate bins dominated by noise | Noise dominated (total time) | Noise dominated (detector-on time) | Marked lightcurve |
|---|---|---|---|---|---|---|---|
| A | 9264 | 6756 | 0 | 0 | 0.00% | 0.00% | 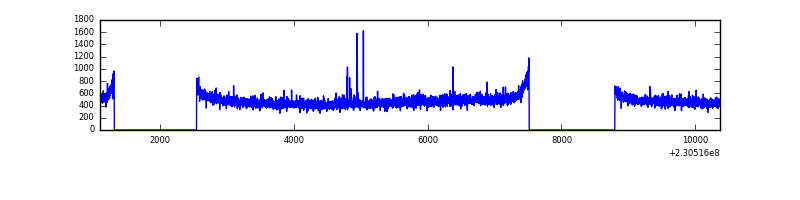 |
| B | 9264 | 6756 | 6 | 6 | 0.06% | 0.09% | 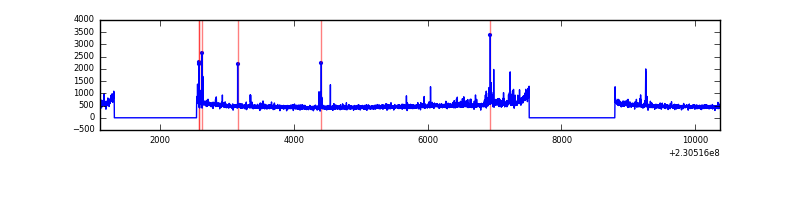 |
| C | 9264 | 6756 | 0 | 0 | 0.00% | 0.00% |  |
| D | 9264 | 6756 | 1 | 1 | 0.01% | 0.01% | 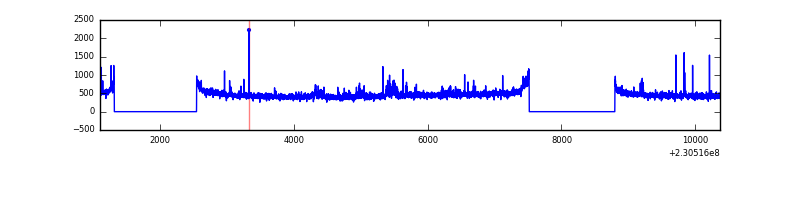 |
Top three noisy pixels from each quadrant. If the there are fewer than three noisy pixels in the level2.evt file, extra rows are filled as -1
| Pixel properties | Quadrant properties | ||||||
|---|---|---|---|---|---|---|---|
| Quadrant | DetID | PixID | Counts | Sigma | Mean | Median | Sigma |
| A | 4 | 2 | 13435 | 75.41 | 831 | 815 | 167.3 |
| A | 0 | 226 | 7688 | 41.07 | 831 | 815 | 167.3 |
| A | 12 | 194 | 7282 | 38.64 | 831 | 815 | 167.3 |
| B | 0 | 231 | 60820 | 381.56 | 836 | 817 | 157.3 |
| B | 4 | 81 | 39892 | 248.48 | 836 | 817 | 157.3 |
| B | 11 | 51 | 38756 | 241.25 | 836 | 817 | 157.3 |
| C | 13 | 61 | 6095 | 28.17 | 809 | 815 | 187.4 |
| C | 8 | 222 | 4319 | 18.7 | 809 | 815 | 187.4 |
| C | 9 | 54 | 2724 | 10.19 | 809 | 815 | 187.4 |
| D | 2 | 152 | 49332 | 253.63 | 804 | 786 | 191.4 |
| D | 2 | 14 | 43183 | 221.5 | 804 | 786 | 191.4 |
| D | 2 | 234 | 20034 | 100.56 | 804 | 786 | 191.4 |
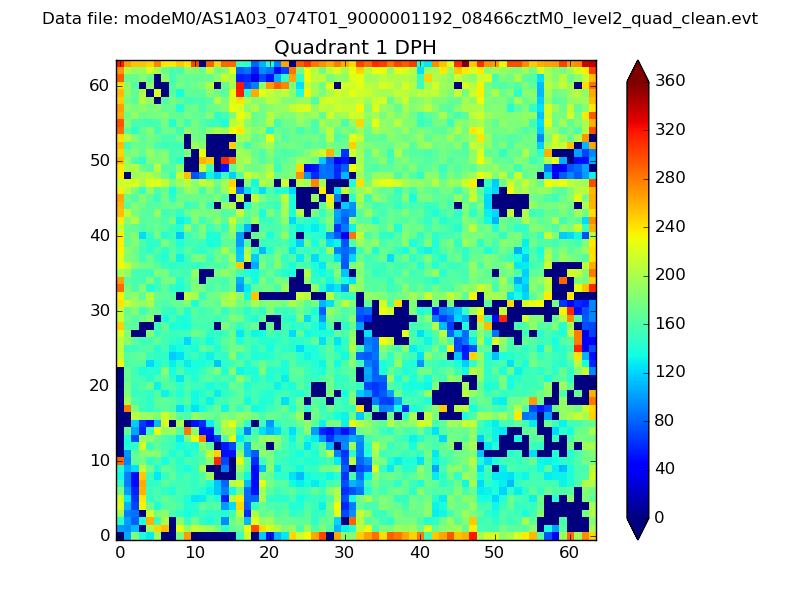
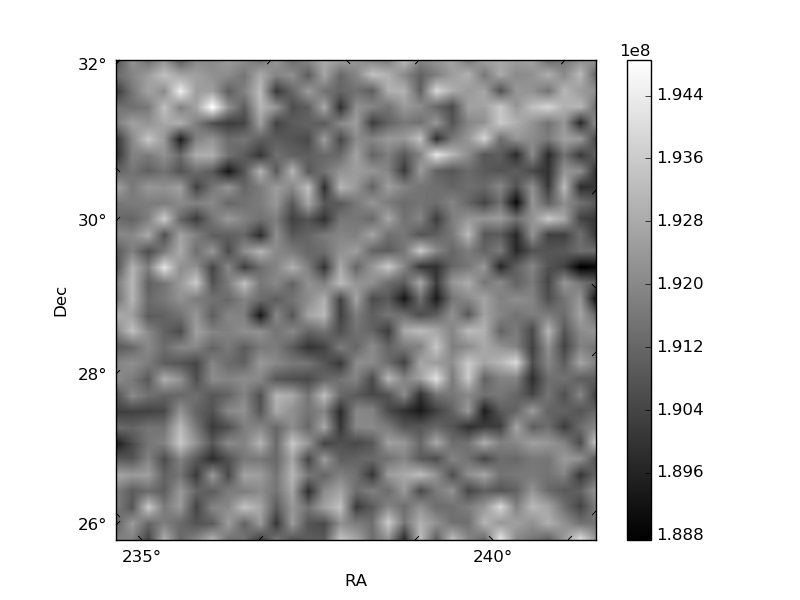
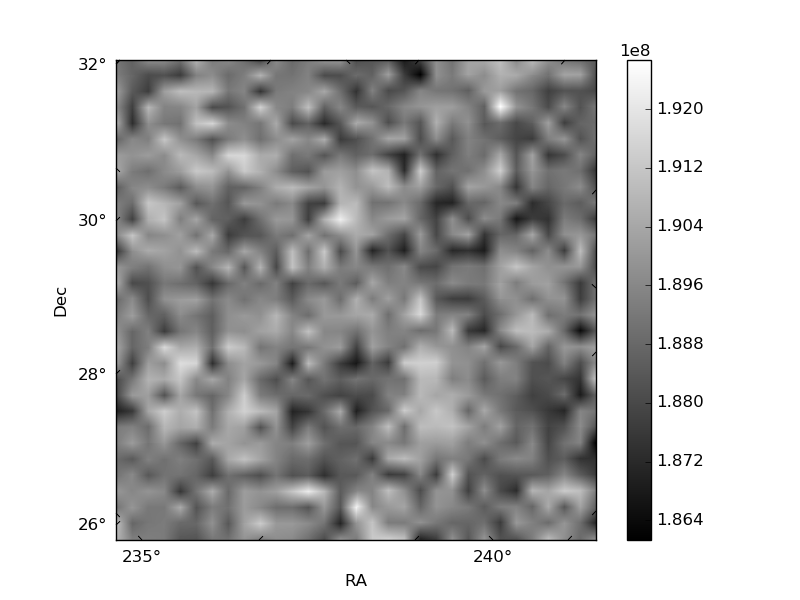
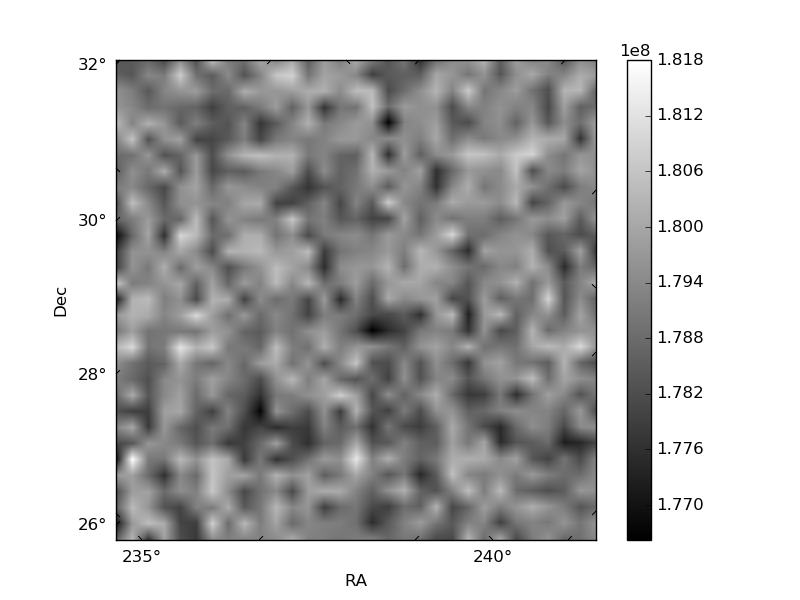
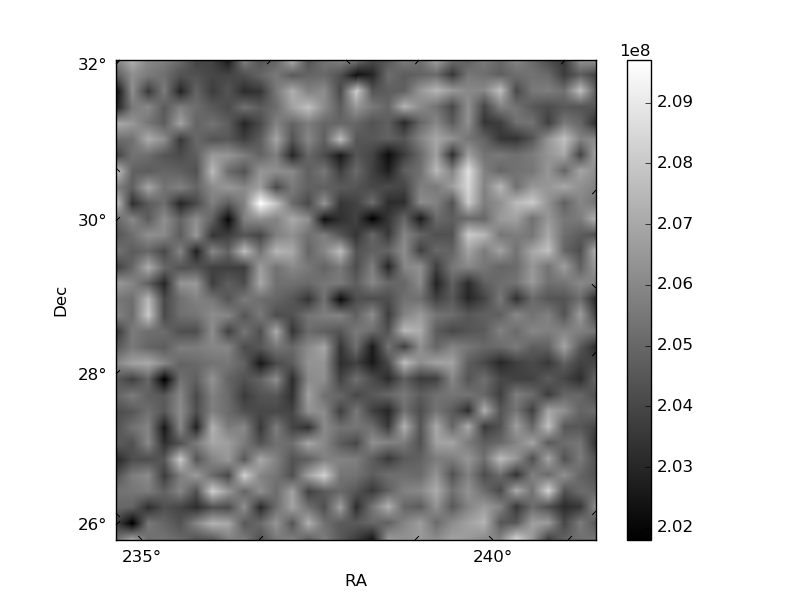
Histogram calculated using DETX and DETY for each event in the final _common_clean file
| Quadrant A | 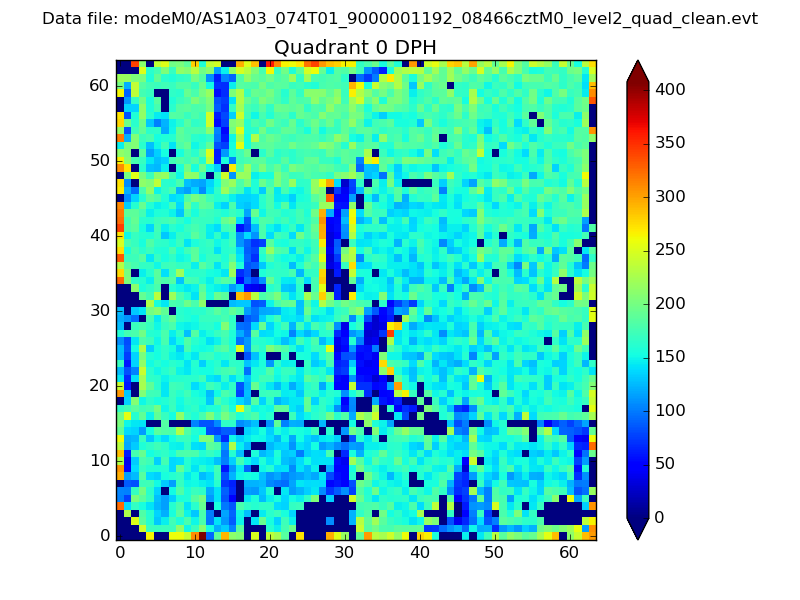 |
 |
Quadrant B |
|---|---|---|---|
| Quadrant D | 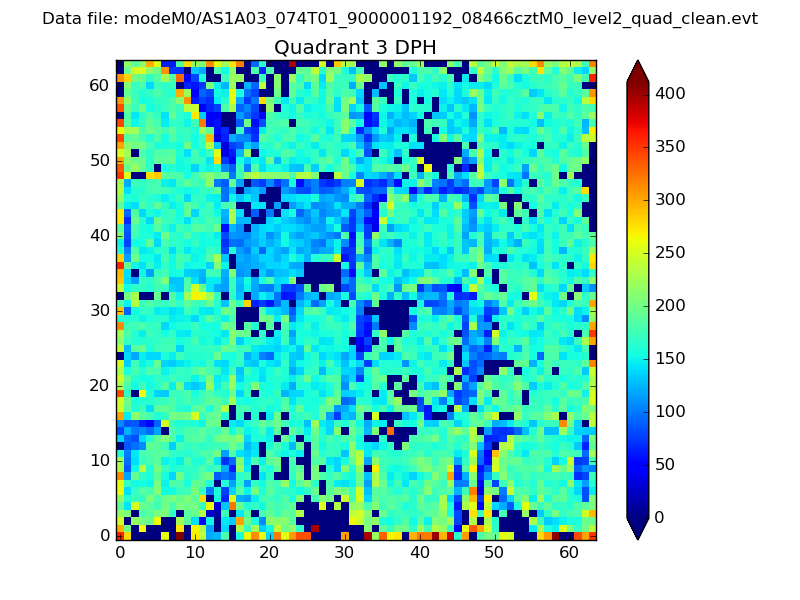 |
 |
Quadrant C |
| Plot type | Count rate plots | Images |
|---|---|---|
| Comparison with Poisson distribution Blue bars denote a histogram of data divided into 1 sec bins. Red curve is a Poisson curve with rate = median count rate of data. |
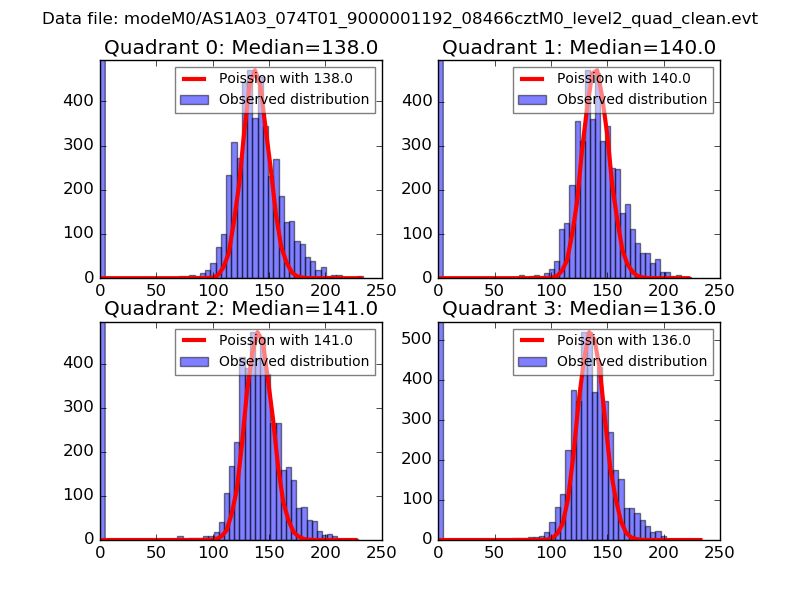 |
 |
| Quadrant-wise count rates Data is divided into 100 sec bins |
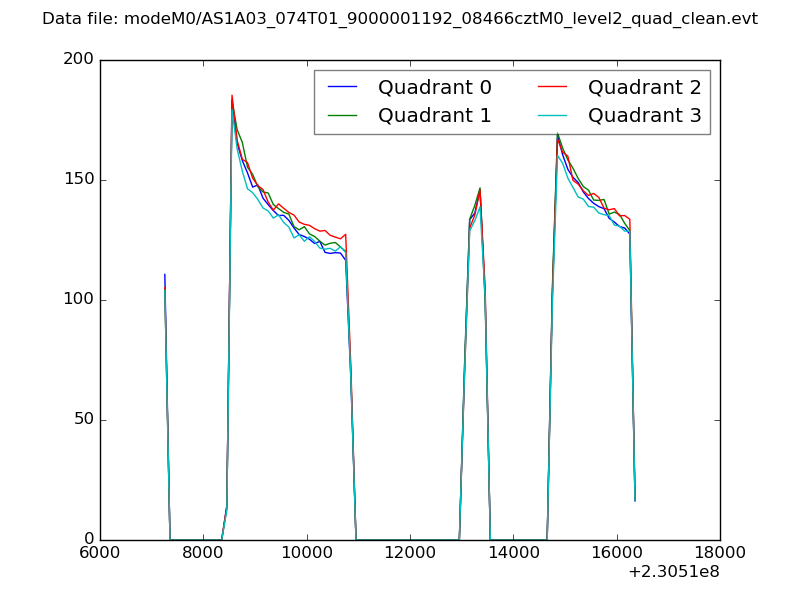 |
|
| Module-wise count rates for Quadrant A Data is divided into 100 sec bins |
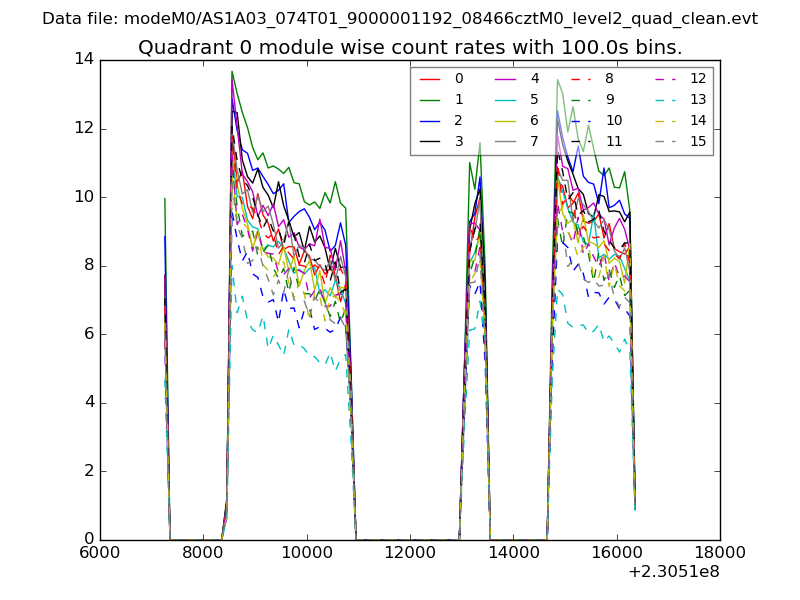 |
 |
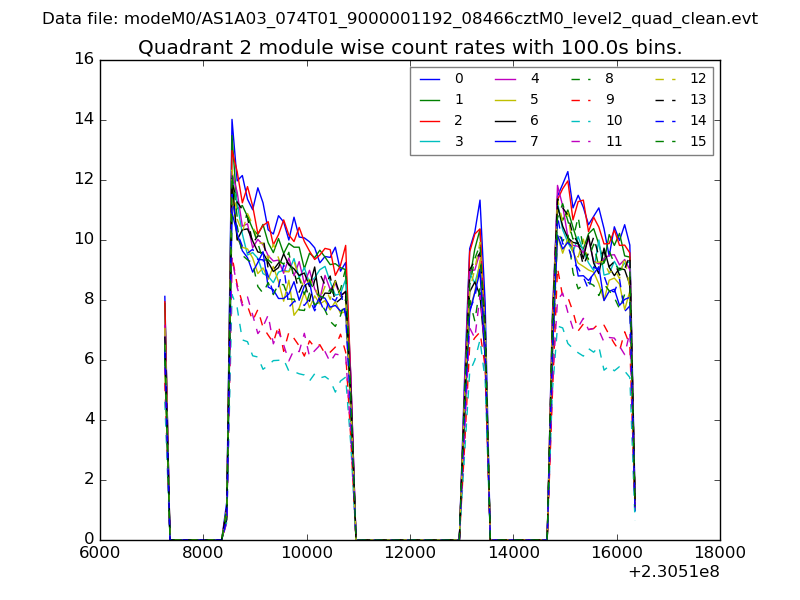
| Module-wise count rates for Quadrant B Data is divided into 100 sec bins |
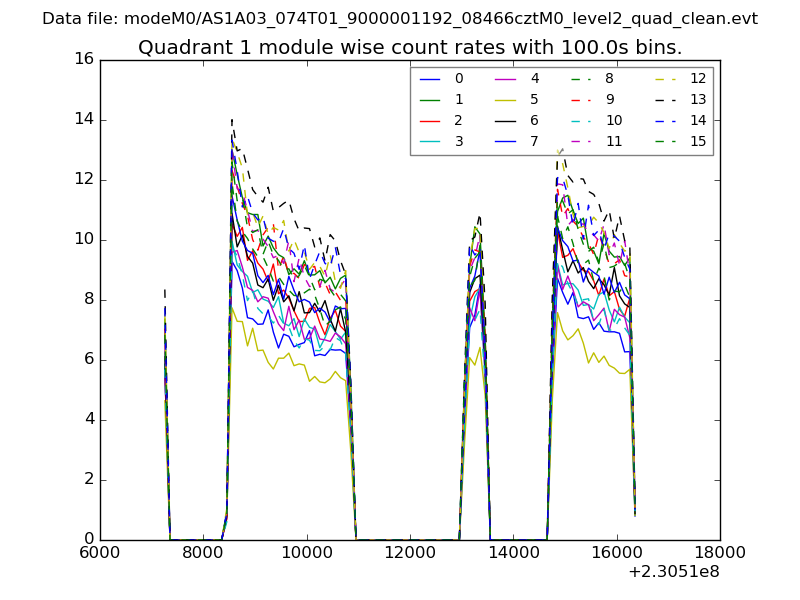 |
 |
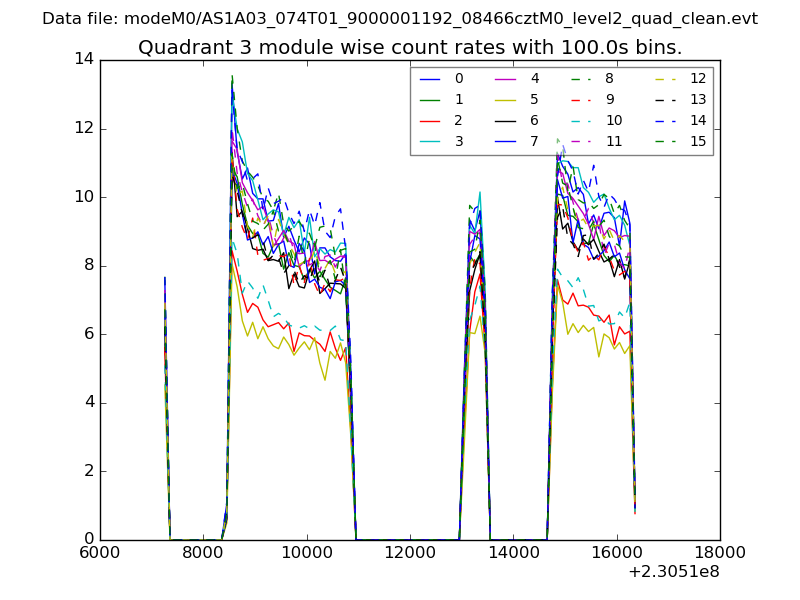
| Module-wise count rates for Quadrant C Data is divided into 100 sec bins |
 |
 |
| Module-wise count rates for Quadrant D Data is divided into 100 sec bins |
 |
 |
| Parameter | Plot |
|---|---|
| CZT HV Monitor | 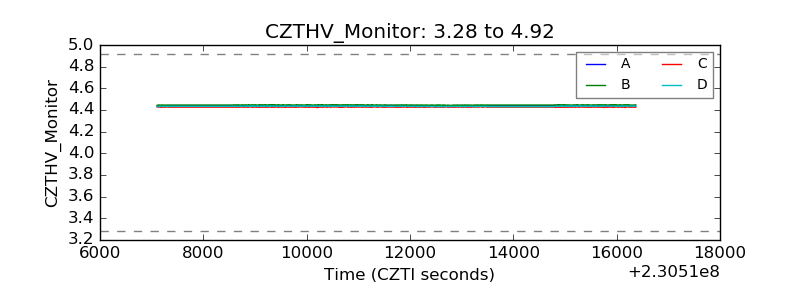 |
| D_VDD | 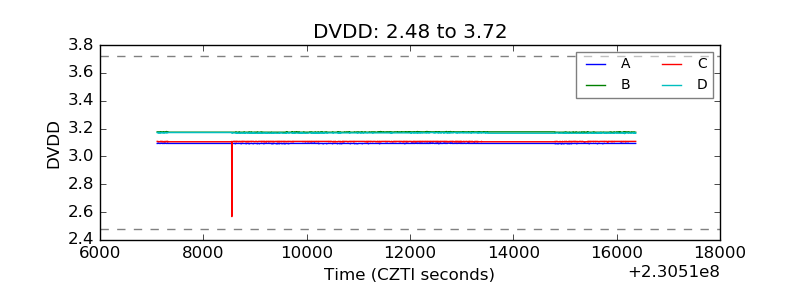 |
| Temperature 1 | 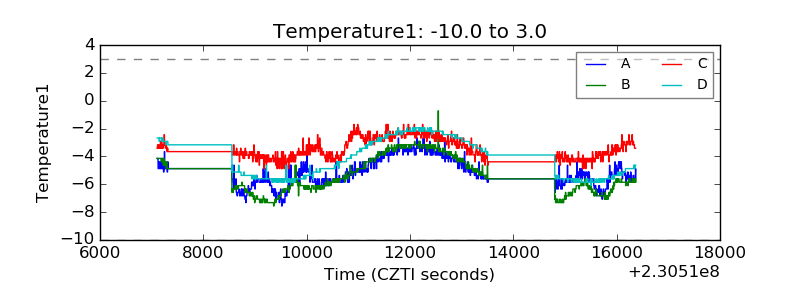 |
| Veto HV Monitor | 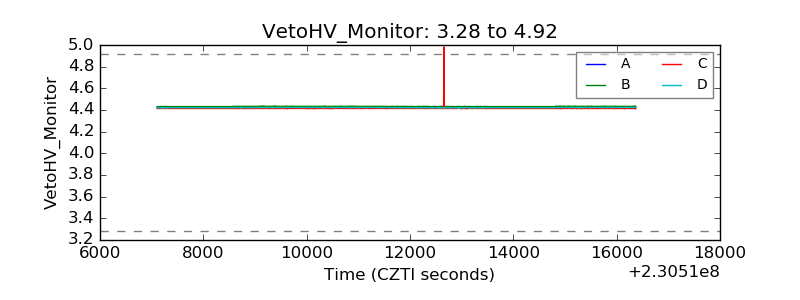 |
| Veto LLD | 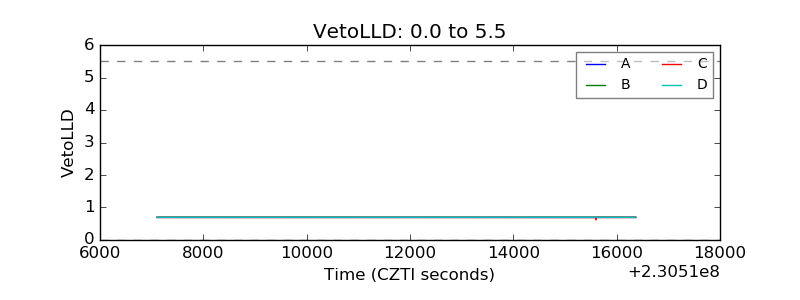 |
| Alpha Counter | 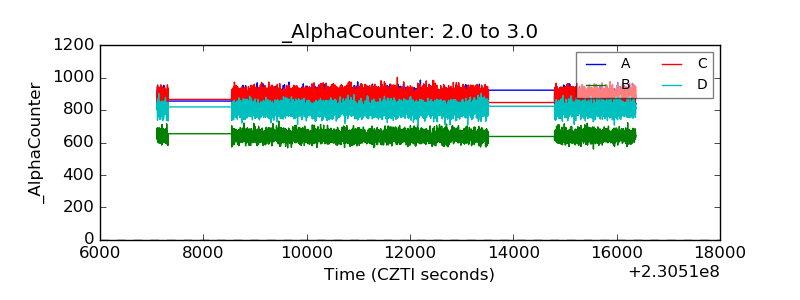 |
| _CPM_Rate | 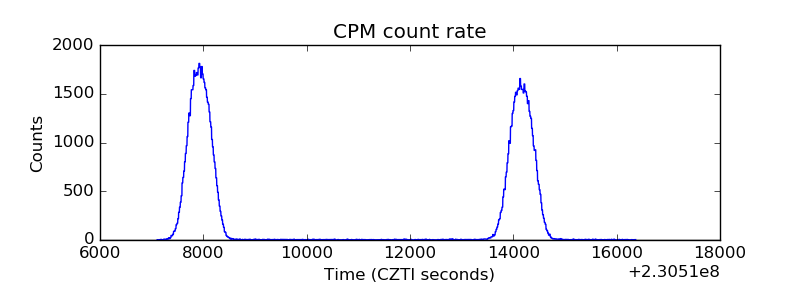 |
| CZT Counter |  |
| +2.5 Volts monitor | 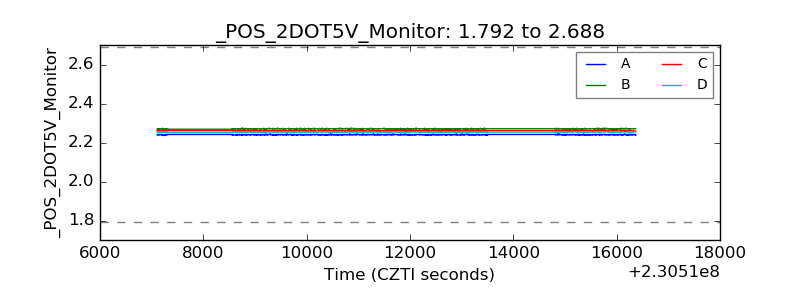 |
| +5 Volts monitor |  |
| _ROLL_ROT | 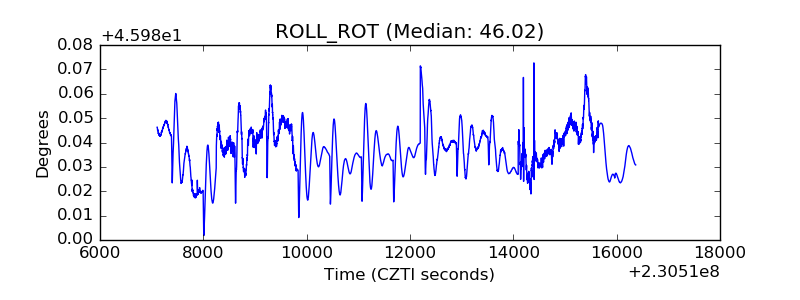 |
| _Roll_DEC | 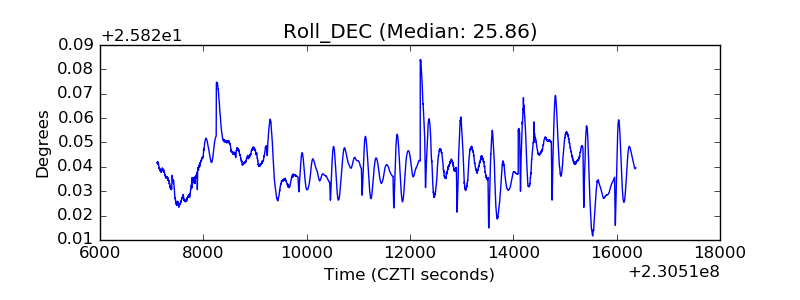 |
| _Roll_RA | 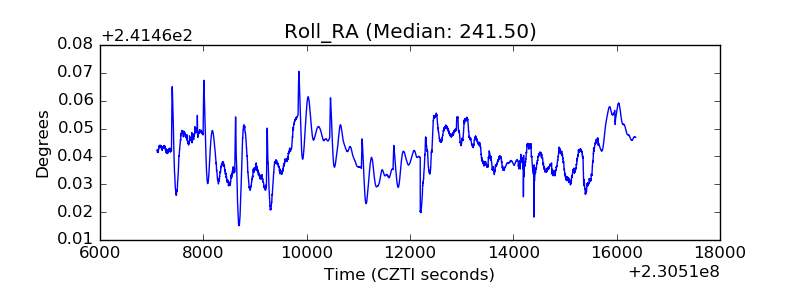 |
| Veto Counter | 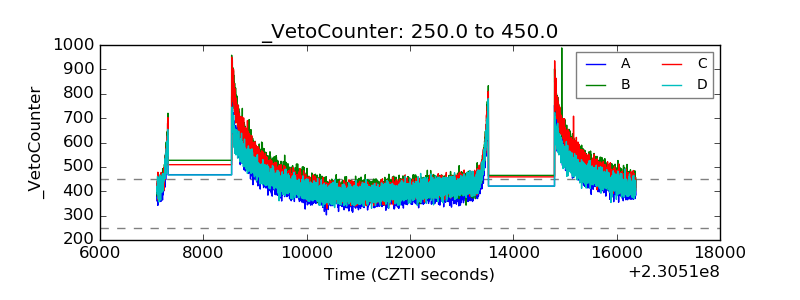 |