| Param | Original file | Final file |
|---|---|---|
| Filename | modeM0/AS1A03_074T01_9000001192_08471cztM0_level2.evt | modeM0/AS1A03_074T01_9000001192_08471cztM0_level2_quad_clean.evt |
| Size (bytes) | 579,049,920 | 101,318,400 |
| Size | 552.2 MB | 96.6 MB |
| Events in quadrant A | 4,125,282 | 621,114 |
| Events in quadrant B | 4,309,125 | 622,269 |
| Events in quadrant C | 3,993,076 | 633,292 |
| Events in quadrant D | 4,549,013 | 617,957 |
| Mode SS | |||
|---|---|---|---|
| Quadrant | BADHDUFLAG | Total packets | Discarded packets |
| A | 0 | 170 | 0 |
| B | 0 | 170 | 0 |
| C | 0 | 170 | 0 |
| D | 0 | 170 | 0 |
| Mode M9 | |||
|---|---|---|---|
| Quadrant | BADHDUFLAG | Total packets | Discarded packets |
| A | 0 | 6 | 0 |
| B | 0 | 6 | 0 |
| C | 0 | 6 | 0 |
| D | 0 | 6 | 0 |
| Mode M0 | |||
|---|---|---|---|
| Quadrant | BADHDUFLAG | Total packets | Discarded packets |
| A | 0 | 17869 | 5 |
| B | 0 | 18183 | 2 |
| C | 0 | 17621 | 2 |
| D | 0 | 19270 | 2 |
| Quadrant | Total seconds | Saturated seconds | Saturation percentage |
|---|---|---|---|
| A | 8243 | 439 | 5.325731% |
| B | 8244 | 443 | 5.373605% |
| C | 8244 | 323 | 3.918001% |
| D | 8244 | 395 | 4.791363% |
Noise dominated data is calculated using 1-second bins in cleaned event files. If a bin has >2000 counts, and if more than 50% of those come from <1% of pixels, then it is considered to be noise-dominated and hence unusable.
| Quadrant | # 1 sec bins | Bins with >0 counts | Bins with >2000 counts | High rate bins dominated by noise | Noise dominated (total time) | Noise dominated (detector-on time) | Marked lightcurve |
|---|---|---|---|---|---|---|---|
| A | 8869 | 8245 | 4 | 4 | 0.05% | 0.05% | 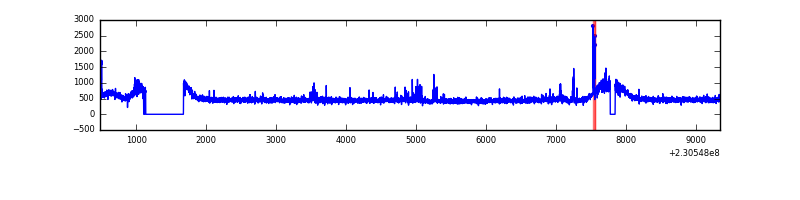 |
| B | 8869 | 8245 | 20 | 20 | 0.23% | 0.24% | 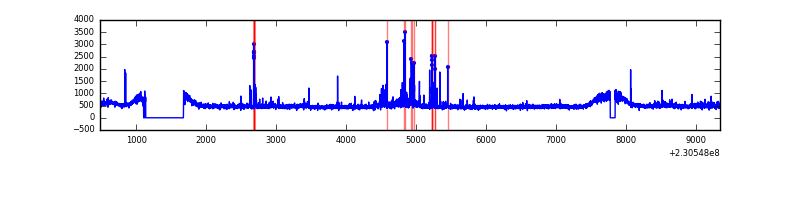 |
| C | 8869 | 8245 | 1 | 1 | 0.01% | 0.01% | 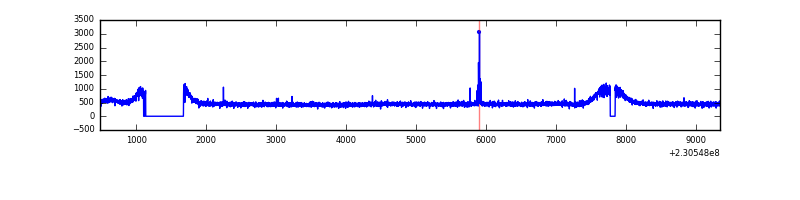 |
| D | 8869 | 8245 | 45 | 45 | 0.51% | 0.55% | 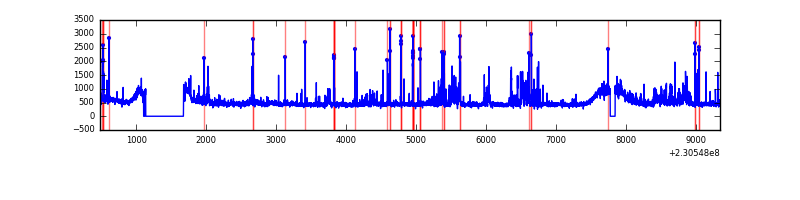 |
Top three noisy pixels from each quadrant. If the there are fewer than three noisy pixels in the level2.evt file, extra rows are filled as -1
| Pixel properties | Quadrant properties | ||||||
|---|---|---|---|---|---|---|---|
| Quadrant | DetID | PixID | Counts | Sigma | Mean | Median | Sigma |
| A | 4 | 2 | 95918 | 439.41 | 1042 | 1018 | 216.0 |
| A | 13 | 14 | 13732 | 58.87 | 1042 | 1018 | 216.0 |
| A | 0 | 226 | 9459 | 39.08 | 1042 | 1018 | 216.0 |
| B | 4 | 81 | 112476 | 546.95 | 1034 | 1008 | 203.8 |
| B | 0 | 214 | 83149 | 403.05 | 1034 | 1008 | 203.8 |
| B | 11 | 51 | 49884 | 239.82 | 1034 | 1008 | 203.8 |
| C | 9 | 54 | 32773 | 134.61 | 1012 | 1018 | 235.9 |
| C | 13 | 61 | 7669 | 28.19 | 1012 | 1018 | 235.9 |
| C | 8 | 128 | 5971 | 21.0 | 1012 | 1018 | 235.9 |
| D | 13 | 105 | 434148 | 1772.24 | 1015 | 990 | 244.4 |
| D | 1 | 52 | 61440 | 247.33 | 1015 | 990 | 244.4 |
| D | 2 | 152 | 41926 | 167.49 | 1015 | 990 | 244.4 |
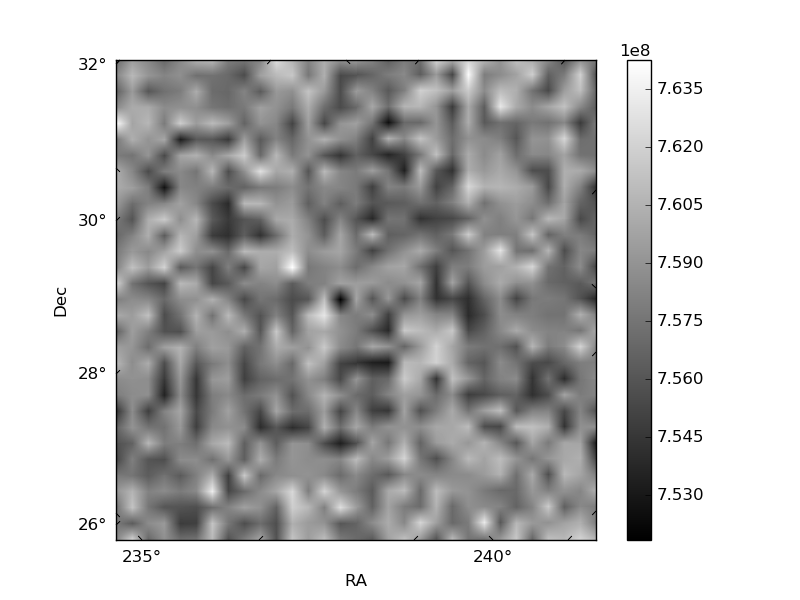
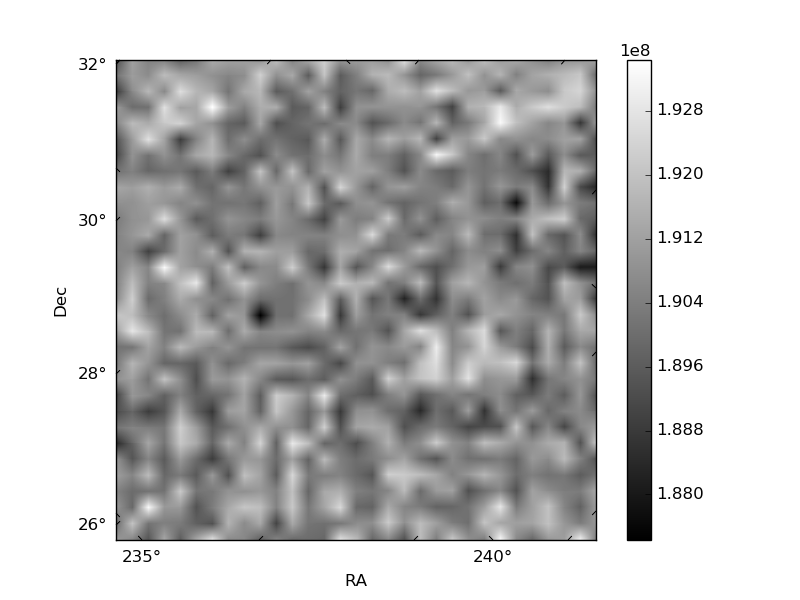
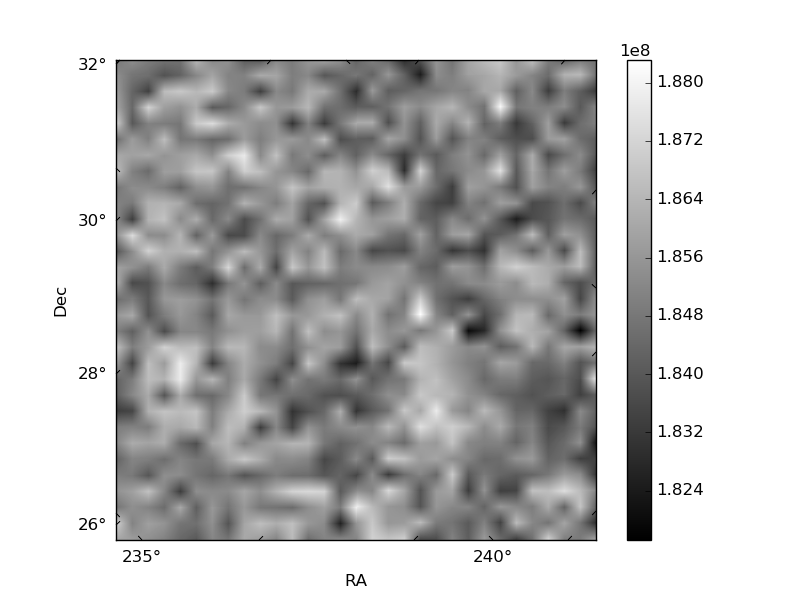
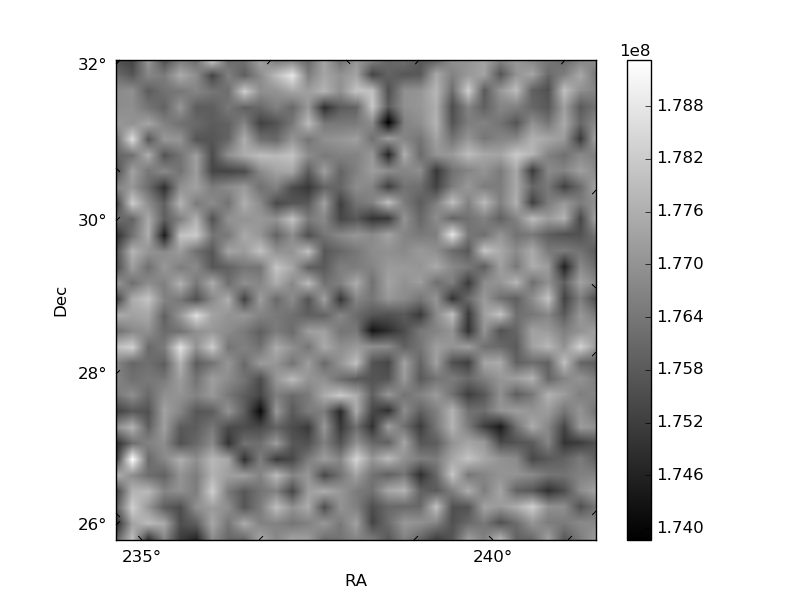
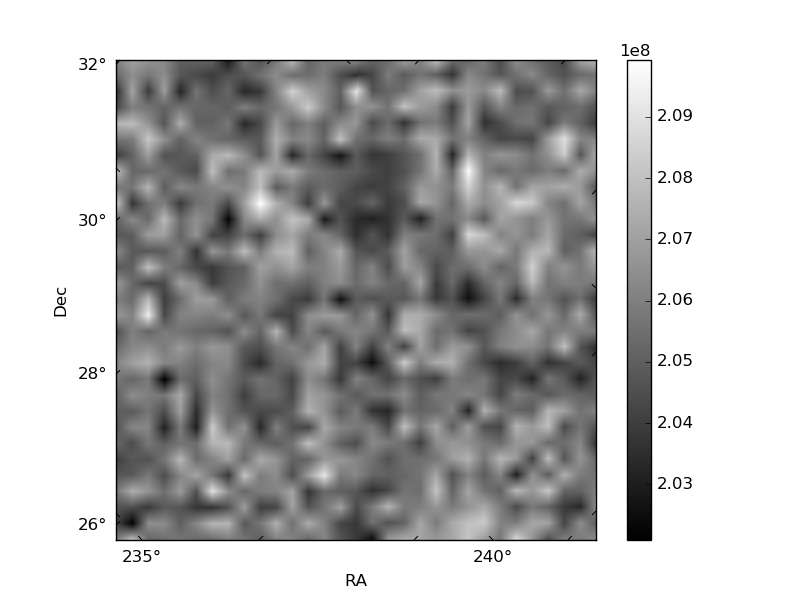
Histogram calculated using DETX and DETY for each event in the final _common_clean file
| Quadrant A | 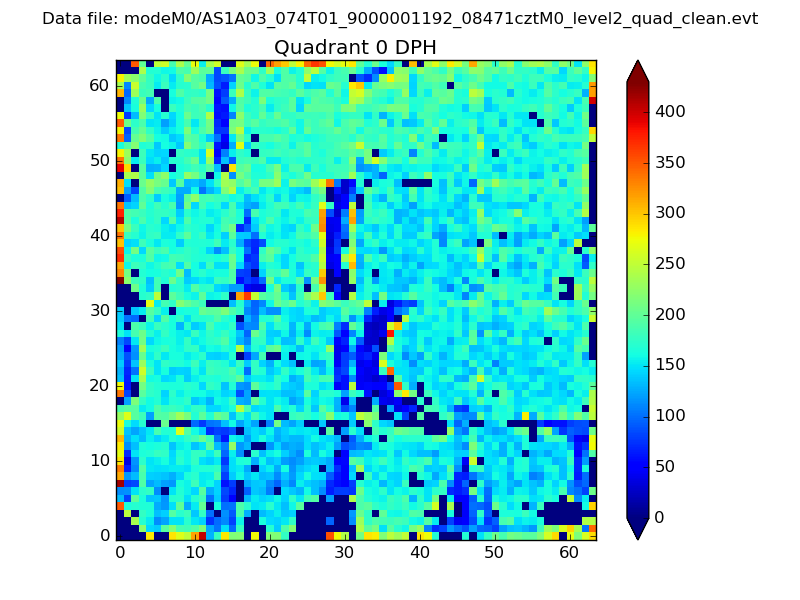 |
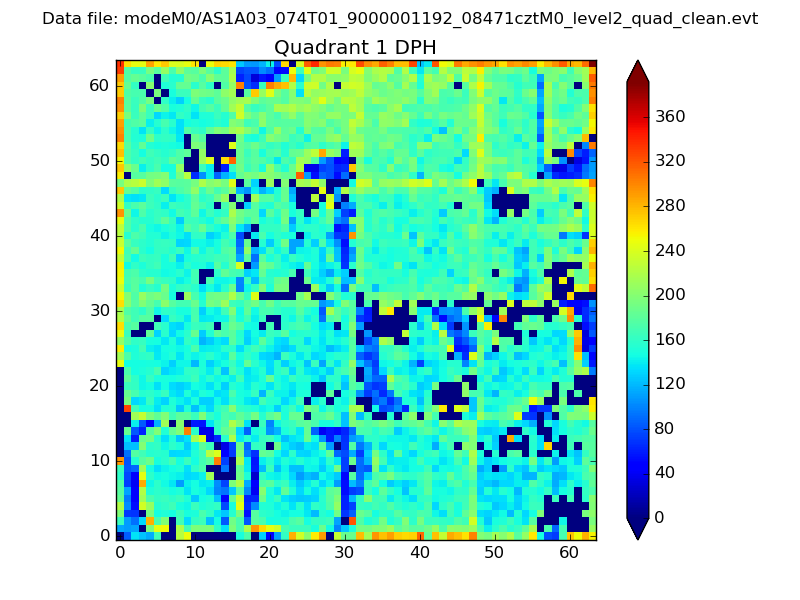 |
Quadrant B |
|---|---|---|---|
| Quadrant D |  |
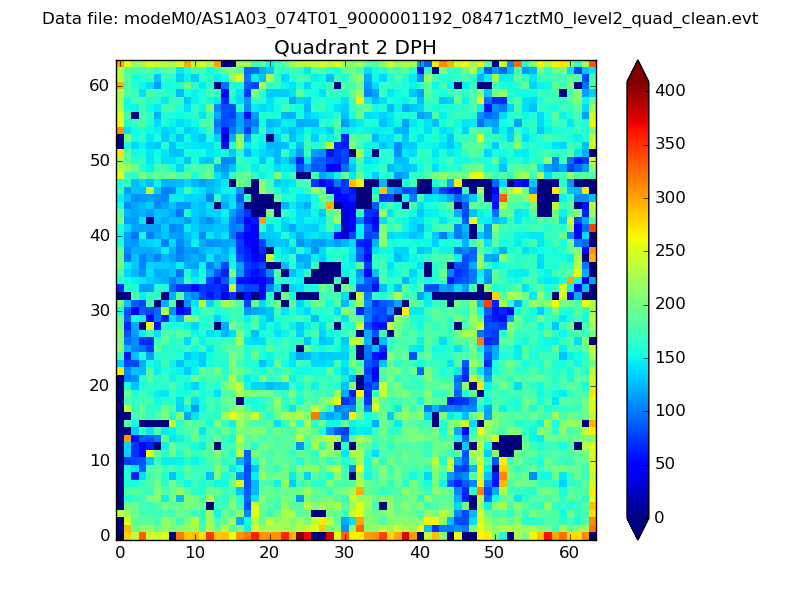 |
Quadrant C |
| Plot type | Count rate plots | Images |
|---|---|---|
| Comparison with Poisson distribution Blue bars denote a histogram of data divided into 1 sec bins. Red curve is a Poisson curve with rate = median count rate of data. |
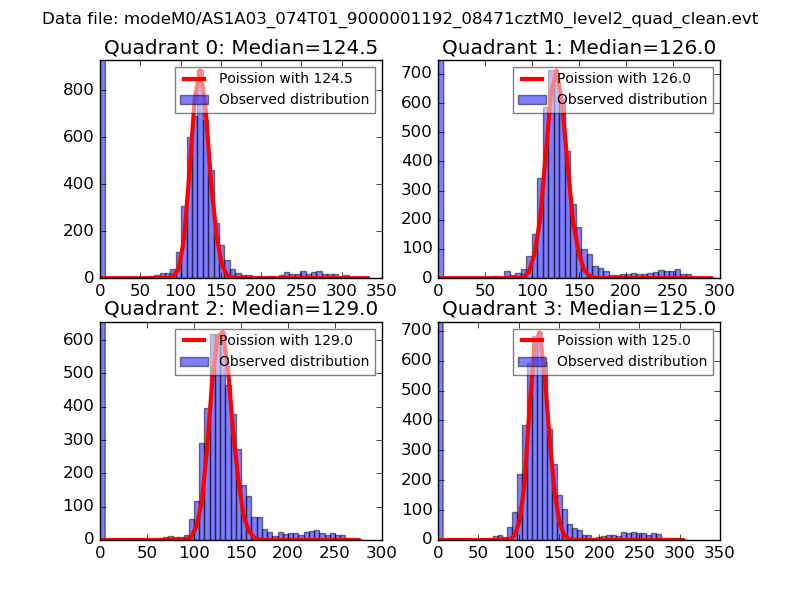 |
 |
| Quadrant-wise count rates Data is divided into 100 sec bins |
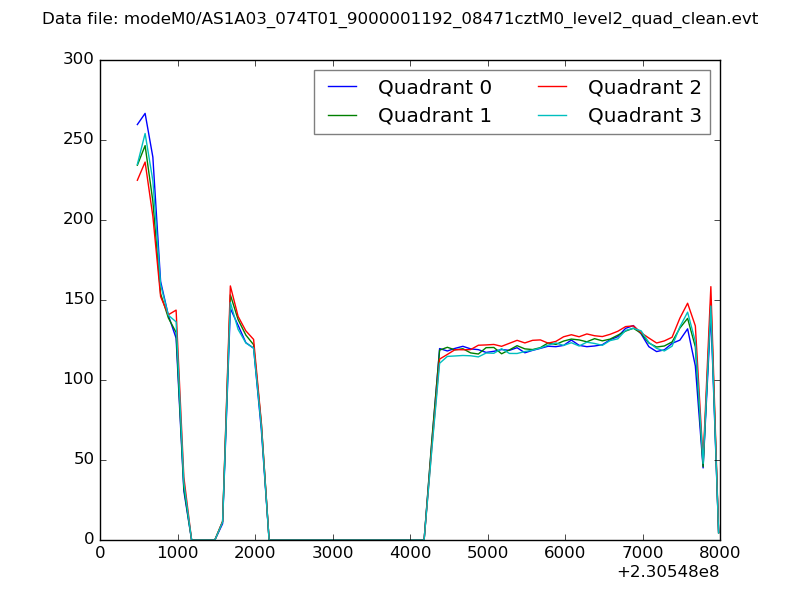 |
|
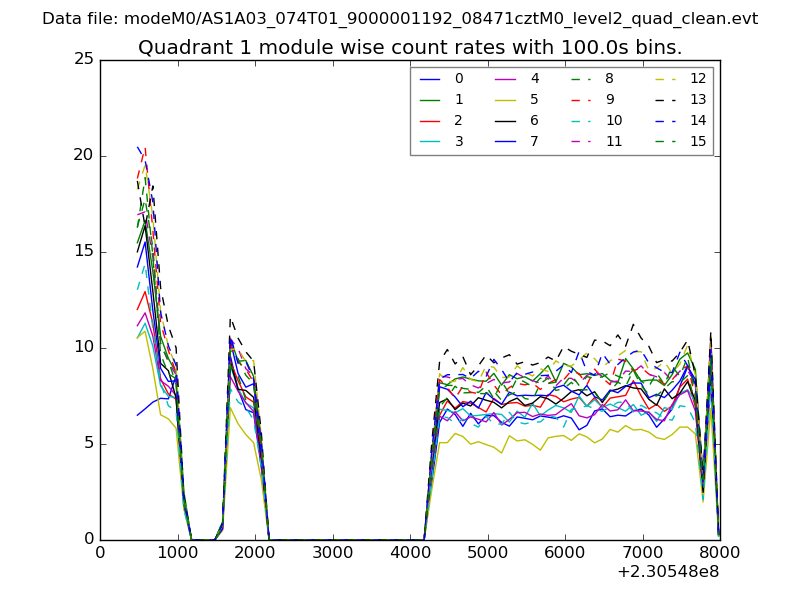
| Module-wise count rates for Quadrant A Data is divided into 100 sec bins |
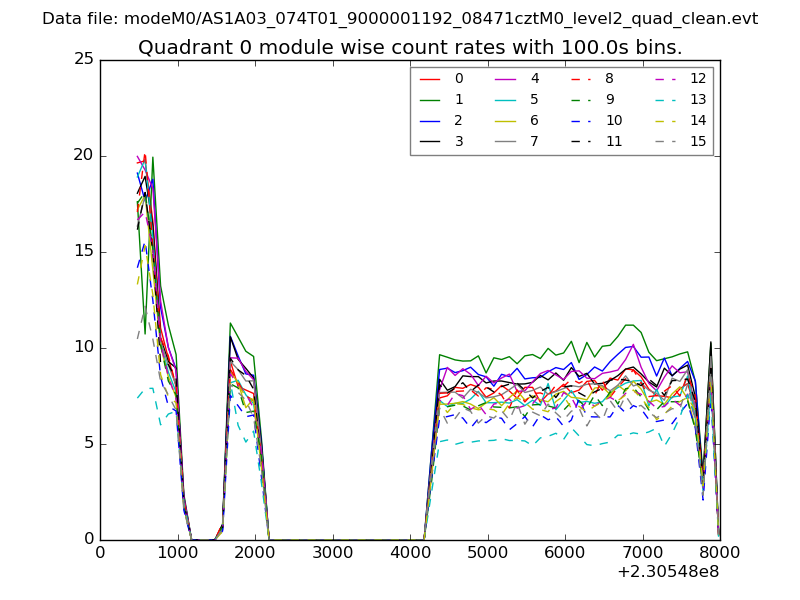 |
 |
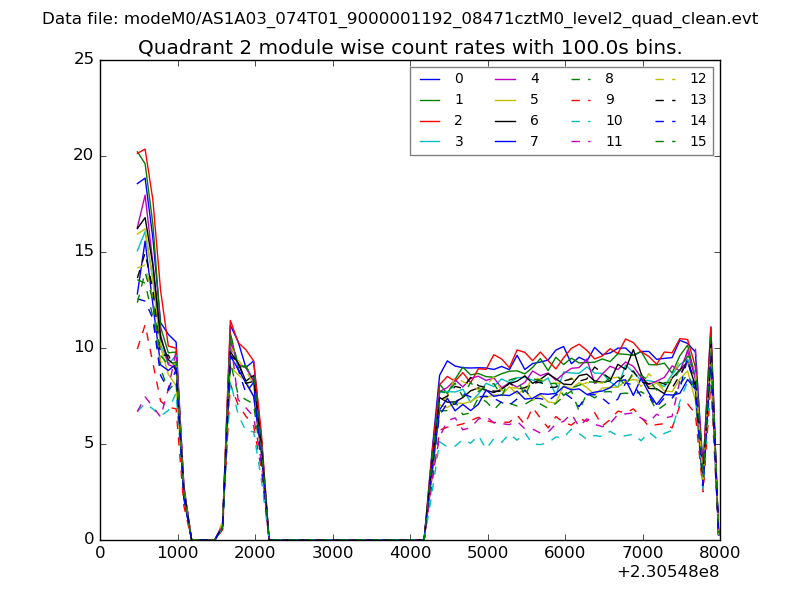
| Module-wise count rates for Quadrant B Data is divided into 100 sec bins |
 |
 |
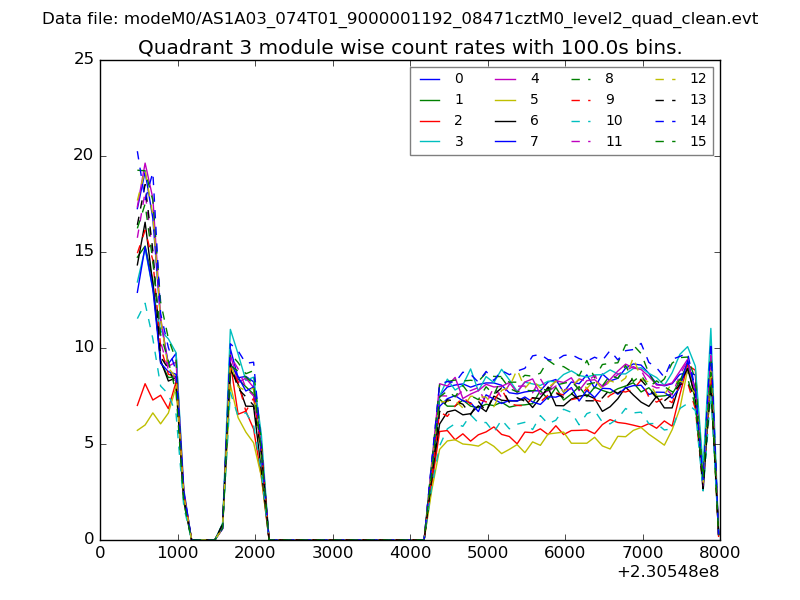
| Module-wise count rates for Quadrant C Data is divided into 100 sec bins |
 |
 |
| Module-wise count rates for Quadrant D Data is divided into 100 sec bins |
 |
 |
| Parameter | Plot |
|---|---|
| CZT HV Monitor | 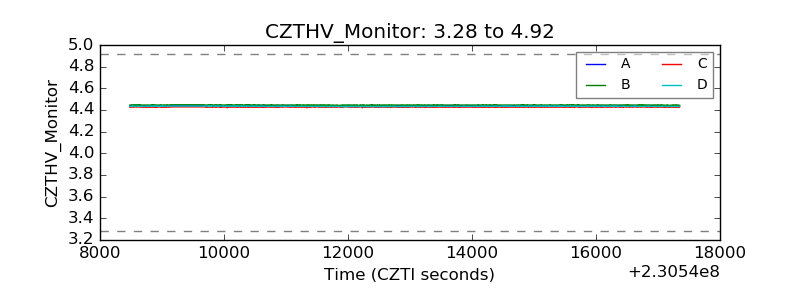 |
| D_VDD | 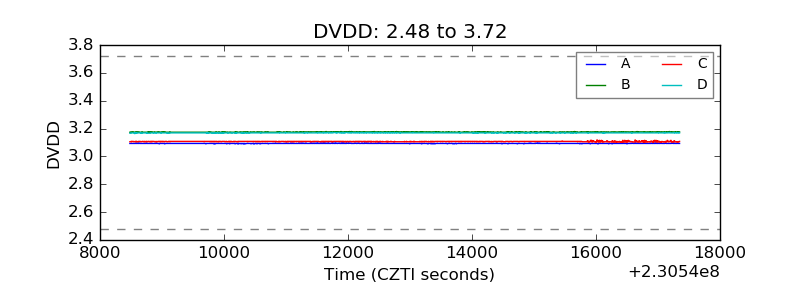 |
| Temperature 1 | 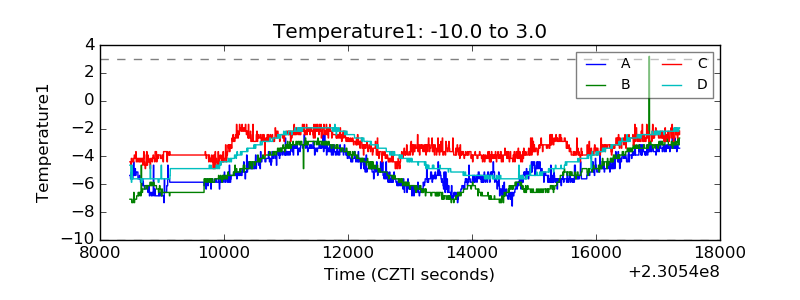 |
| Veto HV Monitor | 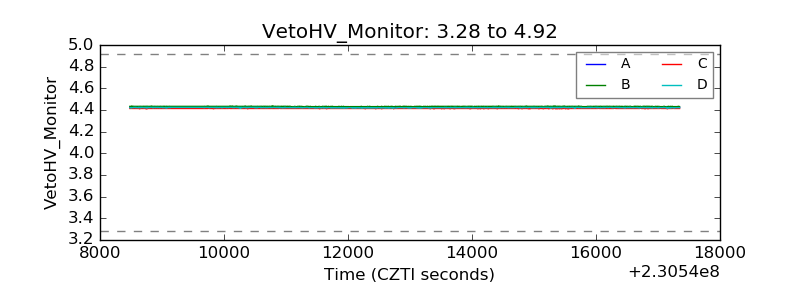 |
| Veto LLD |  |
| Alpha Counter | 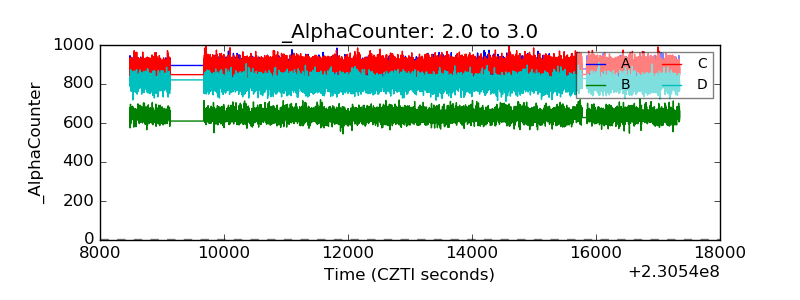 |
| _CPM_Rate | 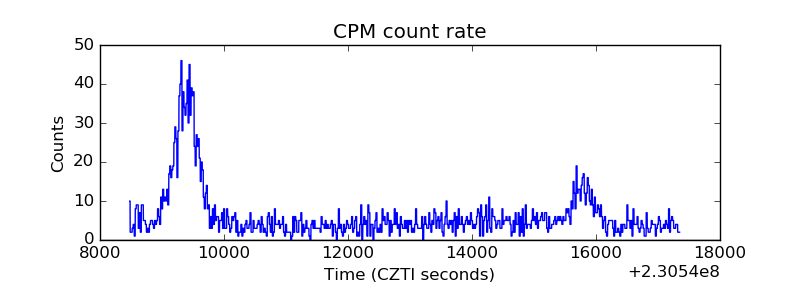 |
| CZT Counter | 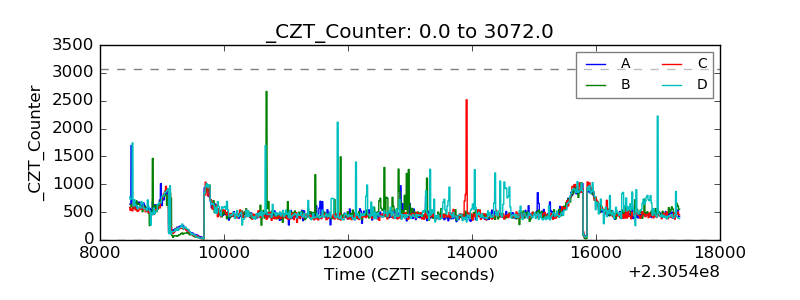 |
| +2.5 Volts monitor |  |
| +5 Volts monitor |  |
| _ROLL_ROT | 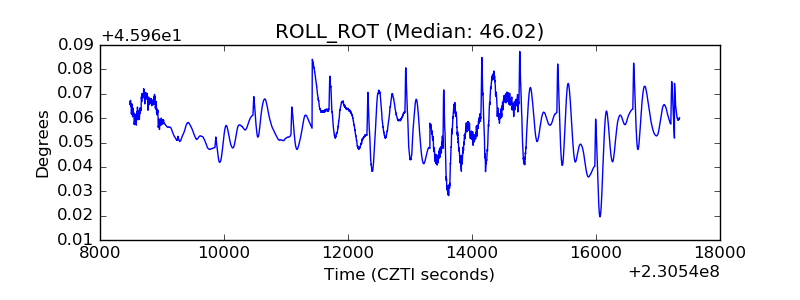 |
| _Roll_DEC | 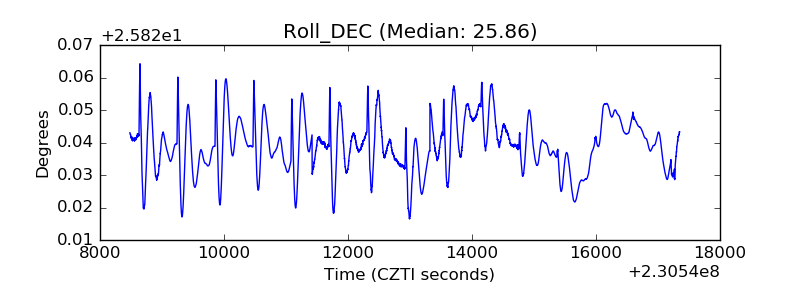 |
| _Roll_RA | 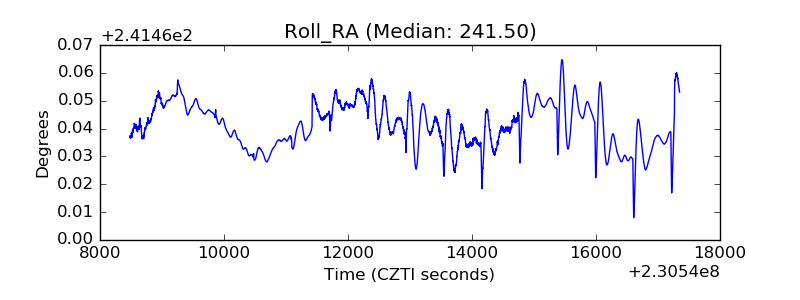 |
| Veto Counter | 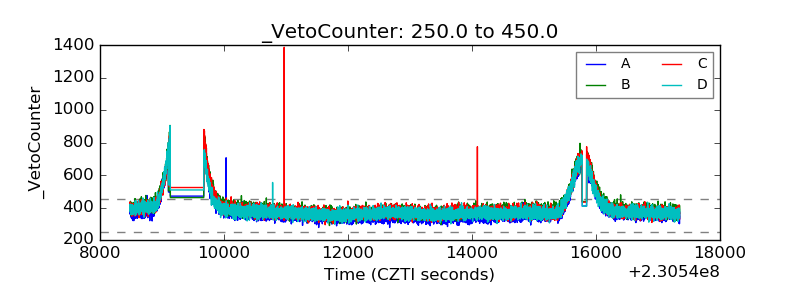 |