| Param | Original file | Final file |
|---|---|---|
| Filename | modeM0/AS1A03_030T01_9000001194cztM0_level2.fits | modeM0/AS1A03_030T01_9000001194cztM0_level2_quad_clean.evt |
| Size (bytes) | 317,949,120 | 285,940,800 |
| Size | 303.2 MB | 272.7 MB |
| Events in quadrant A | 1,931,772 | 1,697,063 |
| Events in quadrant B | 1,865,508 | 1,677,145 |
| Events in quadrant C | 1,899,536 | 1,603,612 |
| Events in quadrant D | 1,504,872 | 1,256,114 |
| Mode SS | |||
|---|---|---|---|
| Quadrant | BADHDUFLAG | Total packets | Discarded packets |
| A | 0 | 714 | 0 |
| B | 0 | 714 | 0 |
| C | 0 | 714 | 0 |
| D | 0 | 714 | 0 |
| Mode M0 | |||
|---|---|---|---|
| Quadrant | BADHDUFLAG | Total packets | Discarded packets |
| A | 0 | 72776 | 0 |
| B | 0 | 73779 | 0 |
| C | 0 | 72422 | 0 |
| D | 0 | 115510 | 0 |
| Mode M9 | |||
|---|---|---|---|
| Quadrant | BADHDUFLAG | Total packets | Discarded packets |
| A | 0 | 47 | 0 |
| B | 0 | 47 | 0 |
| C | 0 | 47 | 0 |
| D | 0 | 47 | 0 |
| Quadrant | Total seconds | Saturated seconds | Saturation percentage |
|---|---|---|---|
| A | 35313 | 588 | 1.665109% |
| B | 35315 | 660 | 1.868894% |
| C | 35313 | 417 | 1.180868% |
| D | 35312 | 5169 | 14.638083% |
Noise dominated data is calculated using 1-second bins in cleaned event files. If a bin has >2000 counts, and if more than 50% of those come from <1% of pixels, then it is considered to be noise-dominated and hence unusable.
| Quadrant | # 1 sec bins | Bins with >0 counts | Bins with >2000 counts | High rate bins dominated by noise | Noise dominated (total time) | Noise dominated (detector-on time) | Marked lightcurve |
|---|---|---|---|---|---|---|---|
| A | 39781 | 35314 | 0 | 0 | 0.00% | 0.00% |  |
| B | 39781 | 35312 | 0 | 0 | 0.00% | 0.00% |  |
| C | 39781 | 35314 | 0 | 0 | 0.00% | 0.00% |  |
| D | 39781 | 34416 | 0 | 0 | 0.00% | 0.00% |  |
Top three noisy pixels from each quadrant. If the there are fewer than three noisy pixels in the level2.evt file, extra rows are filled as -1
| Pixel properties | Quadrant properties | ||||||
|---|---|---|---|---|---|---|---|
| Quadrant | DetID | PixID | Counts | Sigma | Mean | Median | Sigma |
| A | 14 | 188 | 1866 | 10.91 | 499 | 465 | 128.4 |
| A | 0 | 29 | 1799 | 10.39 | 499 | 465 | 128.4 |
| A | 14 | 204 | 1597 | 8.81 | 499 | 465 | 128.4 |
| B | 2 | 9 | 1554 | 10.67 | 491 | 462 | 102.3 |
| B | 12 | 226 | 1278 | 7.98 | 491 | 462 | 102.3 |
| B | 3 | 17 | 1264 | 7.84 | 491 | 462 | 102.3 |
| C | 1 | 81 | 1435 | 7.2 | 501 | 460 | 135.4 |
| C | 1 | 80 | 1395 | 6.91 | 501 | 460 | 135.4 |
| C | 12 | 241 | 1360 | 6.65 | 501 | 460 | 135.4 |
| D | 3 | 14 | 1099 | 5.98 | 428 | 388 | 118.9 |
| D | 6 | 231 | 1084 | 5.85 | 428 | 388 | 118.9 |
| D | 11 | 82 | 1080 | 5.82 | 428 | 388 | 118.9 |
Histogram calculated using DETX and DETY for each event in the final _common_clean file
| Quadrant A |  |
 |
Quadrant B |
|---|---|---|---|
| Quadrant D |  |
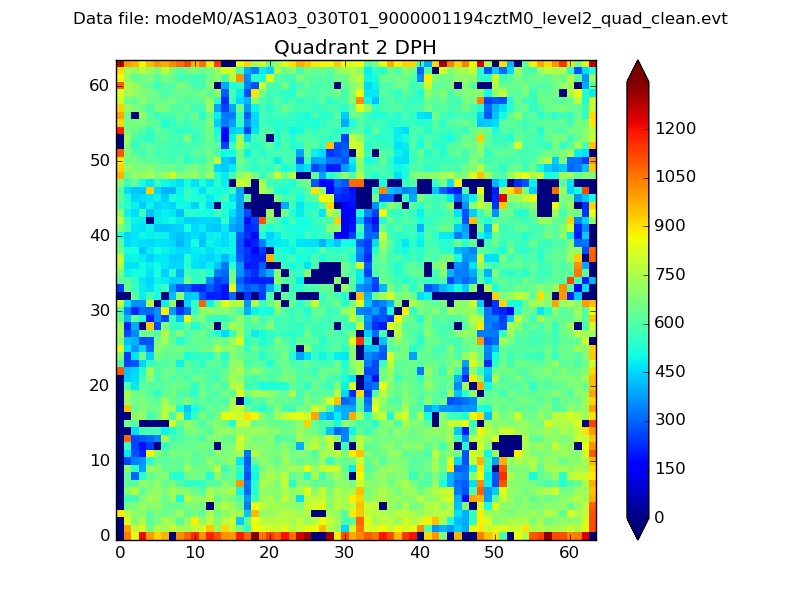 |
Quadrant C |
| Plot type | Count rate plots | Images |
|---|---|---|
| Comparison with Poisson distribution Blue bars denote a histogram of data divided into 1 sec bins. Red curve is a Poisson curve with rate = median count rate of data. |
 |
 |
| Quadrant-wise count rates Data is divided into 100 sec bins |
 |
|
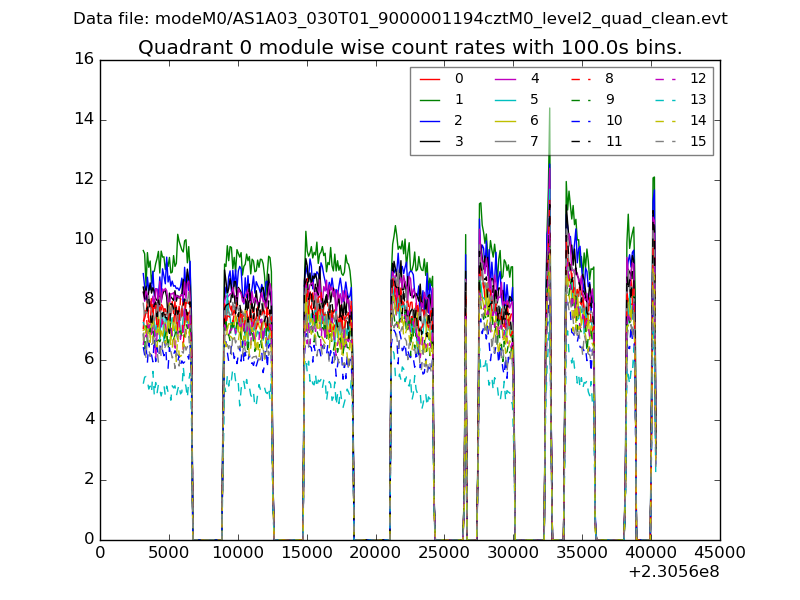
| Module-wise count rates for Quadrant A Data is divided into 100 sec bins |
 |
 |
| Module-wise count rates for Quadrant B Data is divided into 100 sec bins |
 |
 |
| Module-wise count rates for Quadrant C Data is divided into 100 sec bins |
 |
 |
| Module-wise count rates for Quadrant D Data is divided into 100 sec bins |
 |
 |
| Parameter | Plot |
|---|---|
| CZT HV Monitor |  |
| D_VDD | 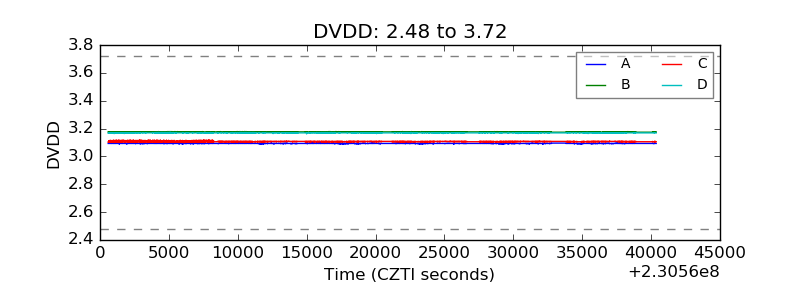 |
| Temperature 1 |  |
| Veto HV Monitor |  |
| Veto LLD |  |
| Alpha Counter |  |
| _CPM_Rate |  |
| CZT Counter | 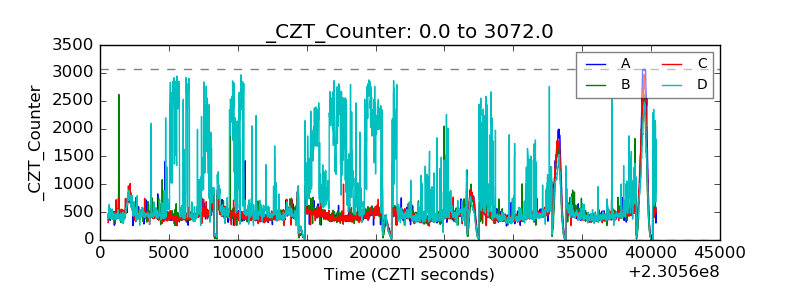 |
| +2.5 Volts monitor |  |
| +5 Volts monitor |  |
| _ROLL_ROT |  |
| _Roll_DEC |  |
| _Roll_RA |  |
| Veto Counter |  |