| Param | Original file | Final file |
|---|---|---|
| Filename | modeM0/AS1A03_030T01_9000001194_08472cztM0_level2.evt | modeM0/AS1A03_030T01_9000001194_08472cztM0_level2_quad_clean.evt |
| Size (bytes) | 220,440,960 | 19,370,880 |
| Size | 210.2 MB | 18.5 MB |
| Events in quadrant A | 1,598,953 | 90,573 |
| Events in quadrant B | 1,649,685 | 92,397 |
| Events in quadrant C | 1,584,776 | 90,076 |
| Events in quadrant D | 1,624,396 | 86,499 |
| Mode SS | |||
|---|---|---|---|
| Quadrant | BADHDUFLAG | Total packets | Discarded packets |
| A | 0 | 64 | 0 |
| B | 0 | 64 | 0 |
| C | 0 | 64 | 0 |
| D | 0 | 64 | 0 |
| Mode M0 | |||
|---|---|---|---|
| Quadrant | BADHDUFLAG | Total packets | Discarded packets |
| A | 0 | 6825 | 1 |
| B | 0 | 6928 | 0 |
| C | 0 | 6790 | 0 |
| D | 0 | 7008 | 0 |
| Quadrant | Total seconds | Saturated seconds | Saturation percentage |
|---|---|---|---|
| A | 3179 | 204 | 6.417112% |
| B | 3179 | 217 | 6.826046% |
| C | 3179 | 122 | 3.837685% |
| D | 3179 | 125 | 3.932054% |
Noise dominated data is calculated using 1-second bins in cleaned event files. If a bin has >2000 counts, and if more than 50% of those come from <1% of pixels, then it is considered to be noise-dominated and hence unusable.
| Quadrant | # 1 sec bins | Bins with >0 counts | Bins with >2000 counts | High rate bins dominated by noise | Noise dominated (total time) | Noise dominated (detector-on time) | Marked lightcurve |
|---|---|---|---|---|---|---|---|
| A | 3179 | 3179 | 0 | 0 | 0.00% | 0.00% | 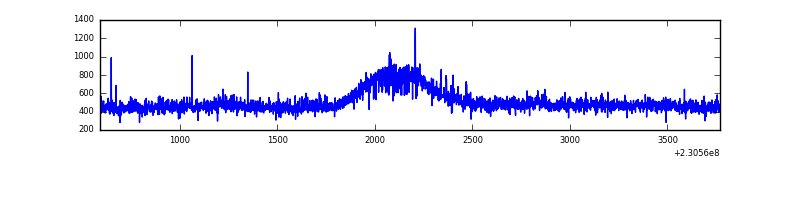 |
| B | 3179 | 3179 | 9 | 9 | 0.28% | 0.28% | 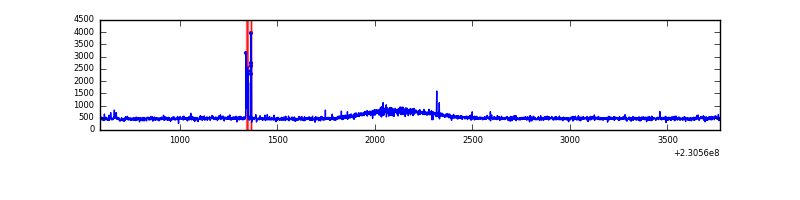 |
| C | 3179 | 3179 | 0 | 0 | 0.00% | 0.00% | 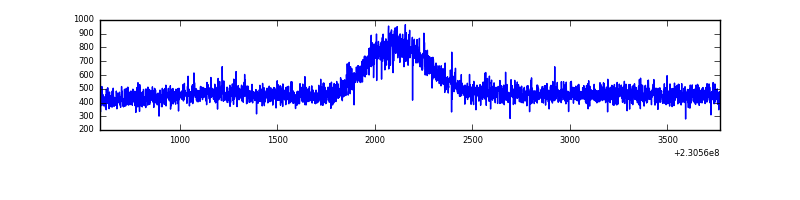 |
| D | 3179 | 3179 | 4 | 4 | 0.13% | 0.13% | 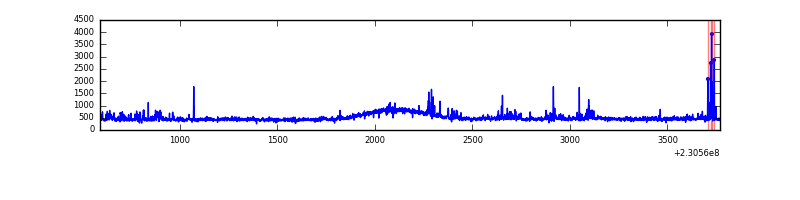 |
Top three noisy pixels from each quadrant. If the there are fewer than three noisy pixels in the level2.evt file, extra rows are filled as -1
| Pixel properties | Quadrant properties | ||||||
|---|---|---|---|---|---|---|---|
| Quadrant | DetID | PixID | Counts | Sigma | Mean | Median | Sigma |
| A | 13 | 14 | 8030 | 87.73 | 410 | 400 | 87.0 |
| A | 13 | 248 | 6636 | 71.71 | 410 | 400 | 87.0 |
| A | 0 | 226 | 3876 | 39.97 | 410 | 400 | 87.0 |
| B | 10 | 252 | 34582 | 416.05 | 412 | 400 | 82.2 |
| B | 5 | 255 | 10816 | 126.78 | 412 | 400 | 82.2 |
| B | 12 | 111 | 9637 | 112.43 | 412 | 400 | 82.2 |
| C | 8 | 128 | 8396 | 83.28 | 401 | 400 | 96.0 |
| C | 8 | 112 | 3811 | 35.53 | 401 | 400 | 96.0 |
| C | 8 | 144 | 3318 | 30.39 | 401 | 400 | 96.0 |
| D | 1 | 52 | 47558 | 484.23 | 398 | 384 | 97.4 |
| D | 2 | 136 | 30720 | 311.39 | 398 | 384 | 97.4 |
| D | 7 | 71 | 20267 | 204.09 | 398 | 384 | 97.4 |
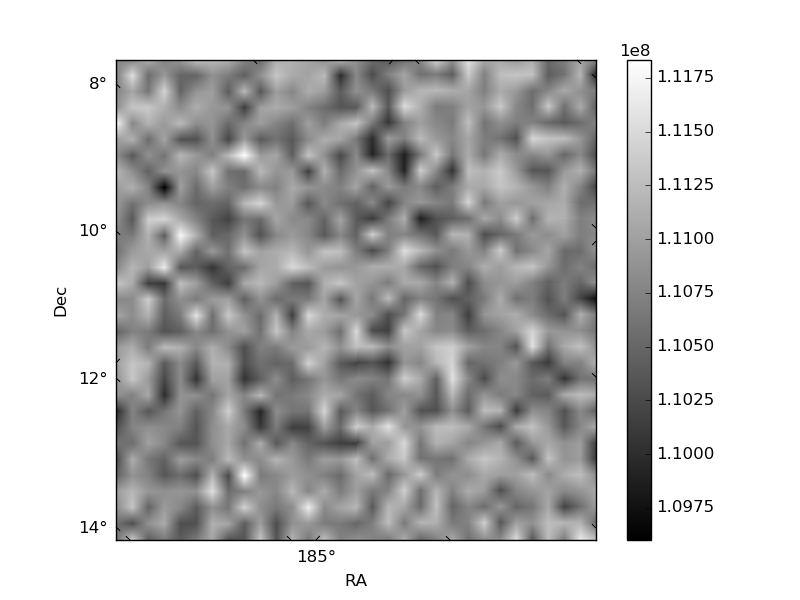
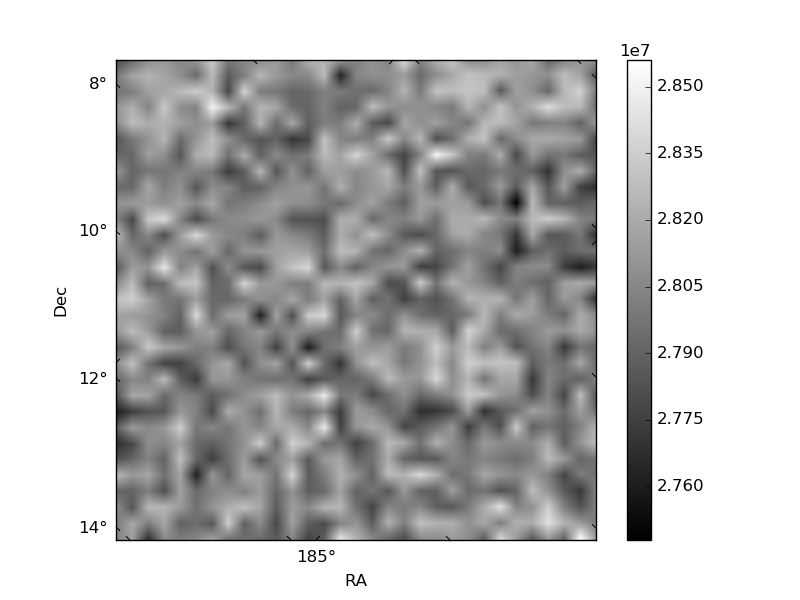
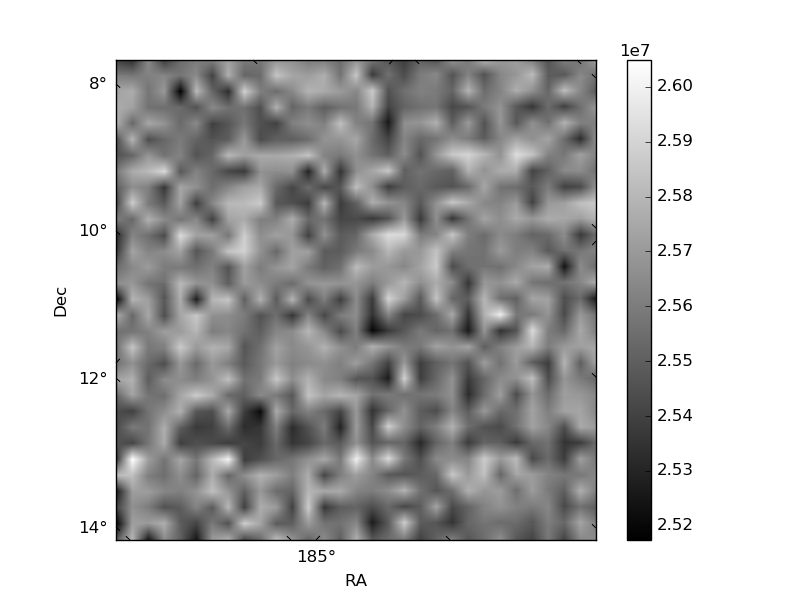
Histogram calculated using DETX and DETY for each event in the final _common_clean file
| Quadrant A | 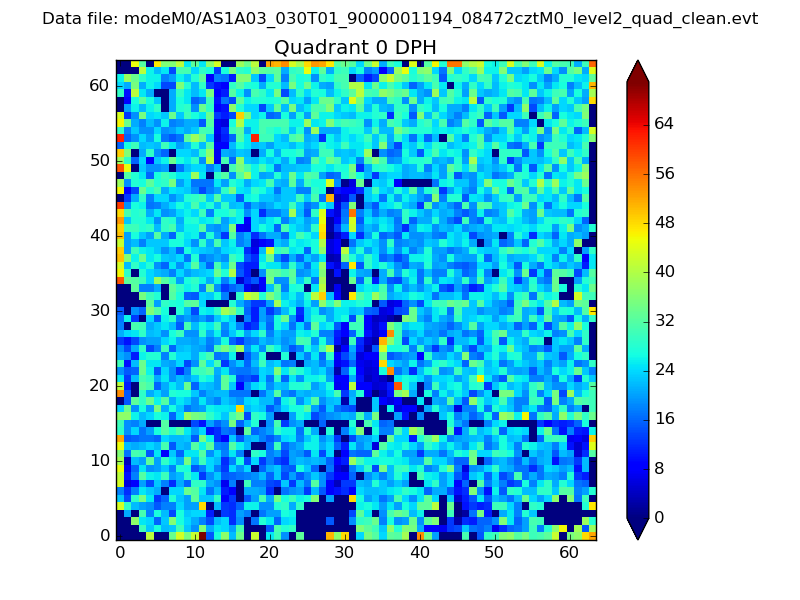 |
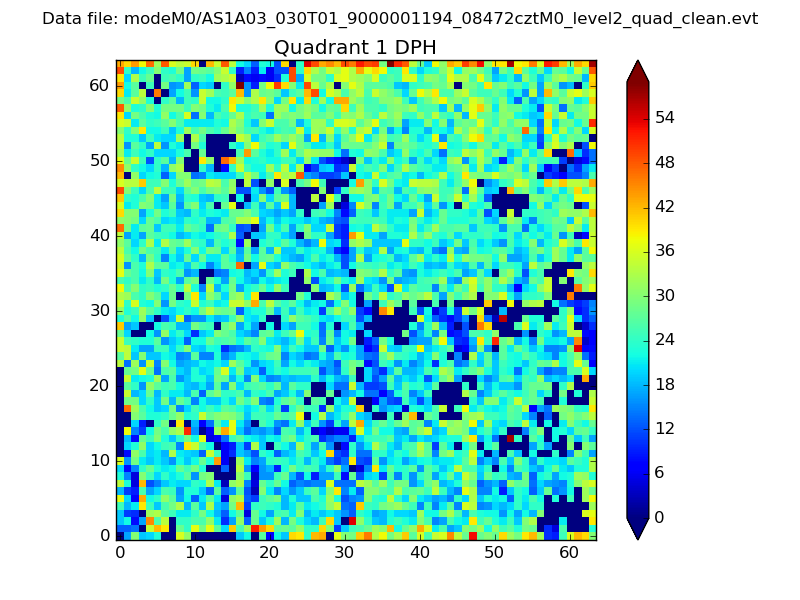 |
Quadrant B |
|---|---|---|---|
| Quadrant D | 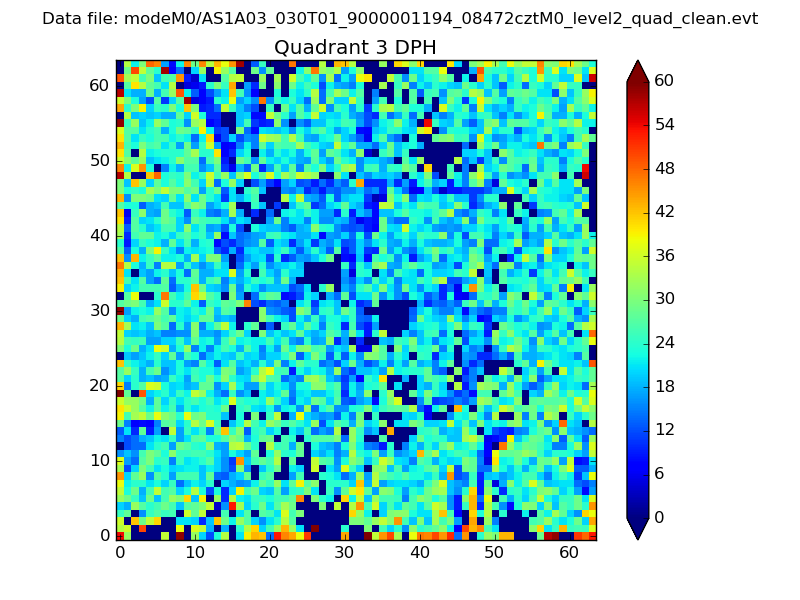 |
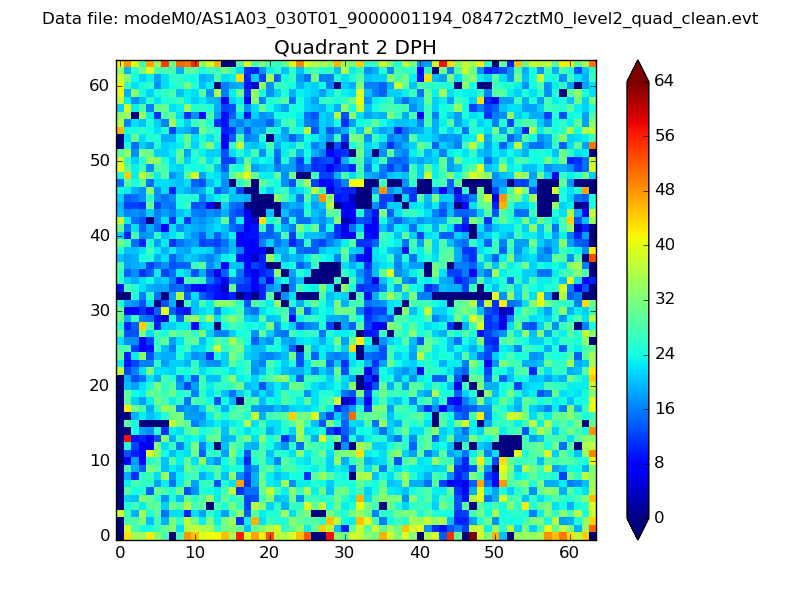 |
Quadrant C |
| Plot type | Count rate plots | Images |
|---|---|---|
| Comparison with Poisson distribution Blue bars denote a histogram of data divided into 1 sec bins. Red curve is a Poisson curve with rate = median count rate of data. |
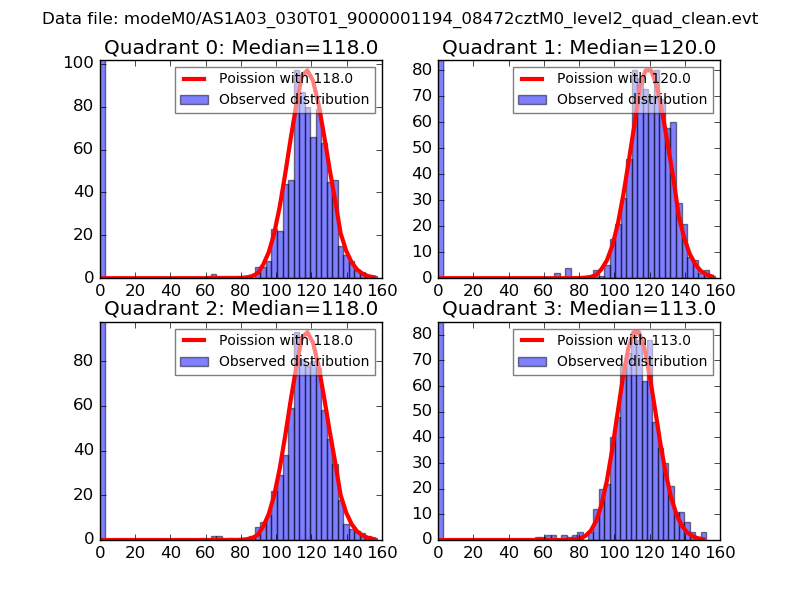 |
 |
| Quadrant-wise count rates Data is divided into 100 sec bins |
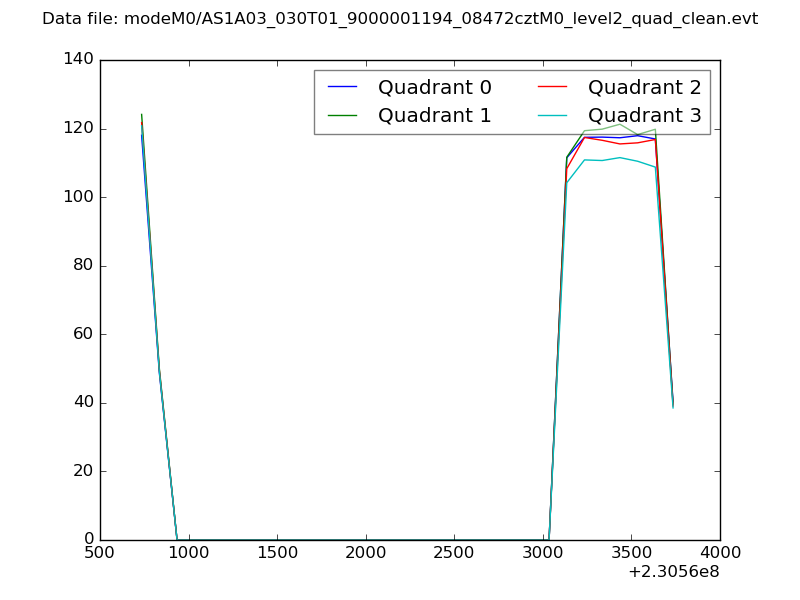 |
|
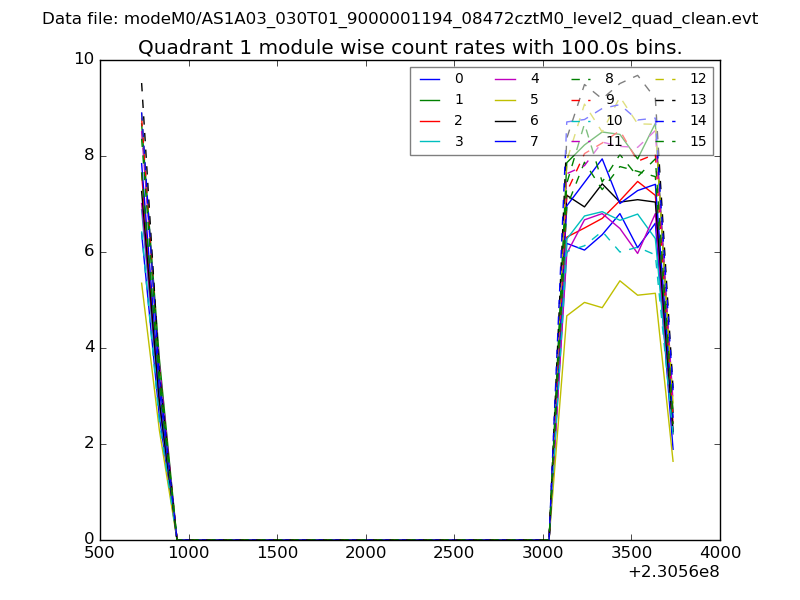
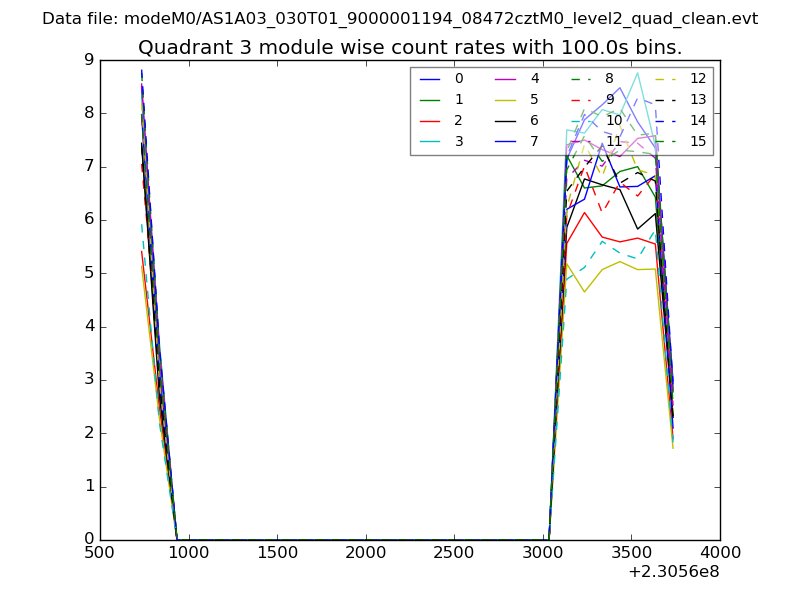
| Module-wise count rates for Quadrant A Data is divided into 100 sec bins |
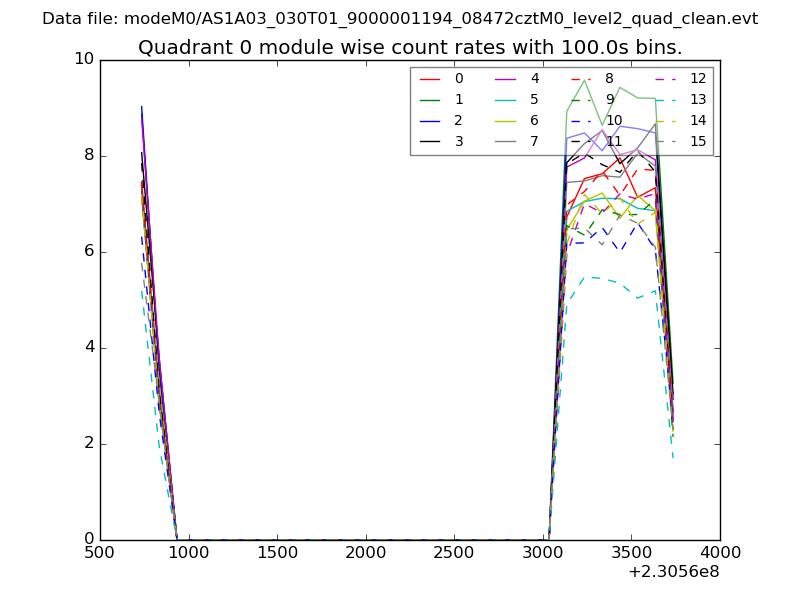 |
 |
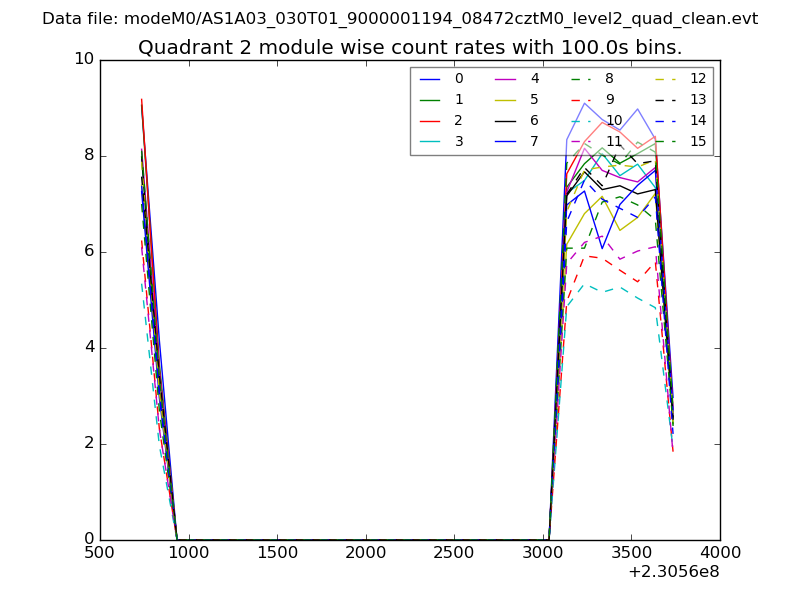
| Module-wise count rates for Quadrant B Data is divided into 100 sec bins |
 |
 |
| Module-wise count rates for Quadrant C Data is divided into 100 sec bins |
 |
 |
| Module-wise count rates for Quadrant D Data is divided into 100 sec bins |
 |
 |
| Parameter | Plot |
|---|---|
| CZT HV Monitor | 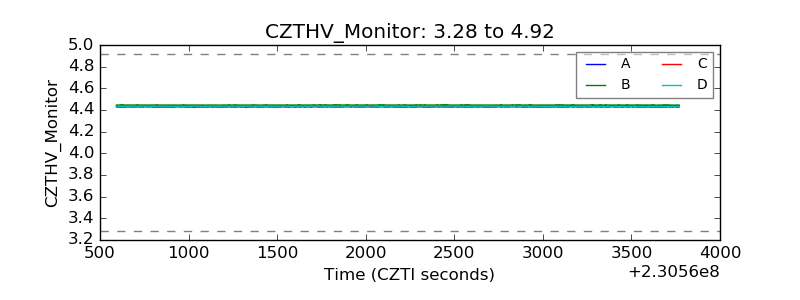 |
| D_VDD | 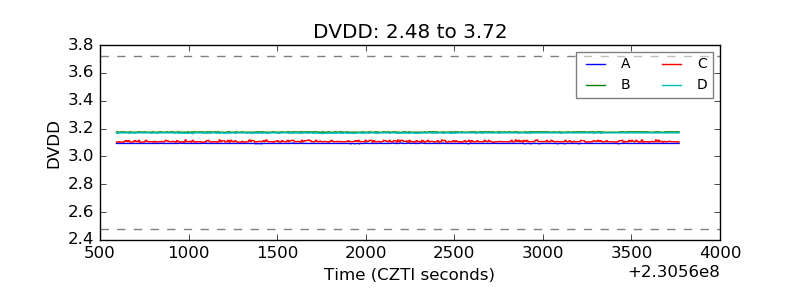 |
| Temperature 1 |  |
| Veto HV Monitor | 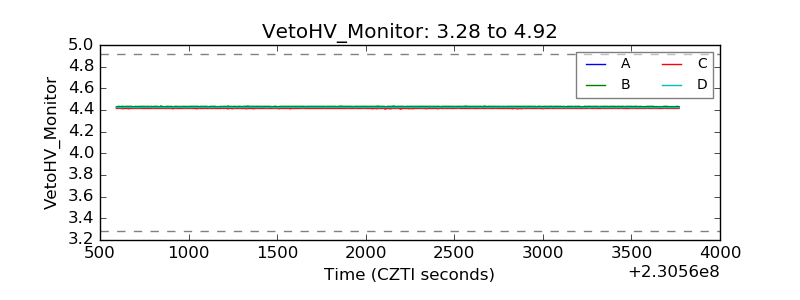 |
| Veto LLD | 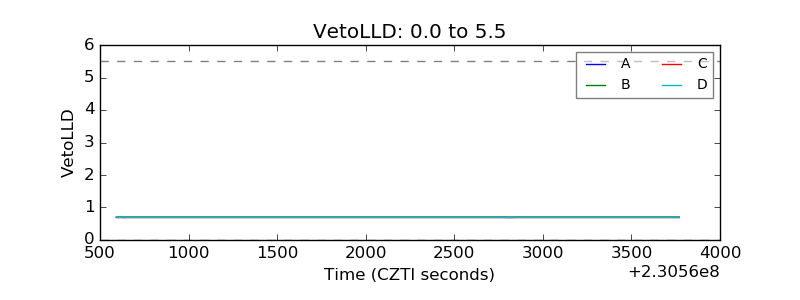 |
| Alpha Counter | 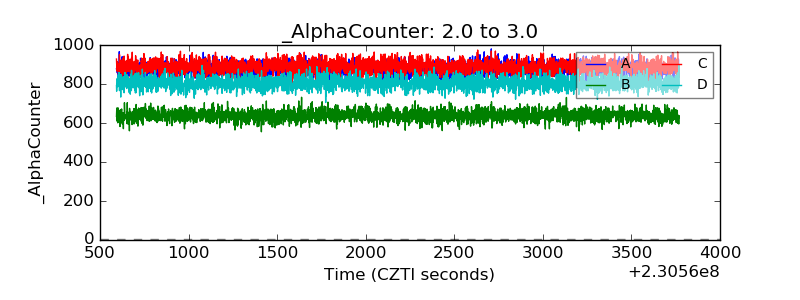 |
| _CPM_Rate | 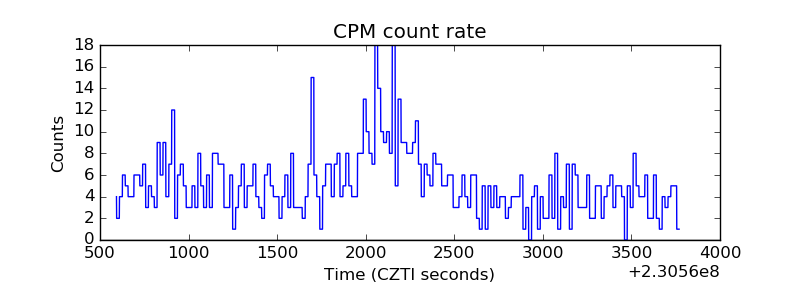 |
| CZT Counter | 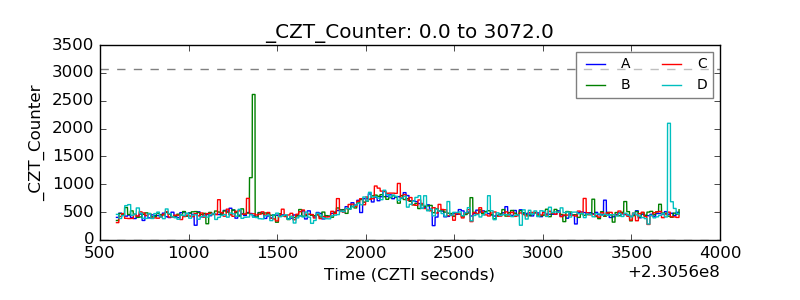 |
| +2.5 Volts monitor |  |
| +5 Volts monitor |  |
| _ROLL_ROT | 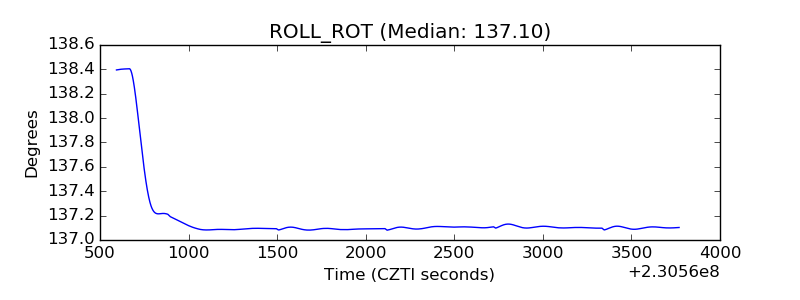 |
| _Roll_DEC | 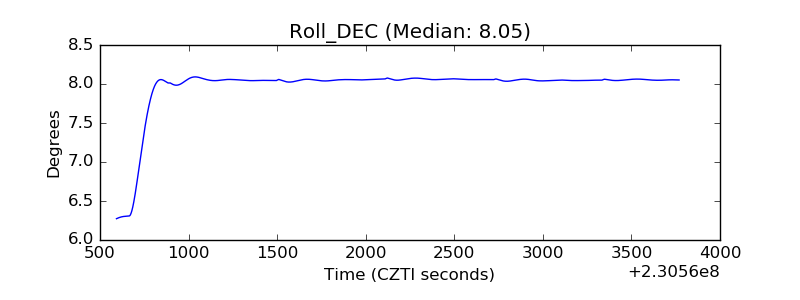 |
| _Roll_RA | 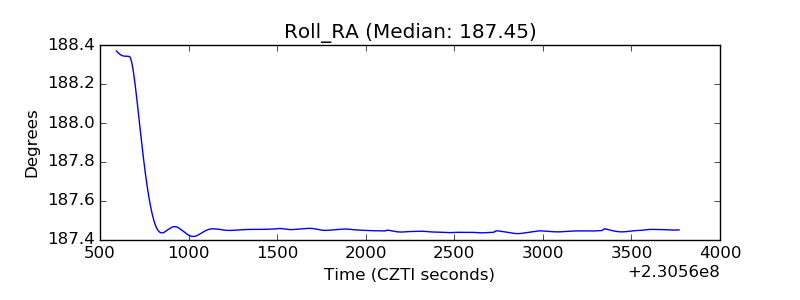 |
| Veto Counter | 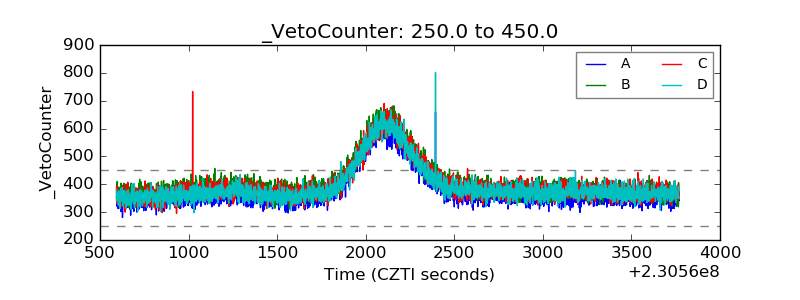 |