| Param | Original file | Final file |
|---|---|---|
| Filename | modeM0/AS1A03_030T01_9000001194_08479cztM0_level2.evt | modeM0/AS1A03_030T01_9000001194_08479cztM0_level2_quad_clean.evt |
| Size (bytes) | 365,371,200 | 65,280,960 |
| Size | 348.4 MB | 62.3 MB |
| Events in quadrant A | 2,488,661 | 406,477 |
| Events in quadrant B | 2,669,387 | 409,255 |
| Events in quadrant C | 2,419,329 | 402,208 |
| Events in quadrant D | 3,121,592 | 382,094 |
| Mode SS | |||
|---|---|---|---|
| Quadrant | BADHDUFLAG | Total packets | Discarded packets |
| A | 0 | 108 | 0 |
| B | 0 | 108 | 0 |
| C | 0 | 108 | 0 |
| D | 0 | 108 | 0 |
| Mode M0 | |||
|---|---|---|---|
| Quadrant | BADHDUFLAG | Total packets | Discarded packets |
| A | 0 | 11076 | 2 |
| B | 0 | 11527 | 2 |
| C | 0 | 10976 | 2 |
| D | 0 | 13255 | 2 |
| Mode M9 | |||
|---|---|---|---|
| Quadrant | BADHDUFLAG | Total packets | Discarded packets |
| A | 0 | 19 | 0 |
| B | 0 | 19 | 0 |
| C | 0 | 19 | 0 |
| D | 0 | 20 | 0 |
| Quadrant | Total seconds | Saturated seconds | Saturation percentage |
|---|---|---|---|
| A | 5383 | 19 | 0.352963% |
| B | 5383 | 47 | 0.873119% |
| C | 5383 | 14 | 0.260078% |
| D | 5383 | 153 | 2.842281% |
Noise dominated data is calculated using 1-second bins in cleaned event files. If a bin has >2000 counts, and if more than 50% of those come from <1% of pixels, then it is considered to be noise-dominated and hence unusable.
| Quadrant | # 1 sec bins | Bins with >0 counts | Bins with >2000 counts | High rate bins dominated by noise | Noise dominated (total time) | Noise dominated (detector-on time) | Marked lightcurve |
|---|---|---|---|---|---|---|---|
| A | 6573 | 5384 | 1 | 1 | 0.02% | 0.02% | 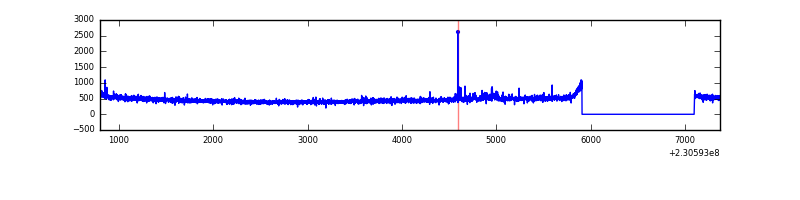 |
| B | 6573 | 5384 | 16 | 16 | 0.24% | 0.30% | 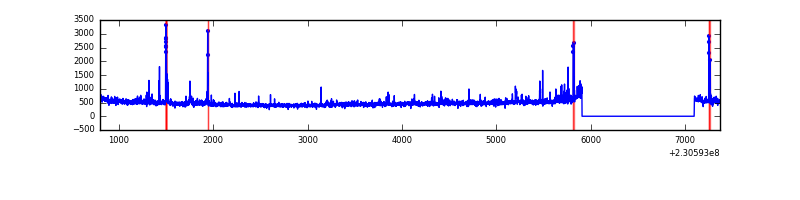 |
| C | 6573 | 5384 | 0 | 0 | 0.00% | 0.00% | 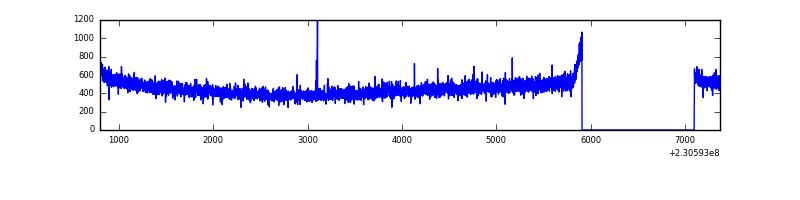 |
| D | 6573 | 5384 | 97 | 97 | 1.48% | 1.80% |  |
Top three noisy pixels from each quadrant. If the there are fewer than three noisy pixels in the level2.evt file, extra rows are filled as -1
| Pixel properties | Quadrant properties | ||||||
|---|---|---|---|---|---|---|---|
| Quadrant | DetID | PixID | Counts | Sigma | Mean | Median | Sigma |
| A | 4 | 2 | 35894 | 271.89 | 635 | 621 | 129.7 |
| A | 13 | 251 | 6681 | 46.71 | 635 | 621 | 129.7 |
| A | 0 | 226 | 5846 | 40.28 | 635 | 621 | 129.7 |
| B | 0 | 214 | 58461 | 469.12 | 636 | 621 | 123.3 |
| B | 5 | 255 | 57475 | 461.12 | 636 | 621 | 123.3 |
| B | 0 | 245 | 34062 | 271.23 | 636 | 621 | 123.3 |
| C | 9 | 54 | 5256 | 31.99 | 618 | 620 | 144.9 |
| C | 13 | 61 | 4571 | 27.27 | 618 | 620 | 144.9 |
| C | 8 | 222 | 3203 | 17.82 | 618 | 620 | 144.9 |
| D | 1 | 52 | 655023 | 4336.67 | 605 | 590 | 150.9 |
| D | 12 | 221 | 65776 | 431.96 | 605 | 590 | 150.9 |
| D | 2 | 136 | 36680 | 239.15 | 605 | 590 | 150.9 |
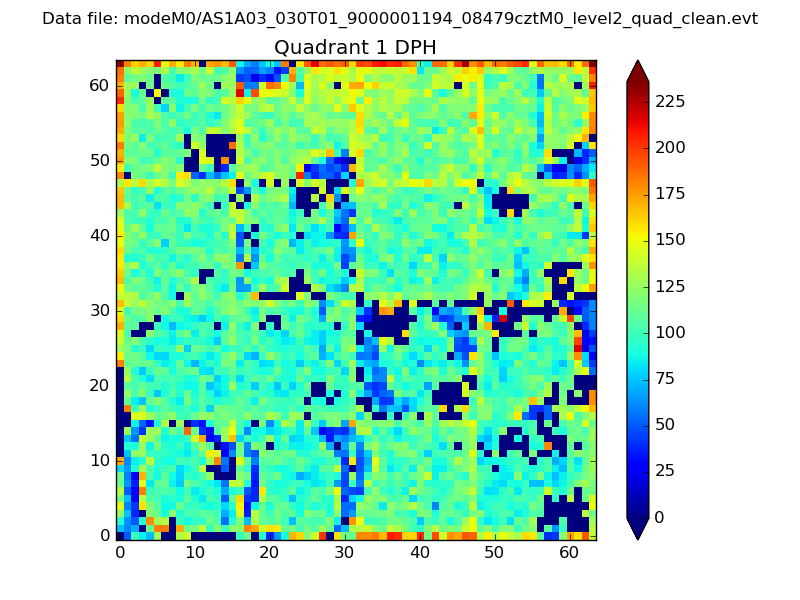
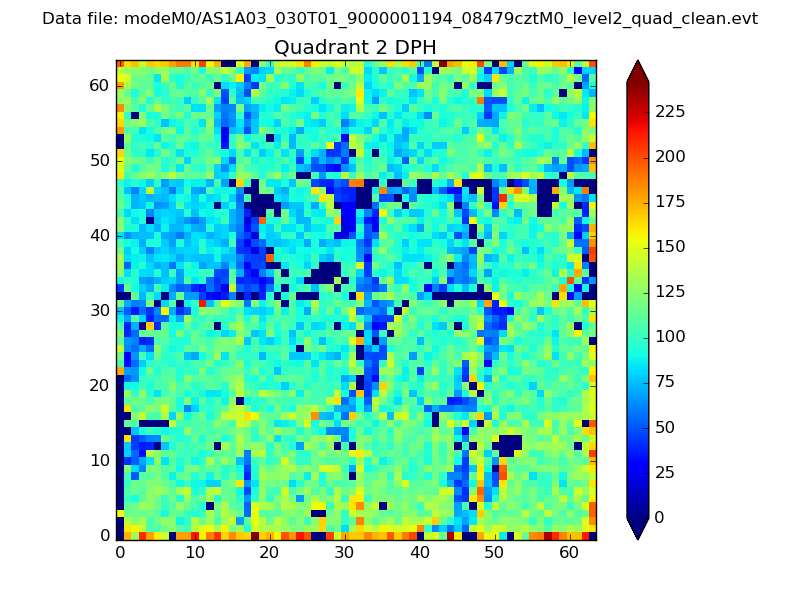
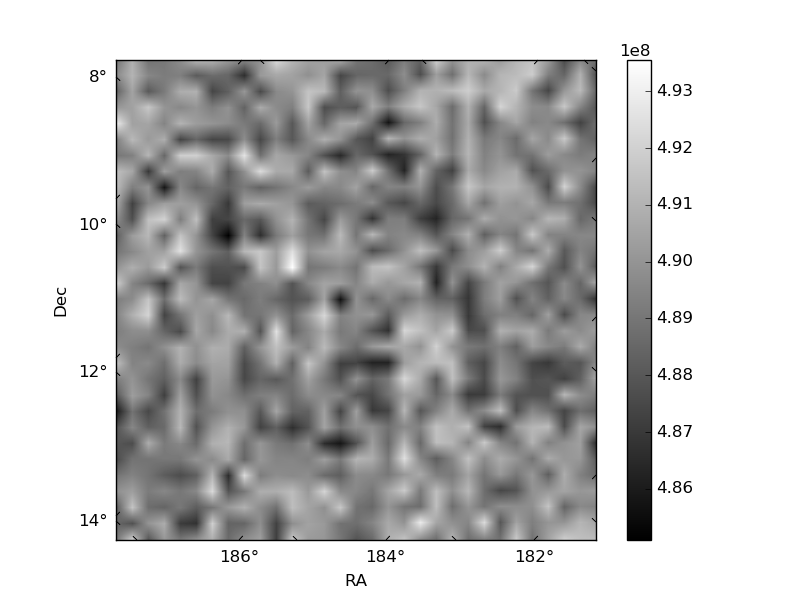
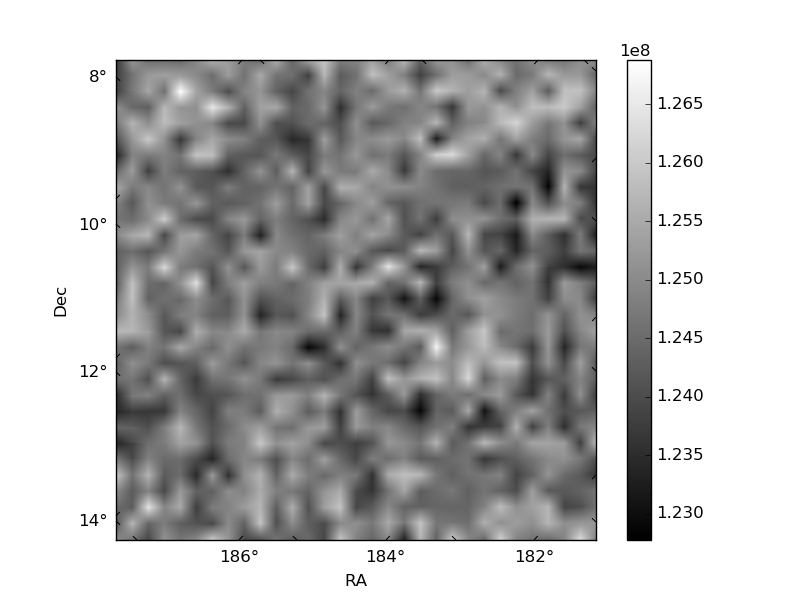
Histogram calculated using DETX and DETY for each event in the final _common_clean file
| Quadrant A | 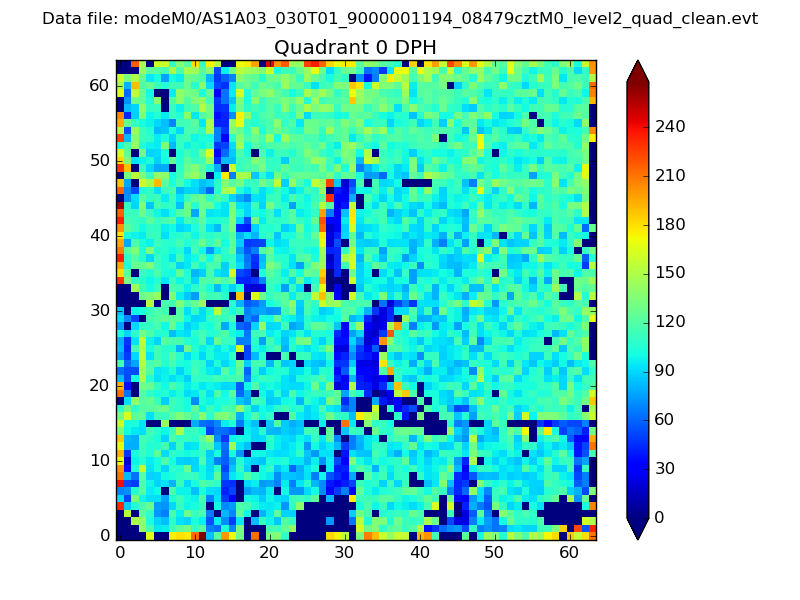 |
 |
Quadrant B |
|---|---|---|---|
| Quadrant D | 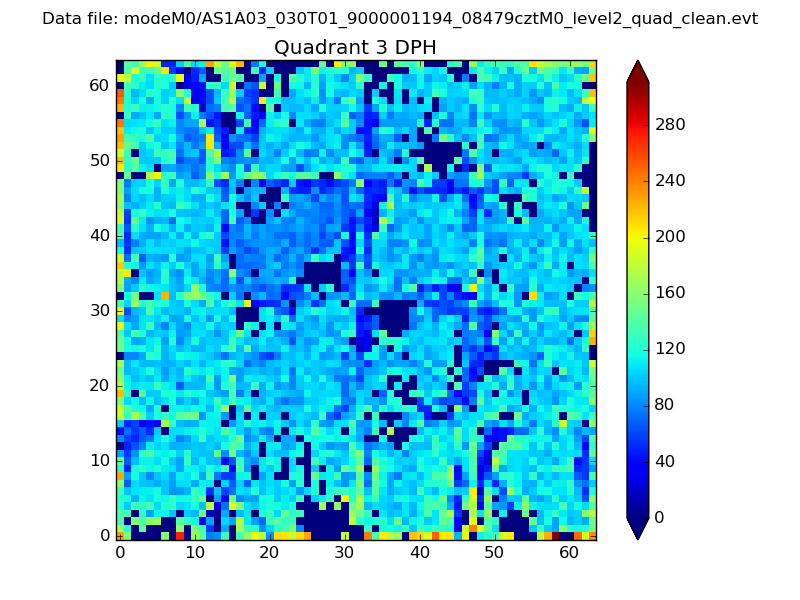 |
 |
Quadrant C |
| Plot type | Count rate plots | Images |
|---|---|---|
| Comparison with Poisson distribution Blue bars denote a histogram of data divided into 1 sec bins. Red curve is a Poisson curve with rate = median count rate of data. |
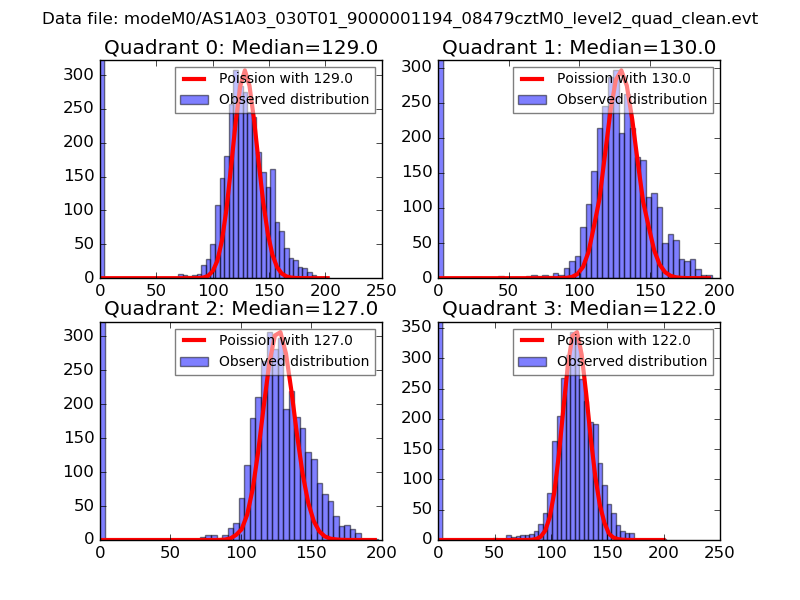 |
 |
| Quadrant-wise count rates Data is divided into 100 sec bins |
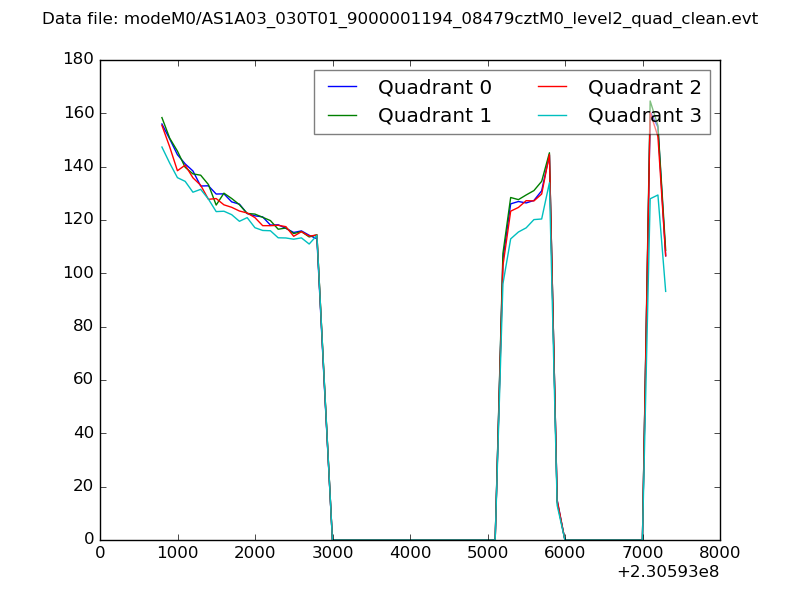 |
|
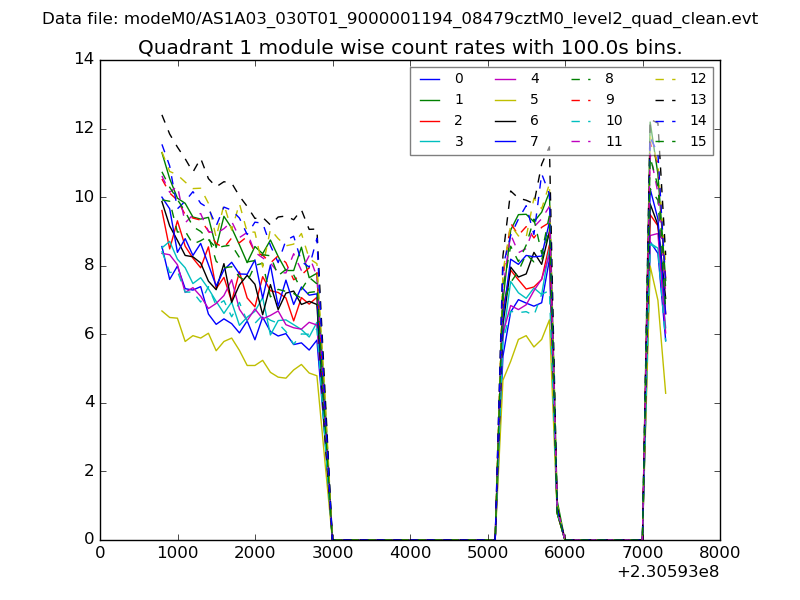
| Module-wise count rates for Quadrant A Data is divided into 100 sec bins |
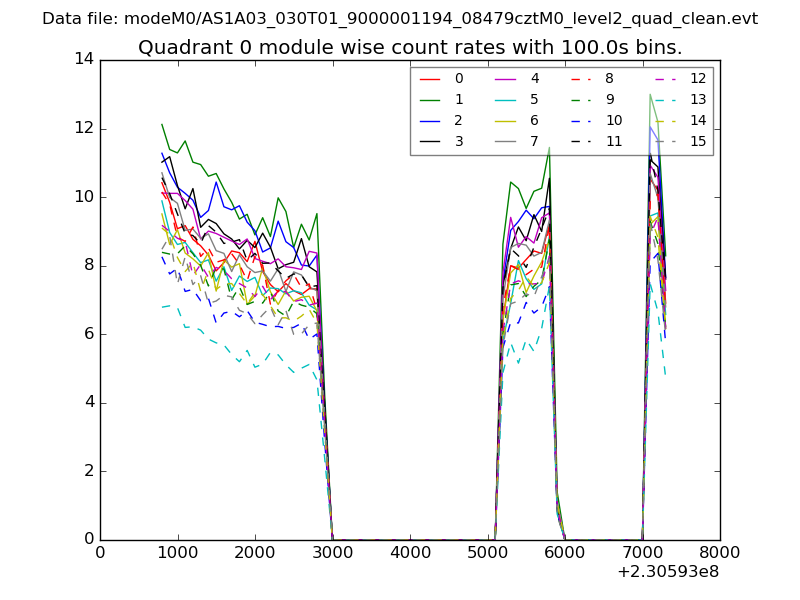 |
 |
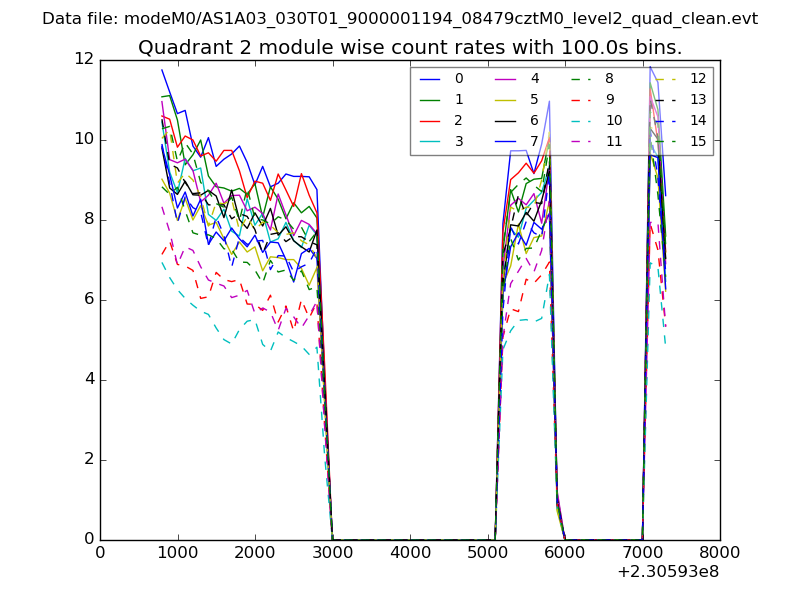
| Module-wise count rates for Quadrant B Data is divided into 100 sec bins |
 |
 |
| Module-wise count rates for Quadrant C Data is divided into 100 sec bins |
 |
 |
| Module-wise count rates for Quadrant D Data is divided into 100 sec bins |
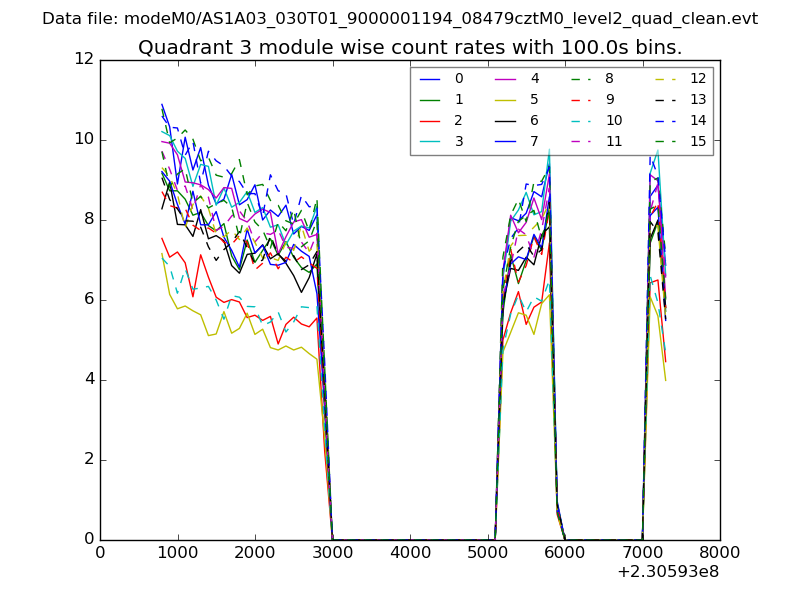 |
 |
| Parameter | Plot |
|---|---|
| CZT HV Monitor | 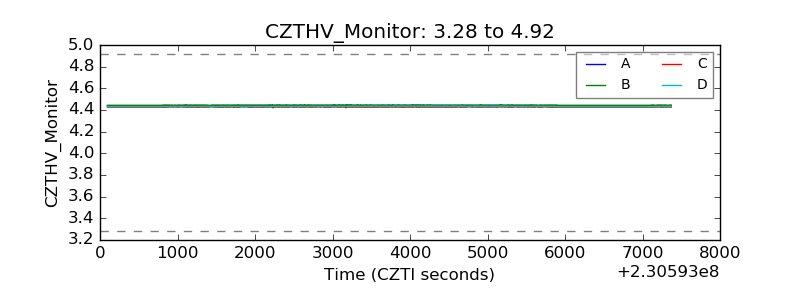 |
| D_VDD |  |
| Temperature 1 | 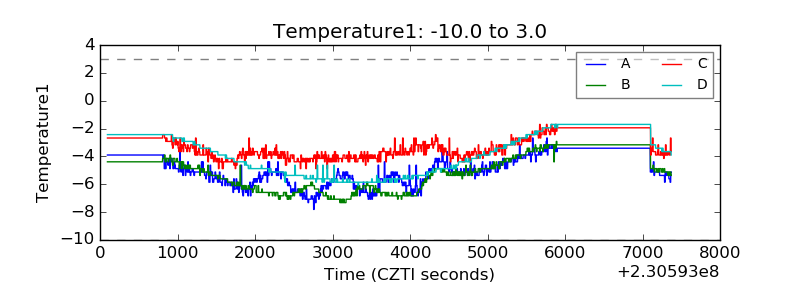 |
| Veto HV Monitor | 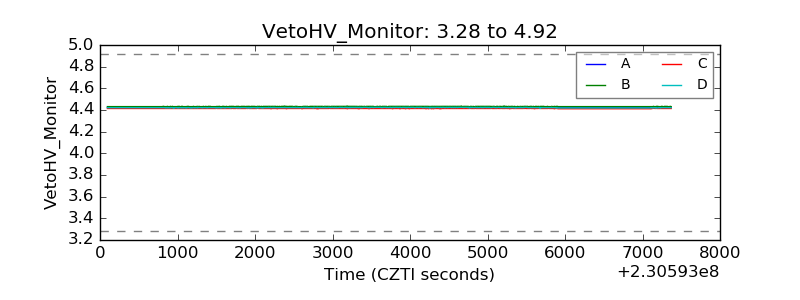 |
| Veto LLD | 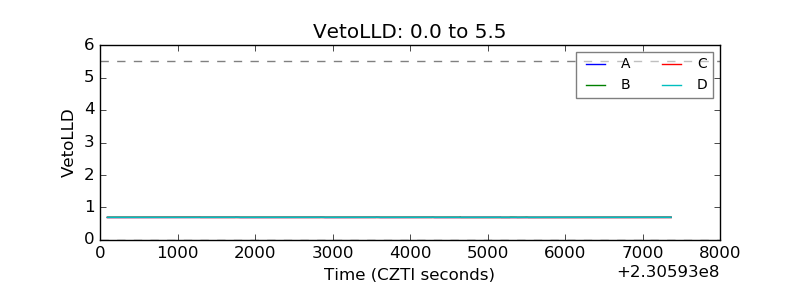 |
| Alpha Counter | 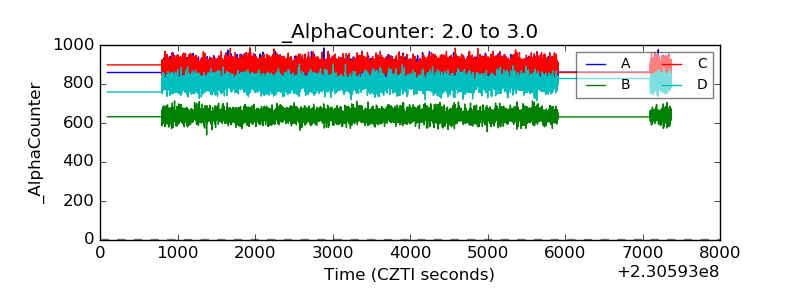 |
| _CPM_Rate | 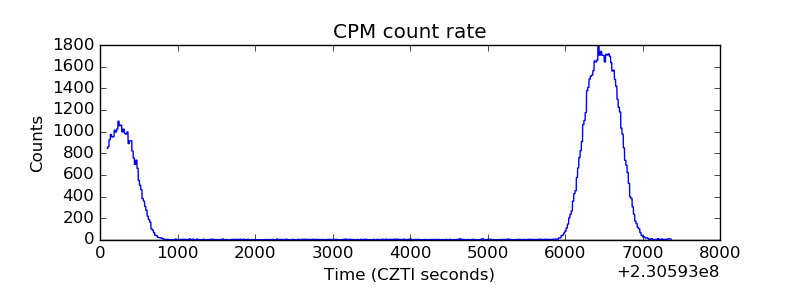 |
| CZT Counter | 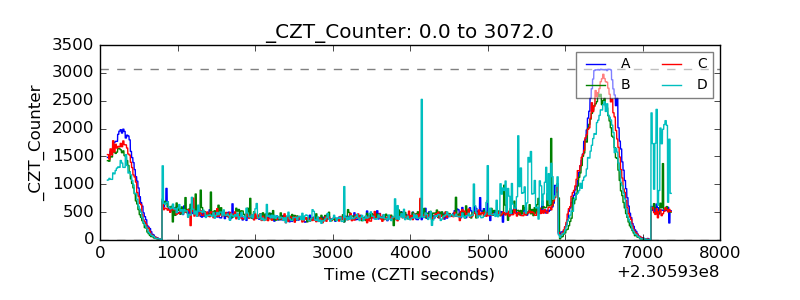 |
| +2.5 Volts monitor |  |
| +5 Volts monitor |  |
| _ROLL_ROT | 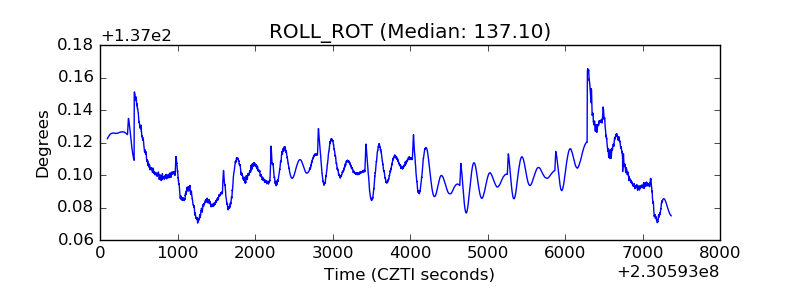 |
| _Roll_DEC | 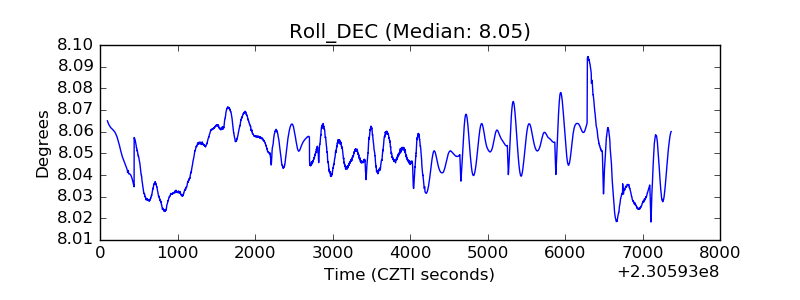 |
| _Roll_RA |  |
| Veto Counter | 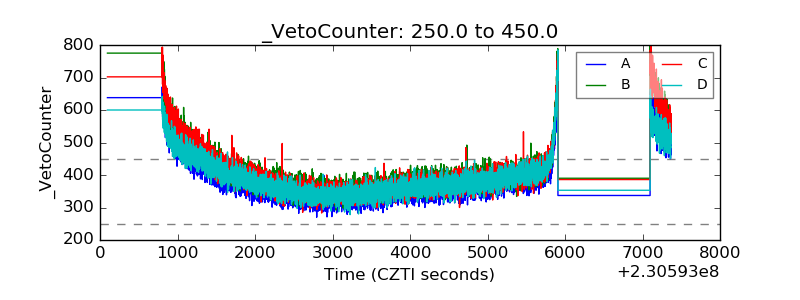 |