| Param | Original file | Final file |
|---|---|---|
| Filename | modeM0/AS1A03_030T01_9000001194_08480cztM0_level2.evt | modeM0/AS1A03_030T01_9000001194_08480cztM0_level2_quad_clean.evt |
| Size (bytes) | 42,059,520 | 8,527,680 |
| Size | 40.1 MB | 8.1 MB |
| Events in quadrant A | 226,325 | 57,768 |
| Events in quadrant B | 261,579 | 58,608 |
| Events in quadrant C | 223,572 | 57,387 |
| Events in quadrant D | 533,200 | 49,416 |
| Mode SS | |||
|---|---|---|---|
| Quadrant | BADHDUFLAG | Total packets | Discarded packets |
| A | 0 | 8 | 0 |
| B | 0 | 8 | 0 |
| C | 0 | 8 | 0 |
| D | 0 | 8 | 0 |
| Mode M0 | |||
|---|---|---|---|
| Quadrant | BADHDUFLAG | Total packets | Discarded packets |
| A | 0 | 891 | 1 |
| B | 0 | 1025 | 1 |
| C | 0 | 887 | 1 |
| D | 0 | 1853 | 1 |
| Mode M9 | |||
|---|---|---|---|
| Quadrant | BADHDUFLAG | Total packets | Discarded packets |
| A | 0 | 12 | 0 |
| B | 0 | 12 | 0 |
| C | 0 | 12 | 0 |
| D | 0 | 12 | 0 |
| Quadrant | Total seconds | Saturated seconds | Saturation percentage |
|---|---|---|---|
| A | 383 | 15 | 3.916449% |
| B | 383 | 29 | 7.571802% |
| C | 383 | 10 | 2.610966% |
| D | 383 | 93 | 24.281984% |
Noise dominated data is calculated using 1-second bins in cleaned event files. If a bin has >2000 counts, and if more than 50% of those come from <1% of pixels, then it is considered to be noise-dominated and hence unusable.
| Quadrant | # 1 sec bins | Bins with >0 counts | Bins with >2000 counts | High rate bins dominated by noise | Noise dominated (total time) | Noise dominated (detector-on time) | Marked lightcurve |
|---|---|---|---|---|---|---|---|
| A | 1573 | 384 | 0 | 0 | 0.00% | 0.00% |  |
| B | 1573 | 384 | 7 | 7 | 0.45% | 1.82% |  |
| C | 1573 | 384 | 0 | 0 | 0.00% | 0.00% |  |
| D | 1573 | 384 | 58 | 58 | 3.69% | 15.10% | 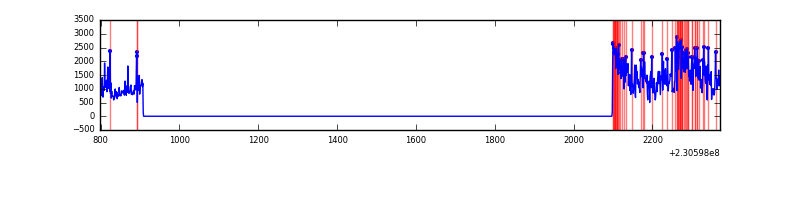 |
Top three noisy pixels from each quadrant. If the there are fewer than three noisy pixels in the level2.evt file, extra rows are filled as -1
| Pixel properties | Quadrant properties | ||||||
|---|---|---|---|---|---|---|---|
| Quadrant | DetID | PixID | Counts | Sigma | Mean | Median | Sigma |
| A | 0 | 226 | 565 | 35.6 | 58 | 57 | 14.3 |
| A | 12 | 194 | 530 | 33.15 | 58 | 57 | 14.3 |
| A | 13 | 251 | 264 | 14.51 | 58 | 57 | 14.3 |
| B | 0 | 231 | 16913 | 1241.4 | 57 | 56 | 13.6 |
| B | 0 | 214 | 14548 | 1067.24 | 57 | 56 | 13.6 |
| B | 11 | 51 | 2172 | 155.83 | 57 | 56 | 13.6 |
| C | 13 | 61 | 446 | 25.4 | 57 | 57 | 15.3 |
| C | 7 | 159 | 387 | 21.55 | 57 | 57 | 15.3 |
| C | 14 | 253 | 327 | 17.63 | 57 | 57 | 15.3 |
| D | 1 | 52 | 274709 | 18328.57 | 53 | 51 | 15.0 |
| D | 12 | 221 | 47239 | 3148.97 | 53 | 51 | 15.0 |
| D | 12 | 233 | 2374 | 155.02 | 53 | 51 | 15.0 |
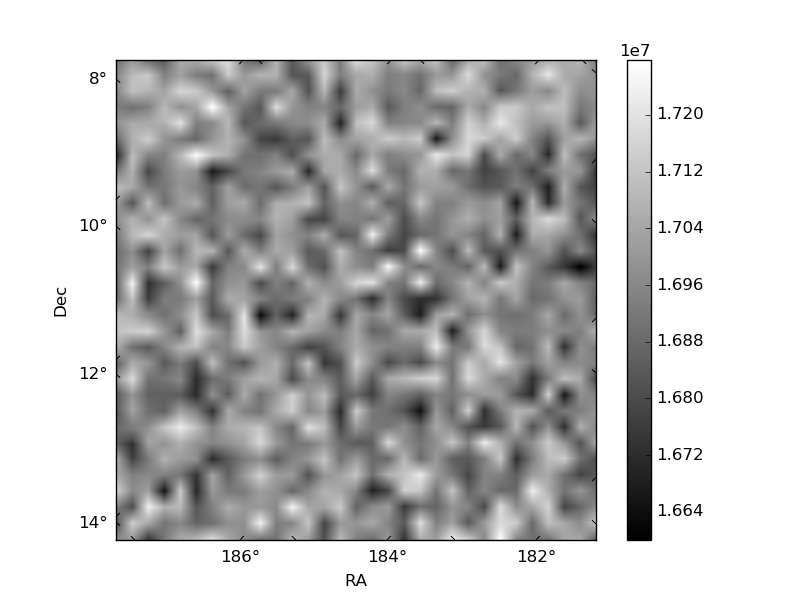
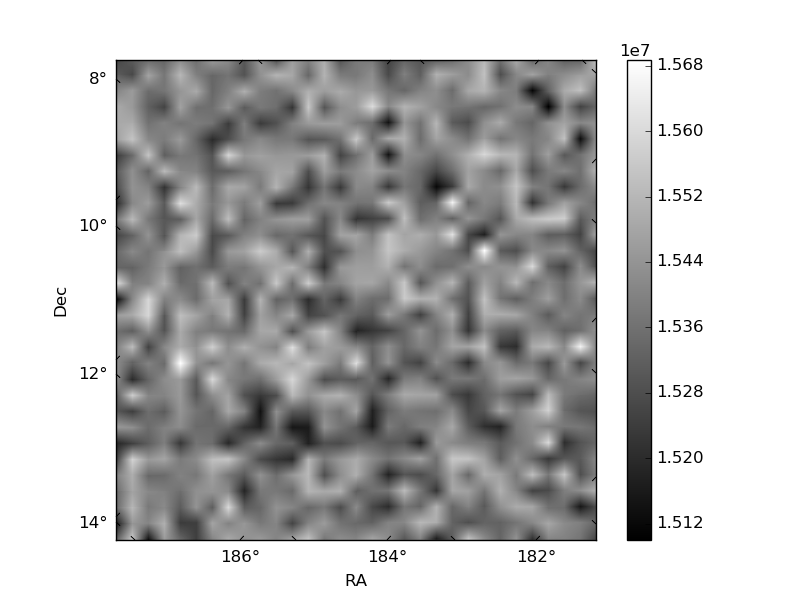
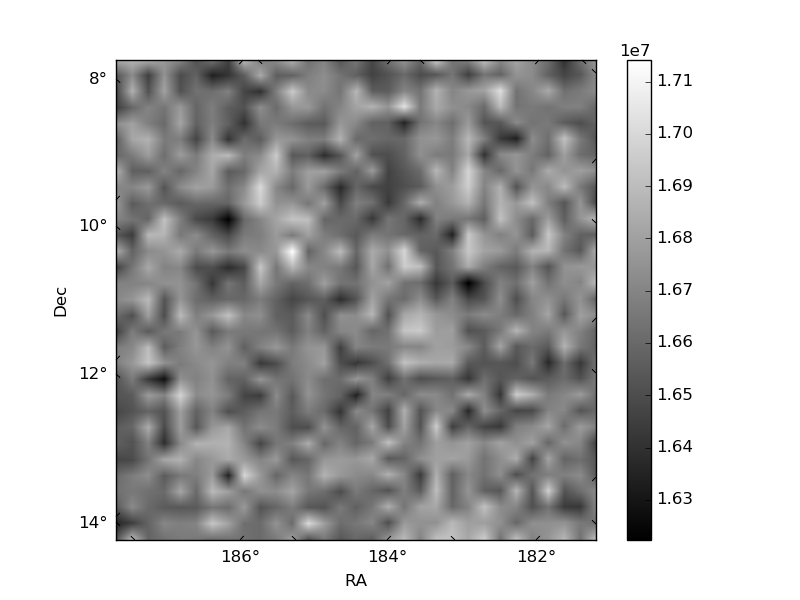
Histogram calculated using DETX and DETY for each event in the final _common_clean file
| Quadrant A | 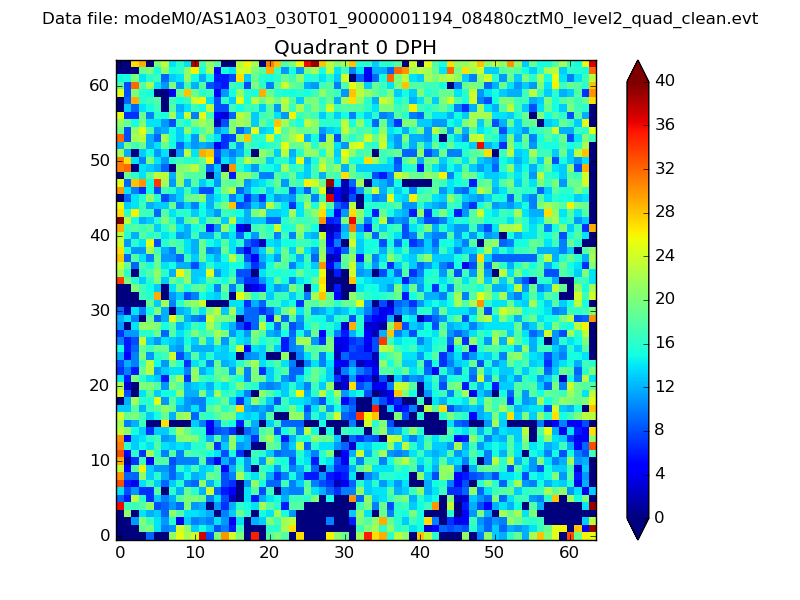 |
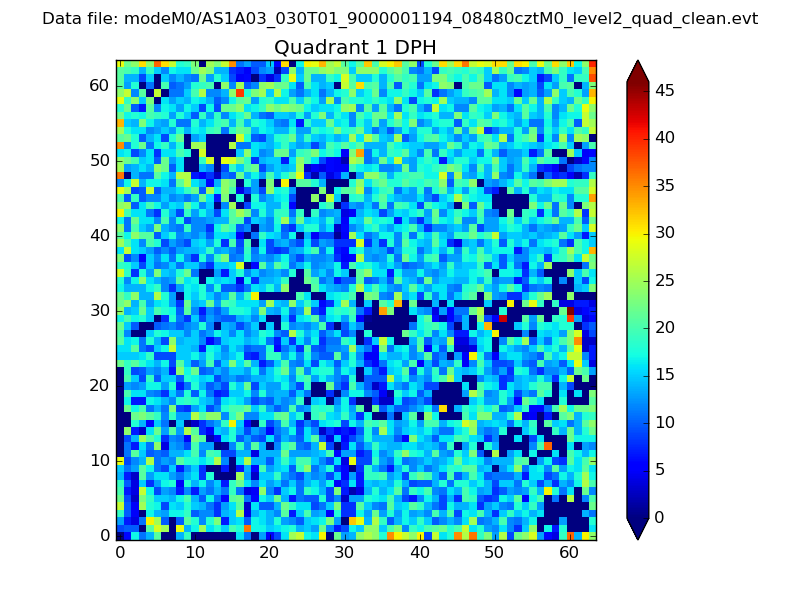 |
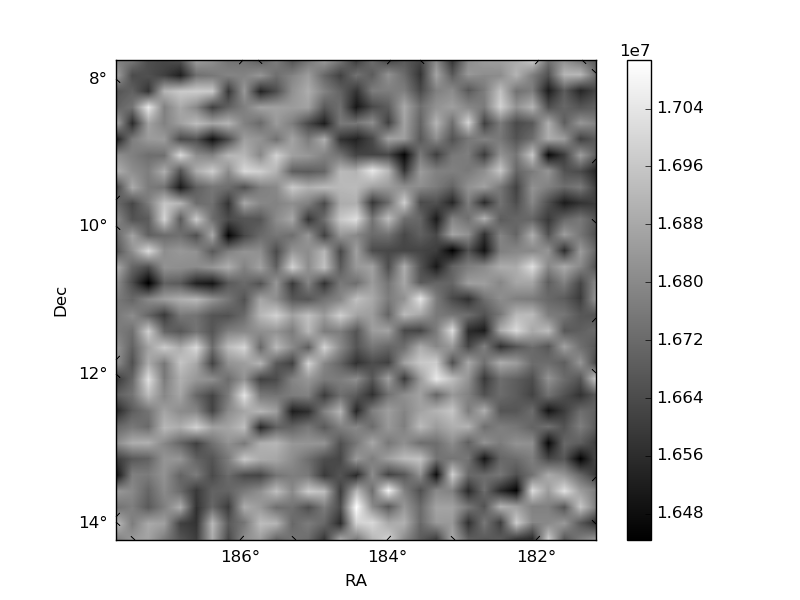
Quadrant B |
|---|---|---|---|
| Quadrant D | 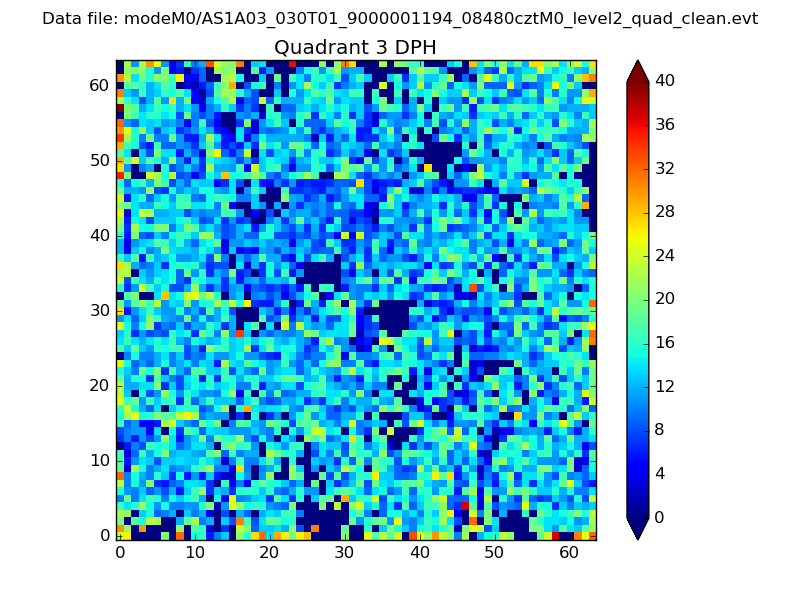 |
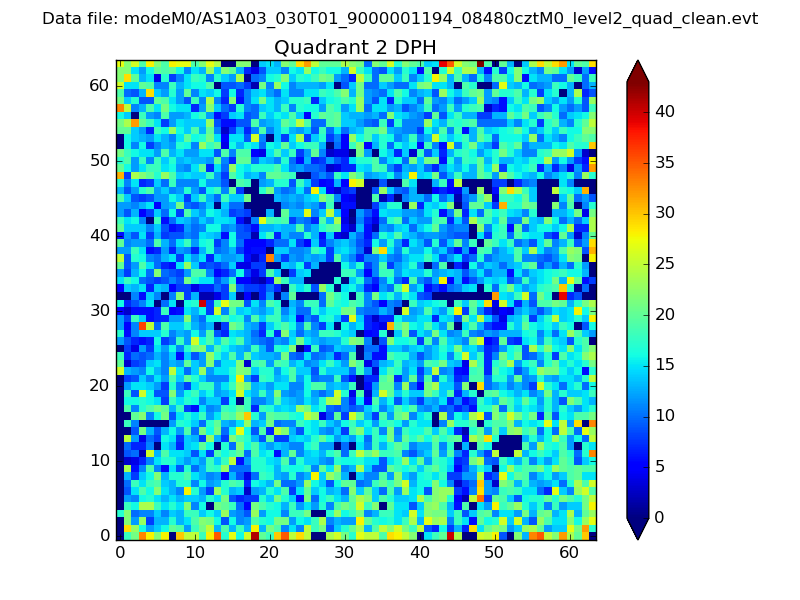 |
Quadrant C |
| Plot type | Count rate plots | Images |
|---|---|---|
| Comparison with Poisson distribution Blue bars denote a histogram of data divided into 1 sec bins. Red curve is a Poisson curve with rate = median count rate of data. |
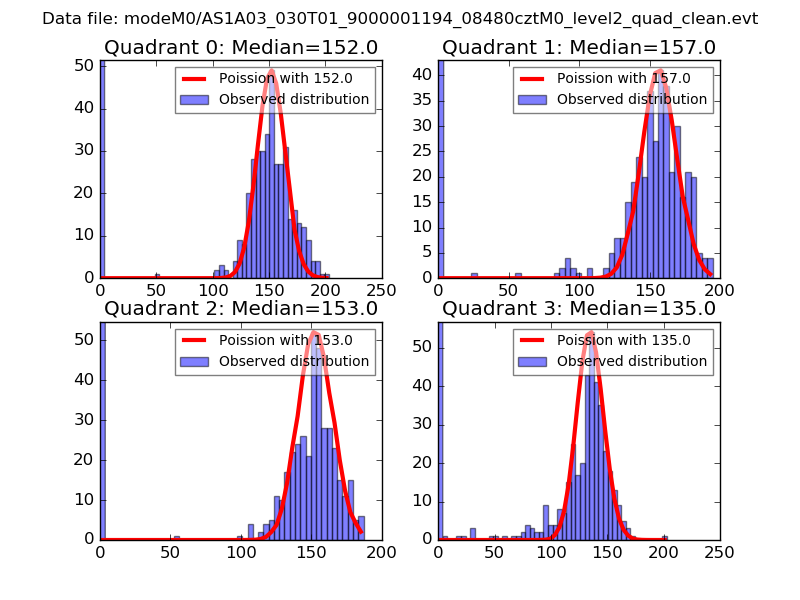 |
 |
| Quadrant-wise count rates Data is divided into 100 sec bins |
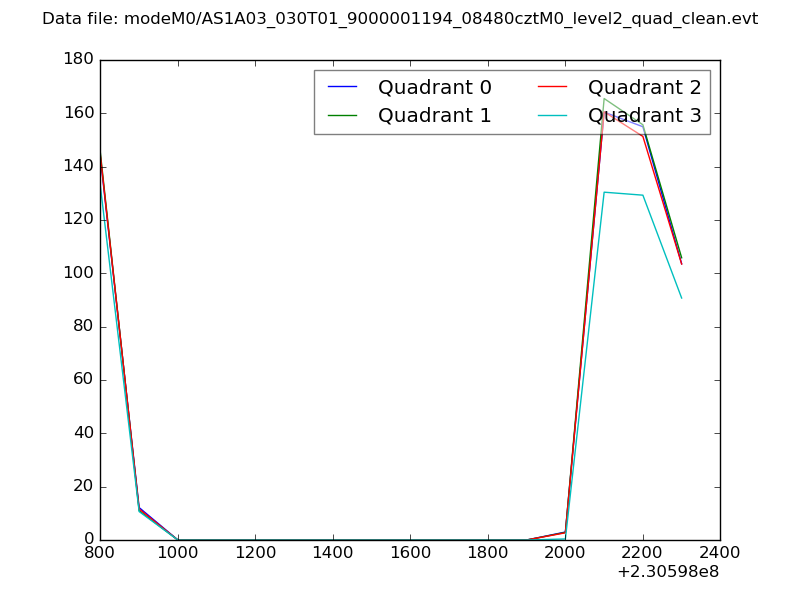 |
|
| Module-wise count rates for Quadrant A Data is divided into 100 sec bins |
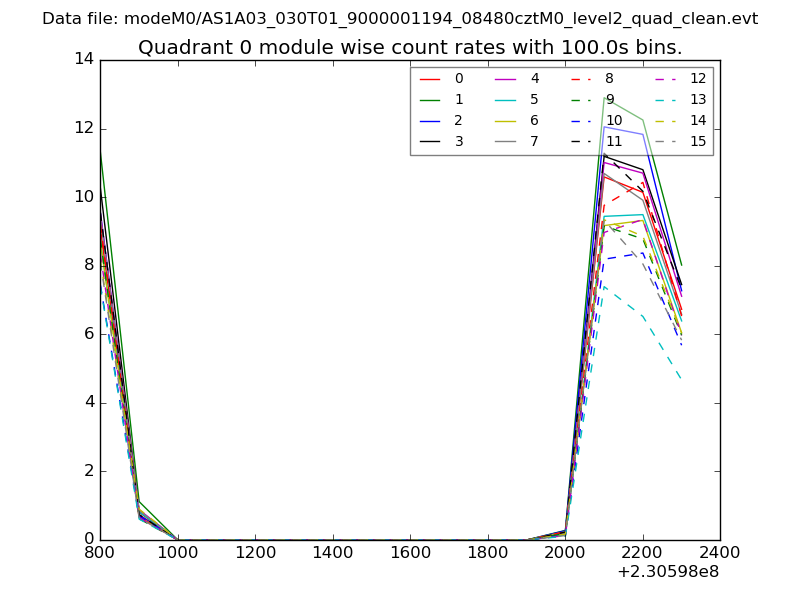 |
 |
| Module-wise count rates for Quadrant B Data is divided into 100 sec bins |
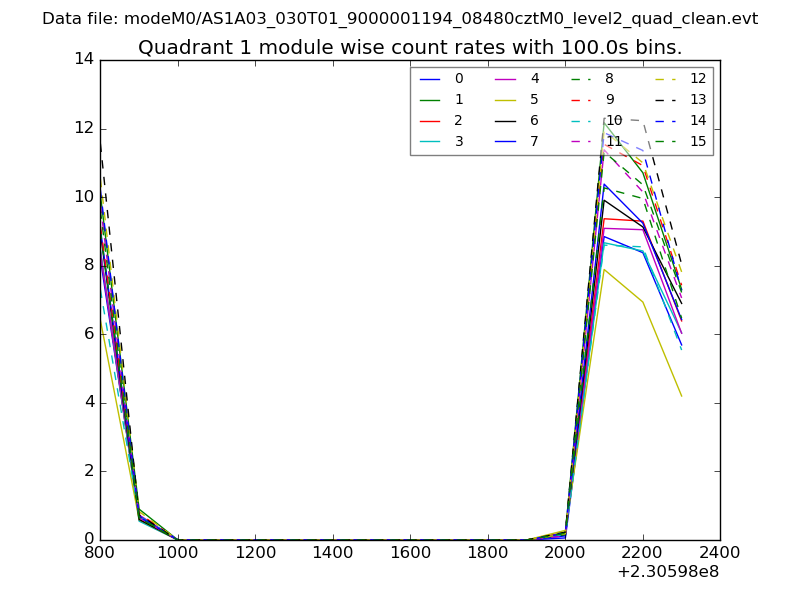 |
 |
| Module-wise count rates for Quadrant C Data is divided into 100 sec bins |
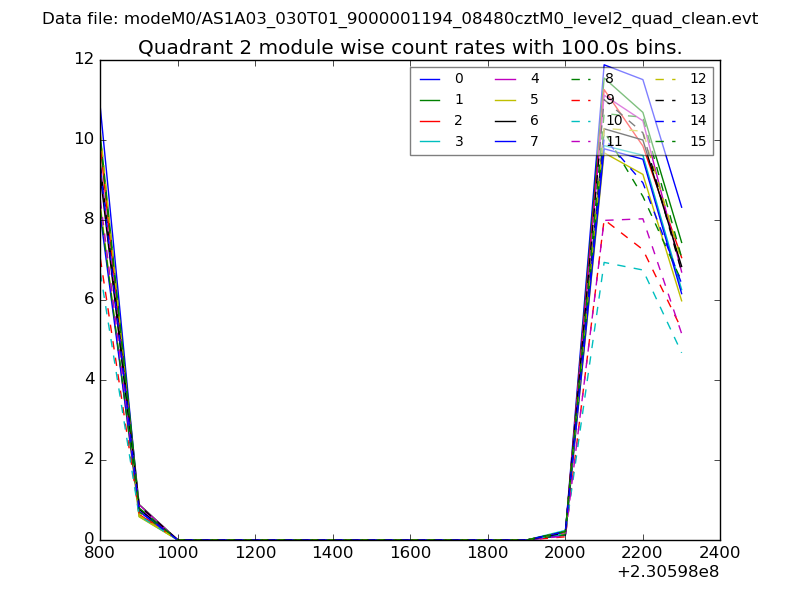 |
 |
| Module-wise count rates for Quadrant D Data is divided into 100 sec bins |
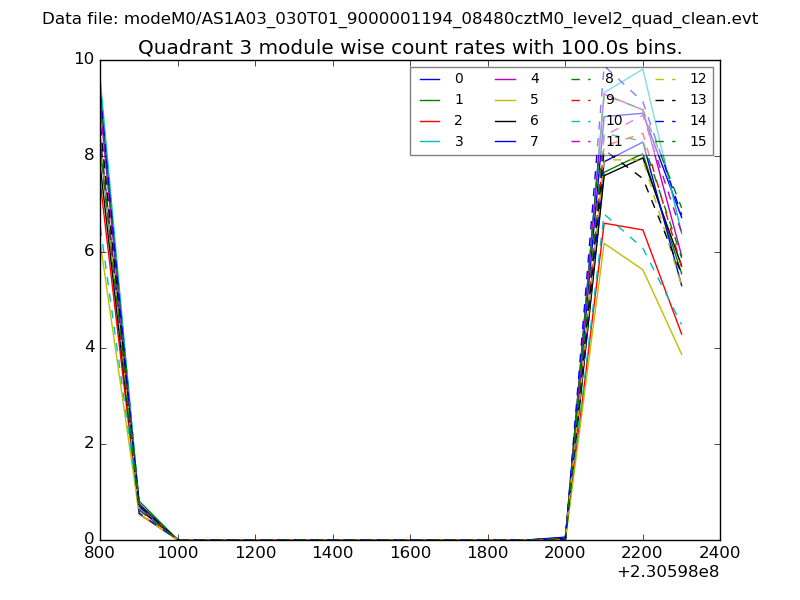 |
 |
| Parameter | Plot |
|---|---|
| CZT HV Monitor | 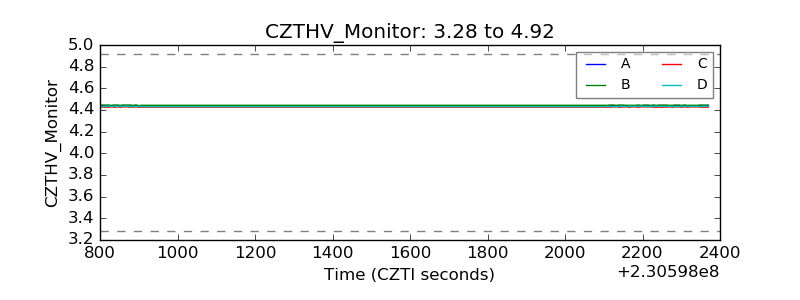 |
| D_VDD | 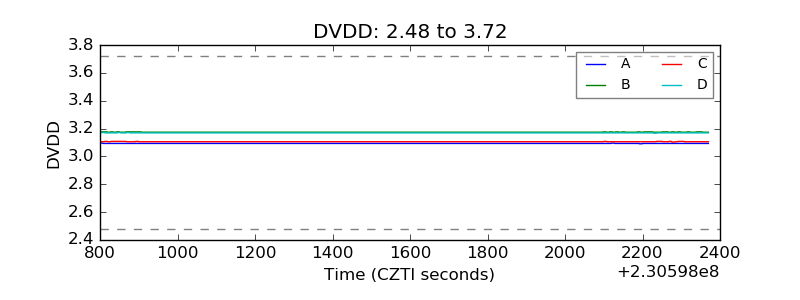 |
| Temperature 1 | 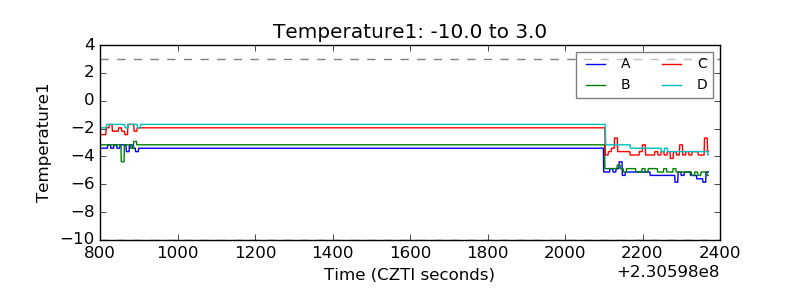 |
| Veto HV Monitor | 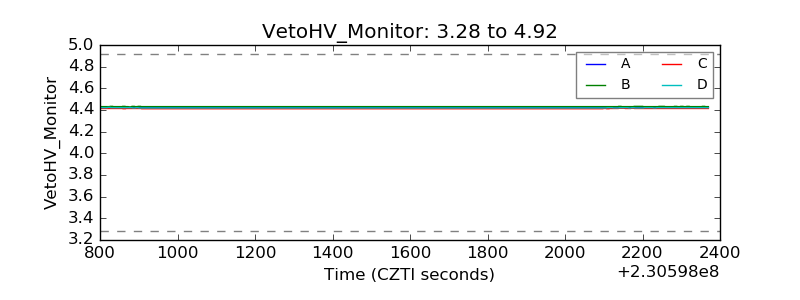 |
| Veto LLD | 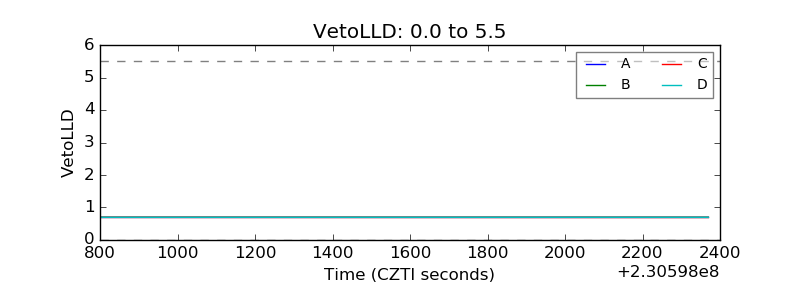 |
| Alpha Counter | 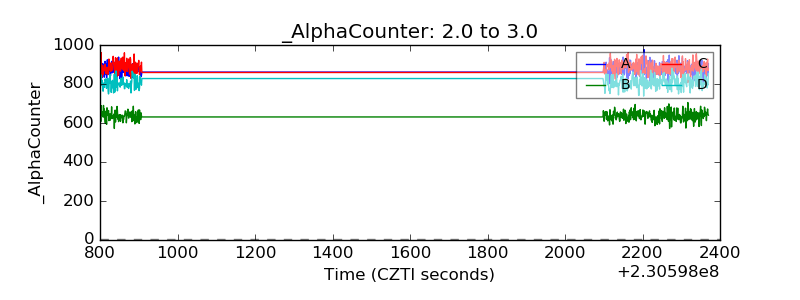 |
| _CPM_Rate | 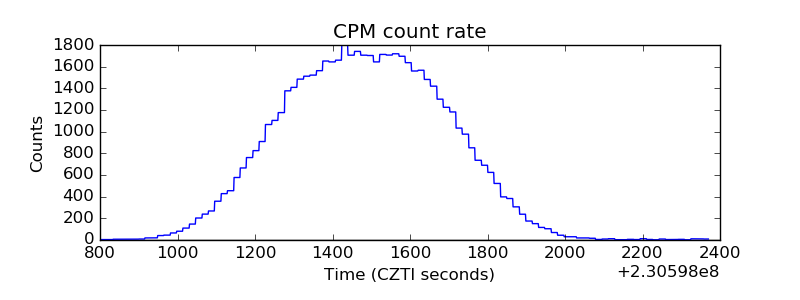 |
| CZT Counter | 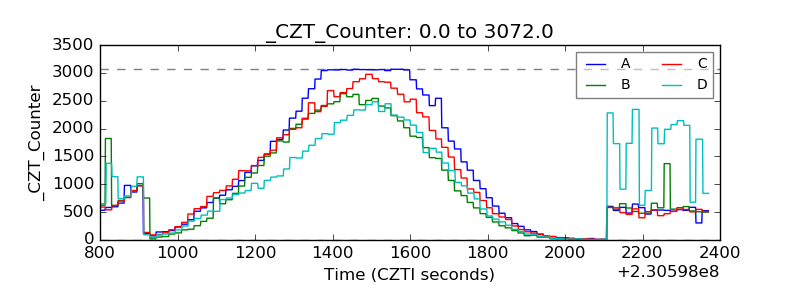 |
| +2.5 Volts monitor | 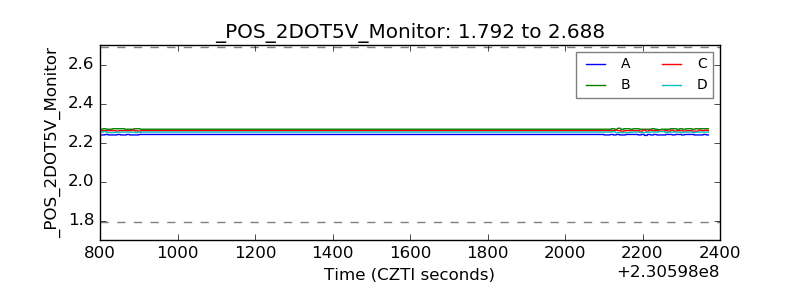 |
| +5 Volts monitor |  |
| _ROLL_ROT | 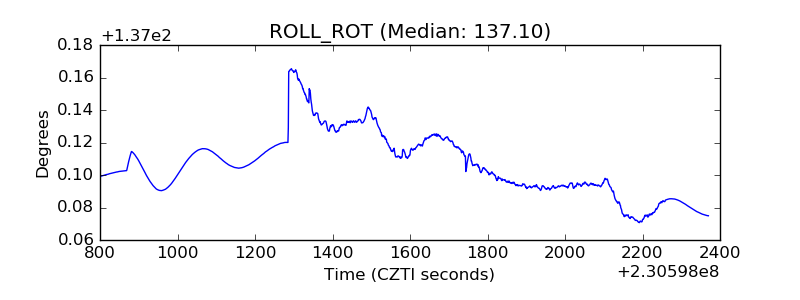 |
| _Roll_DEC | 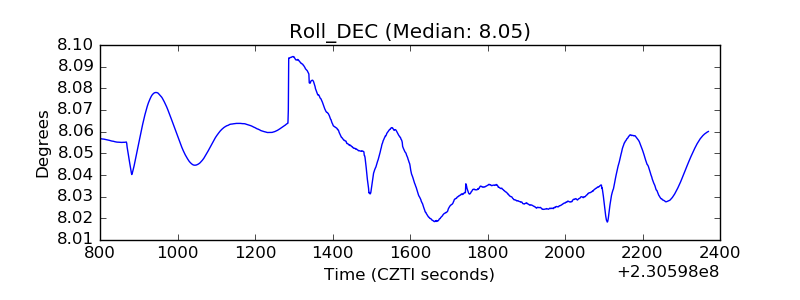 |
| _Roll_RA | 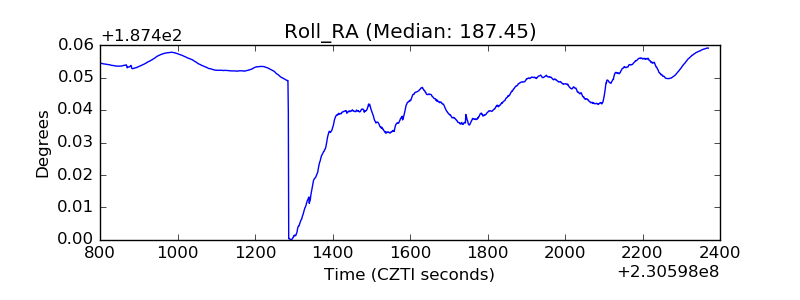 |
| Veto Counter | 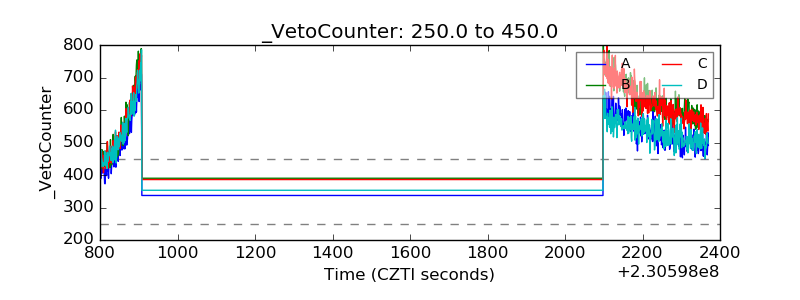 |