| Param | Original file | Final file |
|---|---|---|
| Filename | modeM0/AS1G07_007T01_9000001196cztM0_level2.fits | modeM0/AS1G07_007T01_9000001196cztM0_level2_quad_clean.evt |
| Size (bytes) | 480,219,840 | 453,320,640 |
| Size | 458.0 MB | 432.3 MB |
| Events in quadrant A | 2,854,518 | 2,621,104 |
| Events in quadrant B | 2,834,588 | 2,696,661 |
| Events in quadrant C | 2,870,220 | 2,568,510 |
| Events in quadrant D | 2,480,580 | 2,340,907 |
| Mode SS | |||
|---|---|---|---|
| Quadrant | BADHDUFLAG | Total packets | Discarded packets |
| A | 0 | 1038 | 0 |
| B | 0 | 1038 | 0 |
| C | 0 | 1038 | 0 |
| D | 0 | 1038 | 0 |
| Mode M9 | |||
|---|---|---|---|
| Quadrant | BADHDUFLAG | Total packets | Discarded packets |
| A | 0 | 66 | 0 |
| B | 0 | 66 | 0 |
| C | 0 | 66 | 0 |
| D | 0 | 66 | 0 |
| Mode M0 | |||
|---|---|---|---|
| Quadrant | BADHDUFLAG | Total packets | Discarded packets |
| A | 0 | 133830 | 0 |
| B | 0 | 112666 | 0 |
| C | 0 | 105293 | 0 |
| D | 0 | 121903 | 0 |
| Quadrant | Total seconds | Saturated seconds | Saturation percentage |
|---|---|---|---|
| A | 51022 | 3749 | 7.347811% |
| B | 51022 | 1293 | 2.534201% |
| C | 51022 | 602 | 1.179883% |
| D | 51021 | 1644 | 3.222203% |
Noise dominated data is calculated using 1-second bins in cleaned event files. If a bin has >2000 counts, and if more than 50% of those come from <1% of pixels, then it is considered to be noise-dominated and hence unusable.
| Quadrant | # 1 sec bins | Bins with >0 counts | Bins with >2000 counts | High rate bins dominated by noise | Noise dominated (total time) | Noise dominated (detector-on time) | Marked lightcurve |
|---|---|---|---|---|---|---|---|
| A | 57633 | 51012 | 0 | 0 | 0.00% | 0.00% |  |
| B | 57633 | 51010 | 0 | 0 | 0.00% | 0.00% |  |
| C | 57633 | 51021 | 0 | 0 | 0.00% | 0.00% |  |
| D | 57633 | 51015 | 0 | 0 | 0.00% | 0.00% |  |
Top three noisy pixels from each quadrant. If the there are fewer than three noisy pixels in the level2.evt file, extra rows are filled as -1
| Pixel properties | Quadrant properties | ||||||
|---|---|---|---|---|---|---|---|
| Quadrant | DetID | PixID | Counts | Sigma | Mean | Median | Sigma |
| A | 0 | 29 | 2728 | 10.84 | 743 | 692 | 187.9 |
| A | 7 | 110 | 2404 | 9.11 | 743 | 692 | 187.9 |
| A | 0 | 30 | 2142 | 7.72 | 743 | 692 | 187.9 |
| B | 2 | 9 | 2516 | 11.93 | 748 | 711 | 151.3 |
| B | 14 | 254 | 1900 | 7.86 | 748 | 711 | 151.3 |
| B | 12 | 226 | 1899 | 7.85 | 748 | 711 | 151.3 |
| C | 1 | 80 | 2136 | 7.23 | 757 | 700 | 198.7 |
| C | 12 | 241 | 2072 | 6.9 | 757 | 700 | 198.7 |
| C | 1 | 81 | 2035 | 6.72 | 757 | 700 | 198.7 |
| D | 3 | 14 | 1838 | 6.27 | 706 | 639 | 191.1 |
| D | 6 | 231 | 1831 | 6.24 | 706 | 639 | 191.1 |
| D | 1 | 3 | 1774 | 5.94 | 706 | 639 | 191.1 |
Histogram calculated using DETX and DETY for each event in the final _common_clean file
| Quadrant A |  |
 |
Quadrant B |
|---|---|---|---|
| Quadrant D |  |
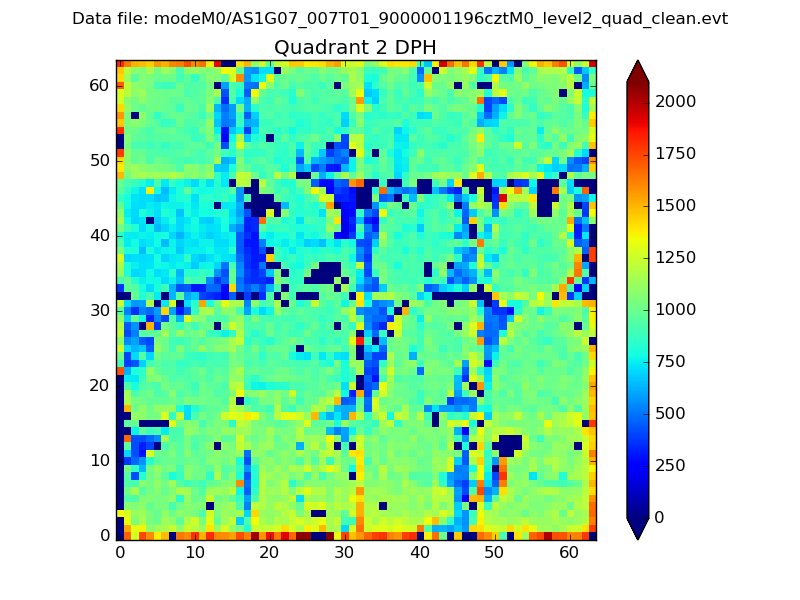 |
Quadrant C |
| Plot type | Count rate plots | Images |
|---|---|---|
| Comparison with Poisson distribution Blue bars denote a histogram of data divided into 1 sec bins. Red curve is a Poisson curve with rate = median count rate of data. |
 |
 |
| Quadrant-wise count rates Data is divided into 100 sec bins |
 |
|
| Module-wise count rates for Quadrant A Data is divided into 100 sec bins |
 |
 |
| Module-wise count rates for Quadrant B Data is divided into 100 sec bins |
 |
 |
| Module-wise count rates for Quadrant C Data is divided into 100 sec bins |
 |
 |
| Module-wise count rates for Quadrant D Data is divided into 100 sec bins |
 |
 |
| Parameter | Plot |
|---|---|
| CZT HV Monitor |  |
| D_VDD |  |
| Temperature 1 |  |
| Veto HV Monitor |  |
| Veto LLD |  |
| Alpha Counter |  |
| _CPM_Rate |  |
| CZT Counter |  |
| +2.5 Volts monitor |  |
| +5 Volts monitor |  |
| _ROLL_ROT |  |
| _Roll_DEC |  |
| _Roll_RA |  |
| Veto Counter |  |