| Param | Original file | Final file |
|---|---|---|
| Filename | modeM0/AS1G07_007T01_9000001196_08480cztM0_level2.evt | modeM0/AS1G07_007T01_9000001196_08480cztM0_level2_quad_clean.evt |
| Size (bytes) | 415,670,400 | 53,352,000 |
| Size | 396.4 MB | 50.9 MB |
| Events in quadrant A | 2,516,804 | 321,138 |
| Events in quadrant B | 2,663,250 | 324,078 |
| Events in quadrant C | 2,448,374 | 312,534 |
| Events in quadrant D | 4,600,421 | 286,642 |
| Mode SS | |||
|---|---|---|---|
| Quadrant | BADHDUFLAG | Total packets | Discarded packets |
| A | 0 | 108 | 0 |
| B | 0 | 108 | 0 |
| C | 0 | 108 | 0 |
| D | 0 | 108 | 0 |
| Mode M9 | |||
|---|---|---|---|
| Quadrant | BADHDUFLAG | Total packets | Discarded packets |
| A | 0 | 13 | 0 |
| B | 0 | 13 | 0 |
| C | 0 | 13 | 0 |
| D | 0 | 13 | 0 |
| Mode M0 | |||
|---|---|---|---|
| Quadrant | BADHDUFLAG | Total packets | Discarded packets |
| A | 0 | 10870 | 2 |
| B | 0 | 11283 | 1 |
| C | 0 | 10797 | 1 |
| D | 0 | 17255 | 1 |
| Quadrant | Total seconds | Saturated seconds | Saturation percentage |
|---|---|---|---|
| A | 5291 | 23 | 0.434700% |
| B | 5291 | 28 | 0.529201% |
| C | 5291 | 16 | 0.302400% |
| D | 5291 | 390 | 7.371007% |
Noise dominated data is calculated using 1-second bins in cleaned event files. If a bin has >2000 counts, and if more than 50% of those come from <1% of pixels, then it is considered to be noise-dominated and hence unusable.
| Quadrant | # 1 sec bins | Bins with >0 counts | Bins with >2000 counts | High rate bins dominated by noise | Noise dominated (total time) | Noise dominated (detector-on time) | Marked lightcurve |
|---|---|---|---|---|---|---|---|
| A | 6546 | 5292 | 0 | 0 | 0.00% | 0.00% | 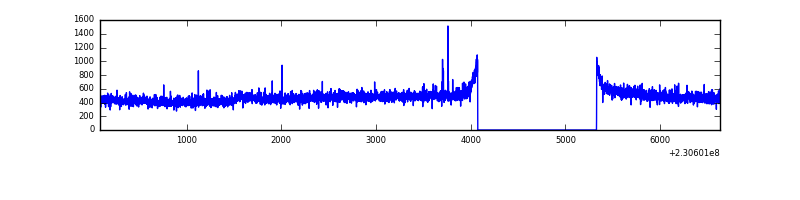 |
| B | 6546 | 5292 | 1 | 1 | 0.02% | 0.02% | 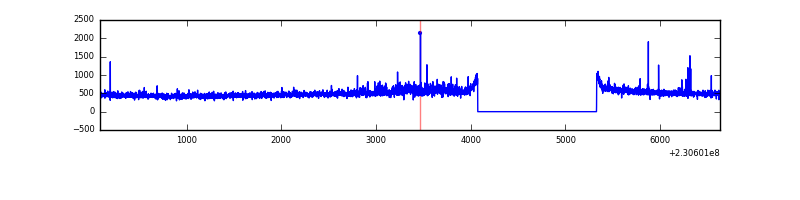 |
| C | 6546 | 5292 | 0 | 0 | 0.00% | 0.00% | 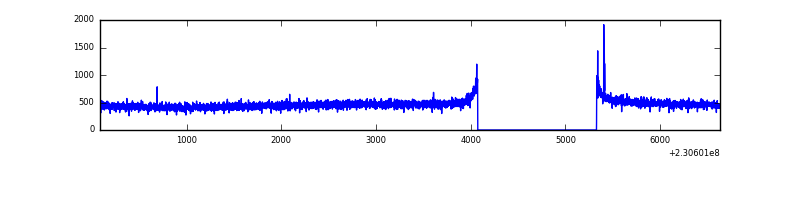 |
| D | 6546 | 5292 | 274 | 274 | 4.19% | 5.18% | 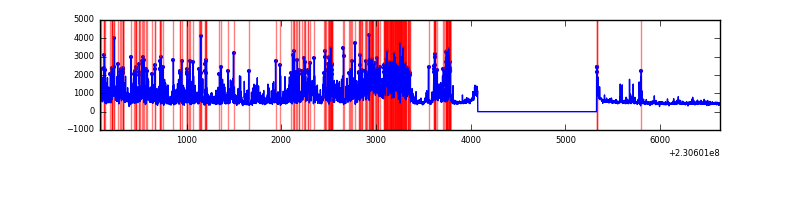 |
Top three noisy pixels from each quadrant. If the there are fewer than three noisy pixels in the level2.evt file, extra rows are filled as -1
| Pixel properties | Quadrant properties | ||||||
|---|---|---|---|---|---|---|---|
| Quadrant | DetID | PixID | Counts | Sigma | Mean | Median | Sigma |
| A | 13 | 210 | 10701 | 75.55 | 649 | 634 | 133.3 |
| A | 4 | 2 | 7256 | 49.7 | 649 | 634 | 133.3 |
| A | 0 | 226 | 6135 | 41.28 | 649 | 634 | 133.3 |
| B | 11 | 51 | 45850 | 364.82 | 653 | 638 | 123.9 |
| B | 0 | 214 | 29447 | 232.46 | 653 | 638 | 123.9 |
| B | 4 | 81 | 14171 | 109.2 | 653 | 638 | 123.9 |
| C | 9 | 54 | 8683 | 55.3 | 624 | 629 | 145.6 |
| C | 13 | 61 | 4851 | 28.99 | 624 | 629 | 145.6 |
| C | 8 | 222 | 2818 | 15.03 | 624 | 629 | 145.6 |
| D | 1 | 52 | 1979143 | 13215.78 | 605 | 589 | 149.7 |
| D | 12 | 221 | 154519 | 1028.18 | 605 | 589 | 149.7 |
| D | 2 | 14 | 97883 | 649.88 | 605 | 589 | 149.7 |
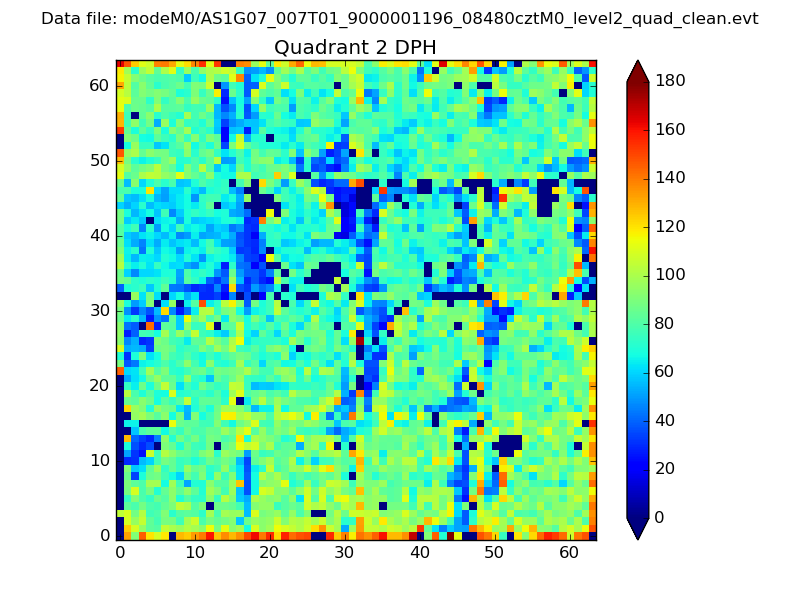
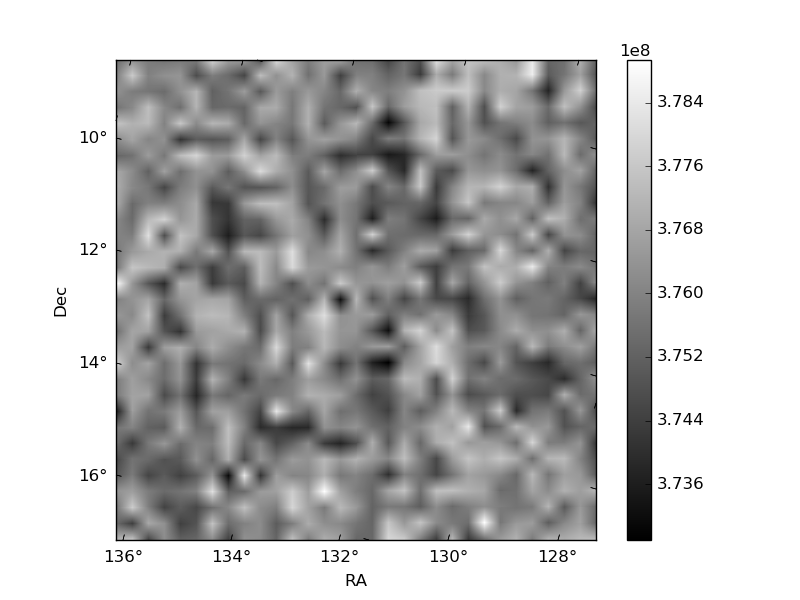
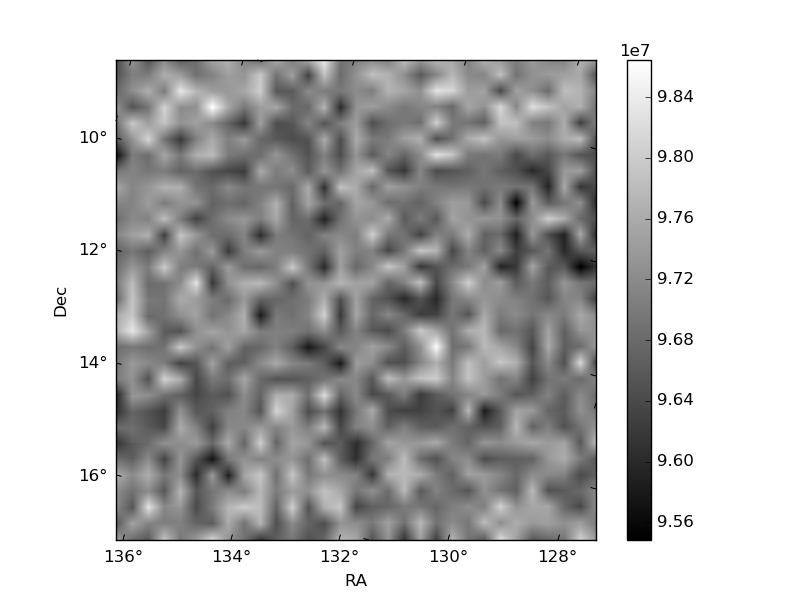
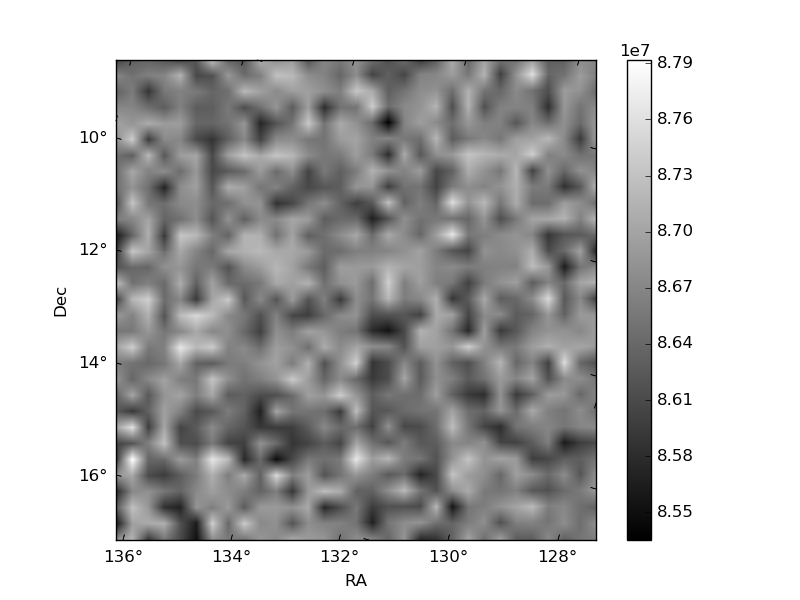
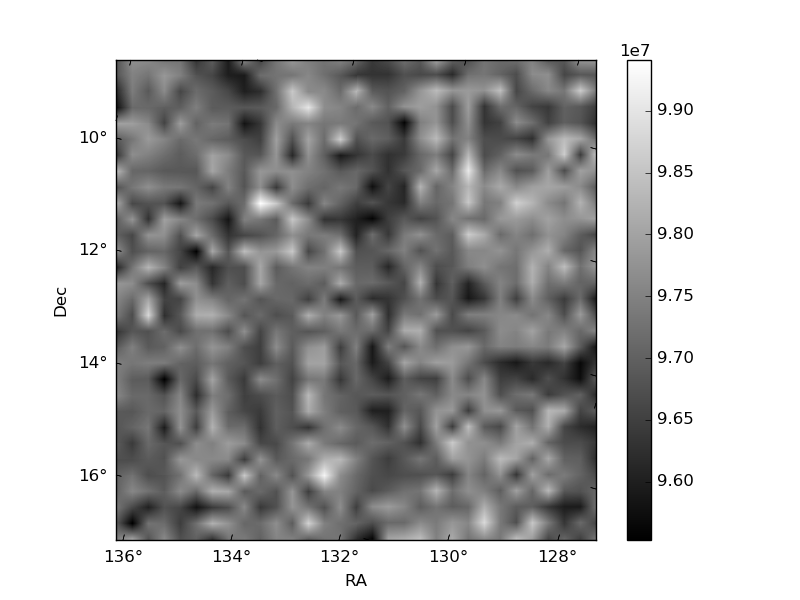
Histogram calculated using DETX and DETY for each event in the final _common_clean file
| Quadrant A | 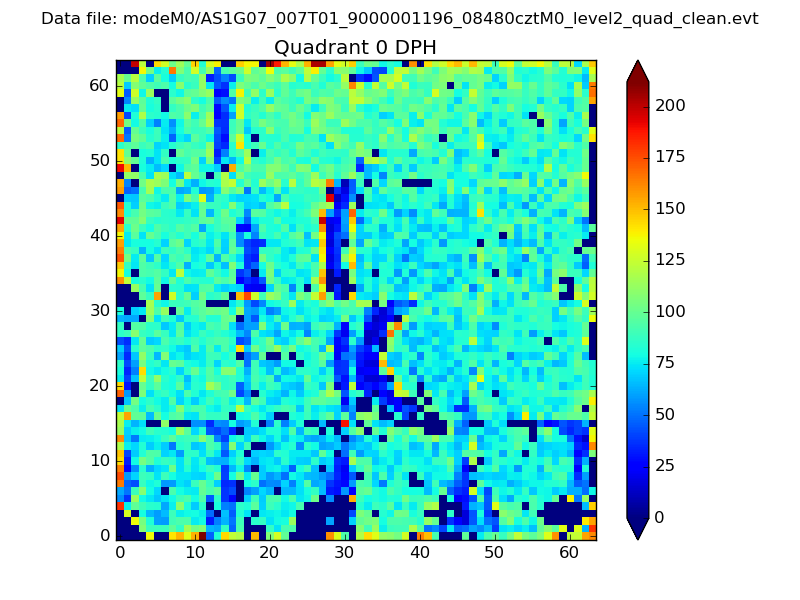 |
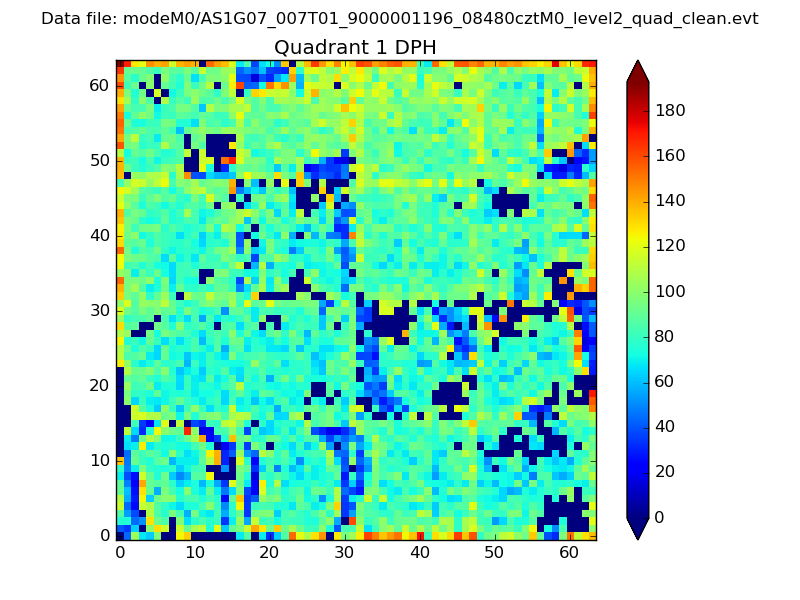 |
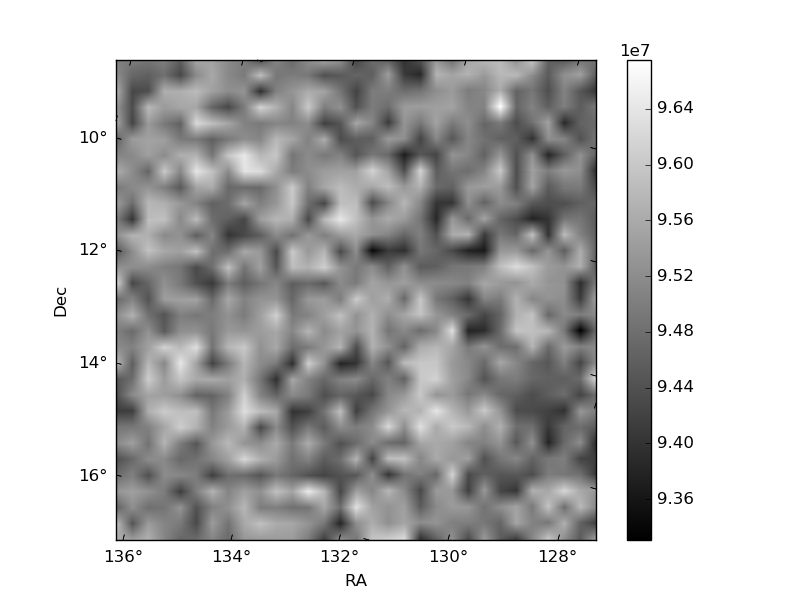
Quadrant B |
|---|---|---|---|
| Quadrant D | 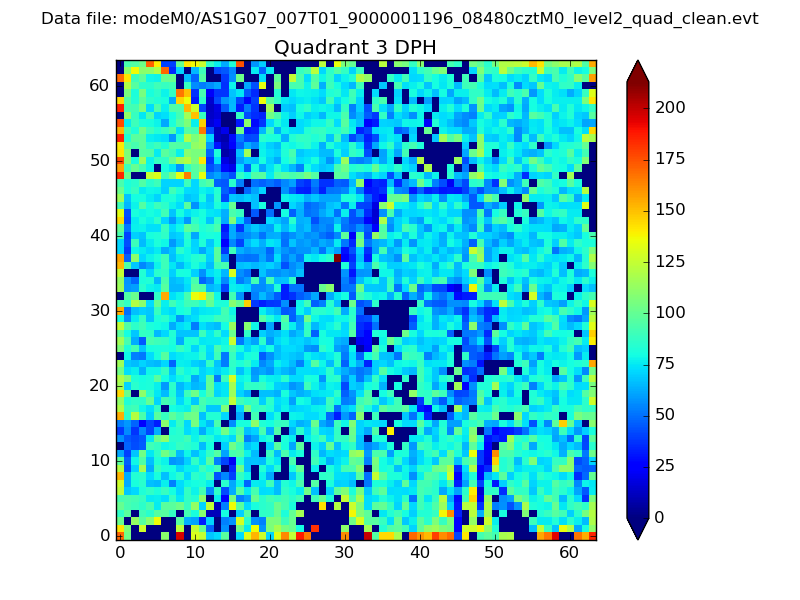 |
 |
Quadrant C |
| Plot type | Count rate plots | Images |
|---|---|---|
| Comparison with Poisson distribution Blue bars denote a histogram of data divided into 1 sec bins. Red curve is a Poisson curve with rate = median count rate of data. |
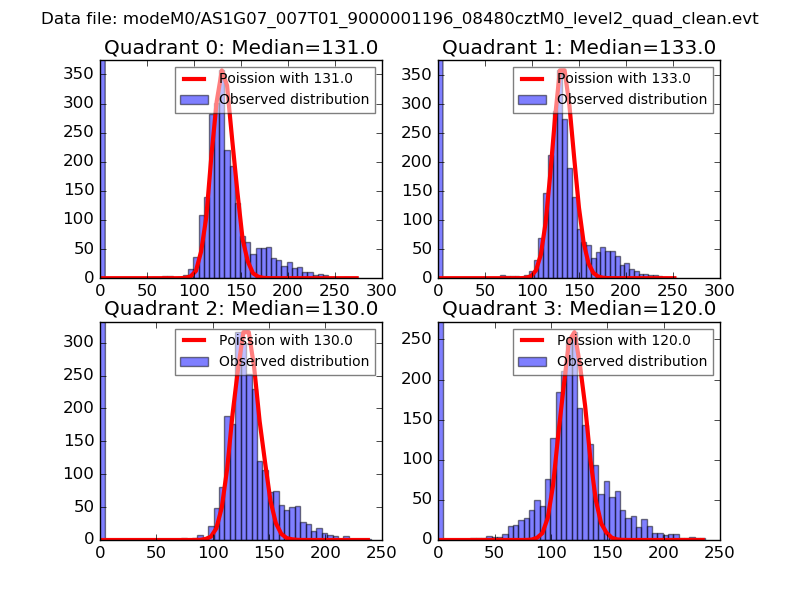 |
 |
| Quadrant-wise count rates Data is divided into 100 sec bins |
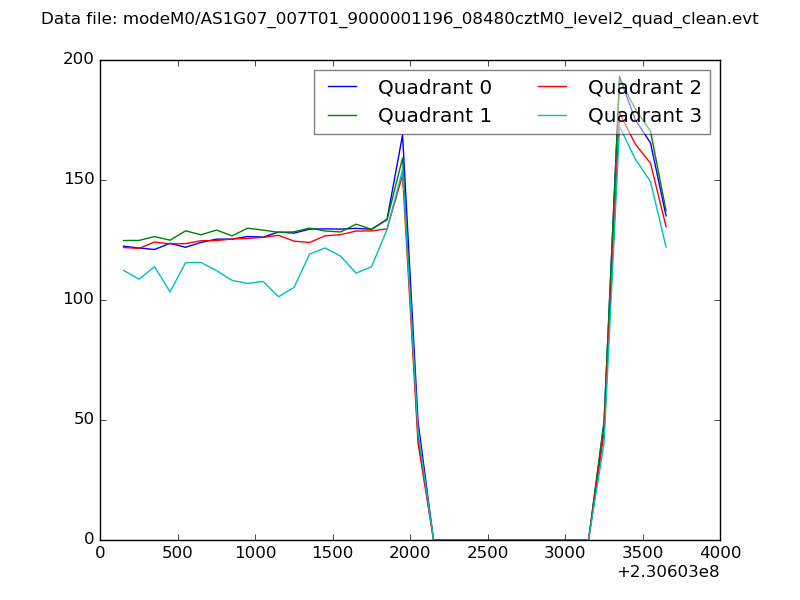 |
|
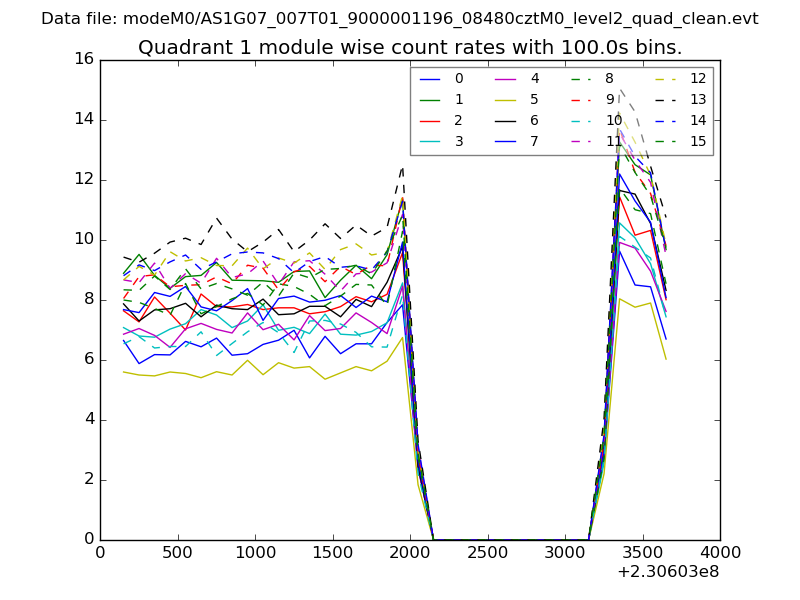
| Module-wise count rates for Quadrant A Data is divided into 100 sec bins |
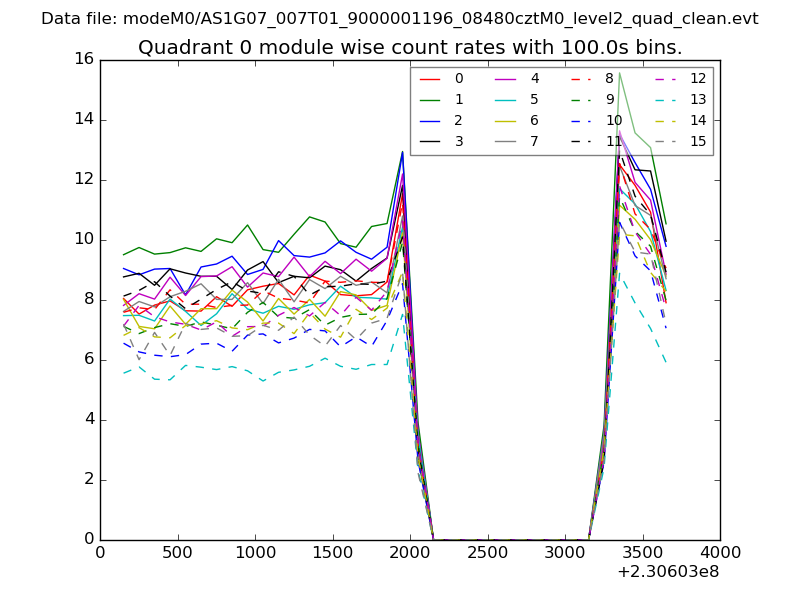 |
 |
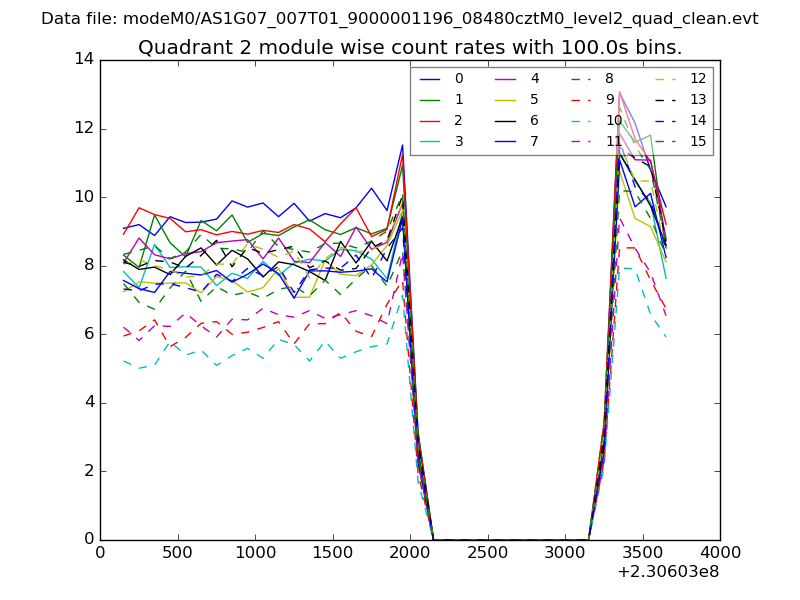
| Module-wise count rates for Quadrant B Data is divided into 100 sec bins |
 |
 |
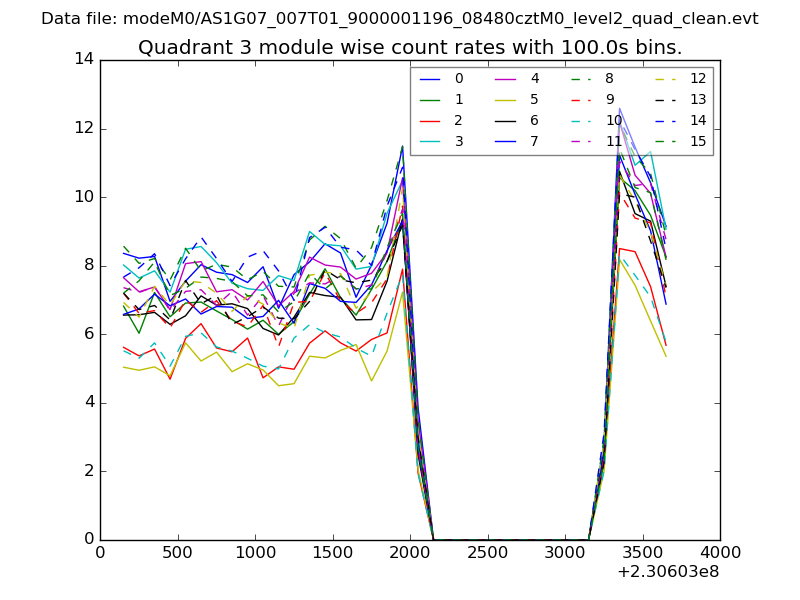
| Module-wise count rates for Quadrant C Data is divided into 100 sec bins |
 |
 |
| Module-wise count rates for Quadrant D Data is divided into 100 sec bins |
 |
 |
| Parameter | Plot |
|---|---|
| CZT HV Monitor | 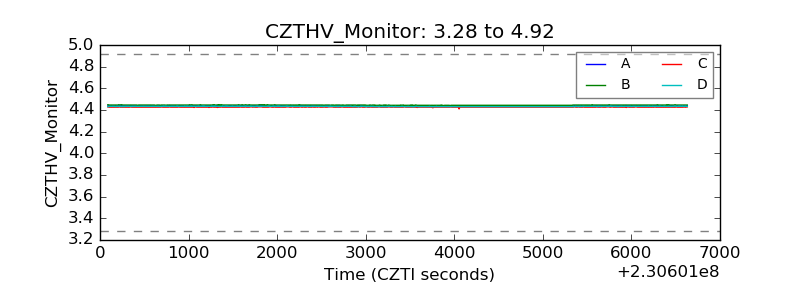 |
| D_VDD | 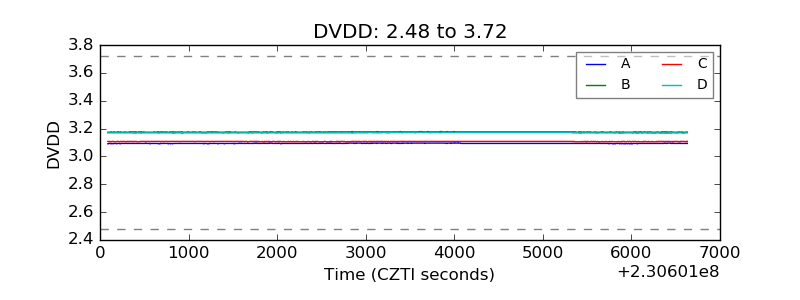 |
| Temperature 1 | 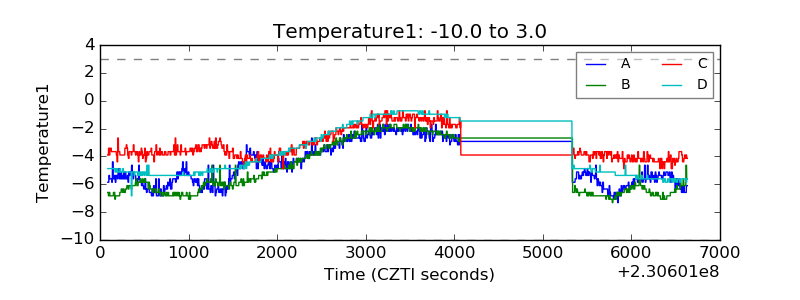 |
| Veto HV Monitor | 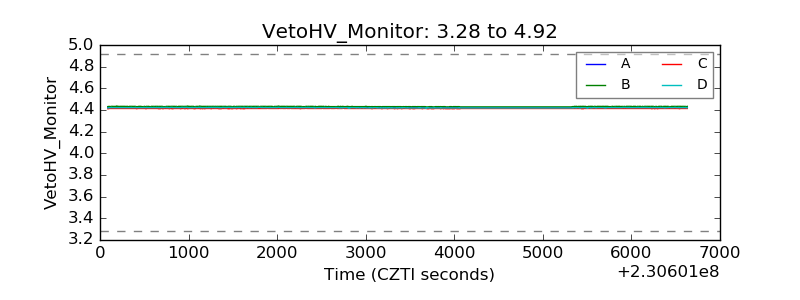 |
| Veto LLD | 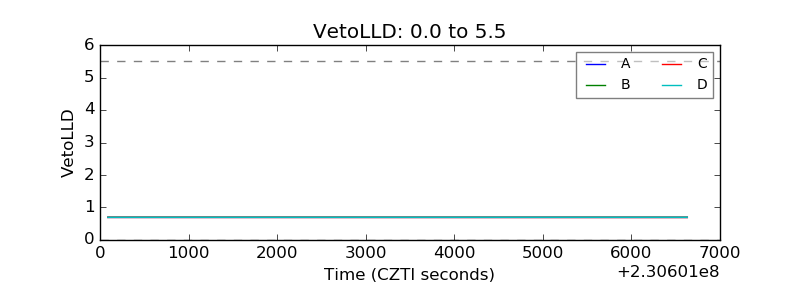 |
| Alpha Counter | 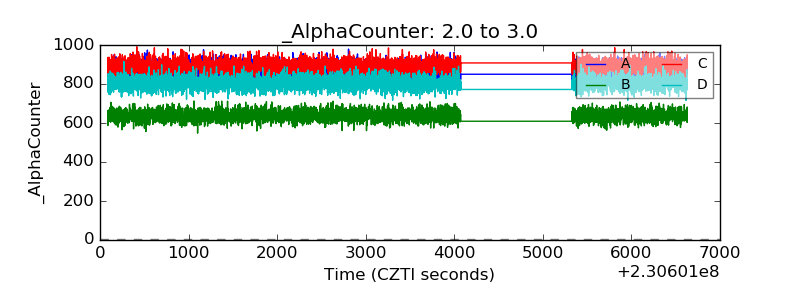 |
| _CPM_Rate | 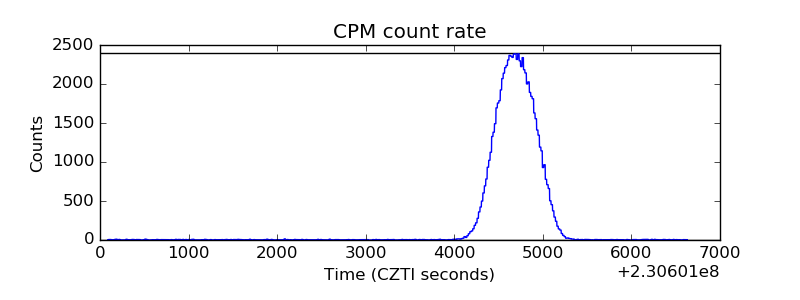 |
| CZT Counter | 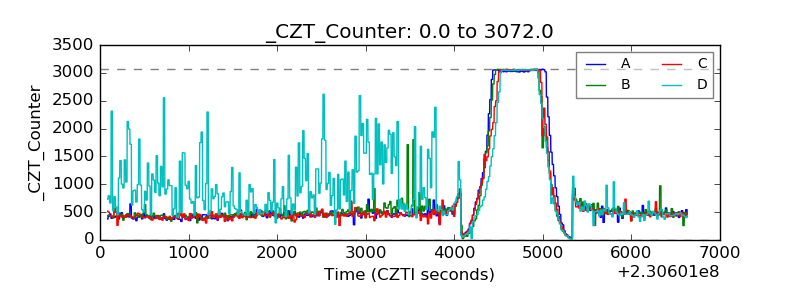 |
| +2.5 Volts monitor |  |
| +5 Volts monitor |  |
| _ROLL_ROT | 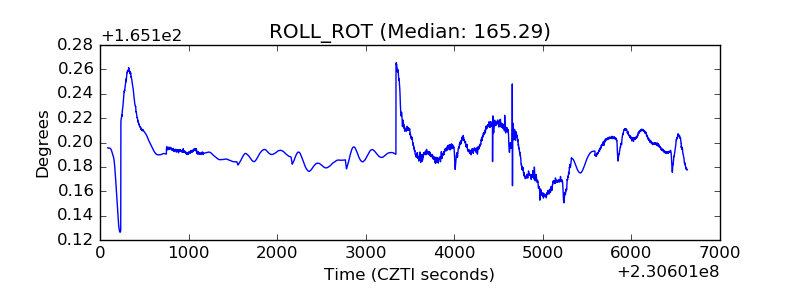 |
| _Roll_DEC | 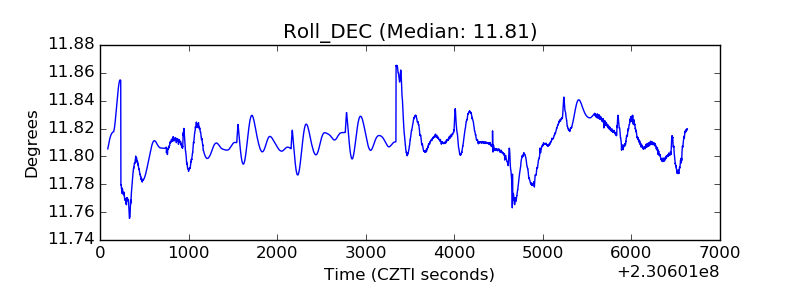 |
| _Roll_RA | 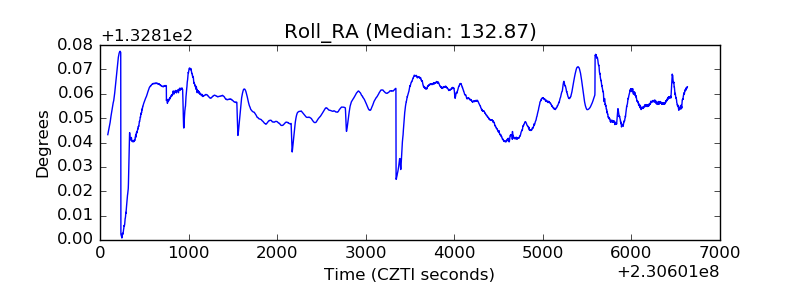 |
| Veto Counter | 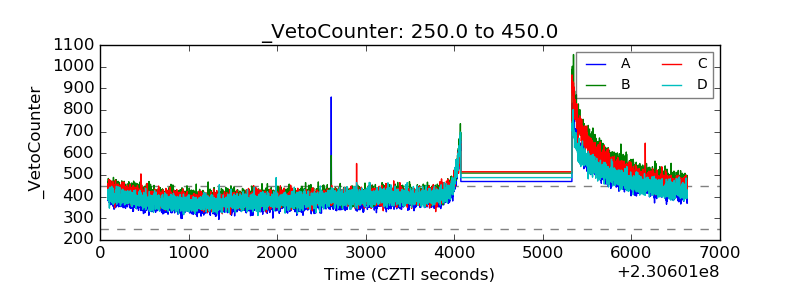 |