| Param | Original file | Final file |
|---|---|---|
| Filename | modeM0/AS1G07_007T01_9000001196_08481cztM0_level2.evt | modeM0/AS1G07_007T01_9000001196_08481cztM0_level2_quad_clean.evt |
| Size (bytes) | 479,157,120 | 62,928,000 |
| Size | 457.0 MB | 60.0 MB |
| Events in quadrant A | 3,262,114 | 372,523 |
| Events in quadrant B | 3,460,021 | 376,949 |
| Events in quadrant C | 3,113,751 | 362,797 |
| Events in quadrant D | 4,237,442 | 342,837 |
| Mode SS | |||
|---|---|---|---|
| Quadrant | BADHDUFLAG | Total packets | Discarded packets |
| A | 0 | 130 | 0 |
| B | 0 | 130 | 0 |
| C | 0 | 130 | 0 |
| D | 0 | 130 | 0 |
| Mode M9 | |||
|---|---|---|---|
| Quadrant | BADHDUFLAG | Total packets | Discarded packets |
| A | 0 | 17 | 0 |
| B | 0 | 17 | 0 |
| C | 0 | 17 | 0 |
| D | 0 | 18 | 0 |
| Mode M0 | |||
|---|---|---|---|
| Quadrant | BADHDUFLAG | Total packets | Discarded packets |
| A | 0 | 13547 | 3 |
| B | 0 | 14131 | 2 |
| C | 0 | 13309 | 2 |
| D | 0 | 16853 | 2 |
| Quadrant | Total seconds | Saturated seconds | Saturation percentage |
|---|---|---|---|
| A | 6454 | 35 | 0.542299% |
| B | 6454 | 48 | 0.743725% |
| C | 6454 | 16 | 0.247908% |
| D | 6454 | 143 | 2.215680% |
Noise dominated data is calculated using 1-second bins in cleaned event files. If a bin has >2000 counts, and if more than 50% of those come from <1% of pixels, then it is considered to be noise-dominated and hence unusable.
| Quadrant | # 1 sec bins | Bins with >0 counts | Bins with >2000 counts | High rate bins dominated by noise | Noise dominated (total time) | Noise dominated (detector-on time) | Marked lightcurve |
|---|---|---|---|---|---|---|---|
| A | 7764 | 6455 | 3 | 3 | 0.04% | 0.05% | 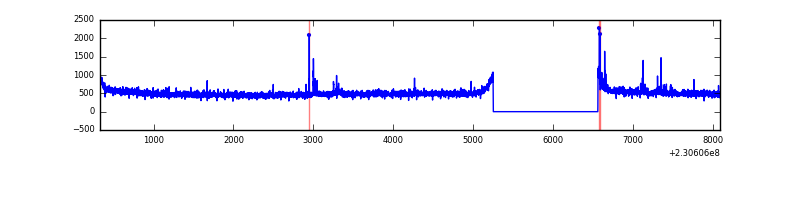 |
| B | 7764 | 6454 | 1 | 1 | 0.01% | 0.02% | 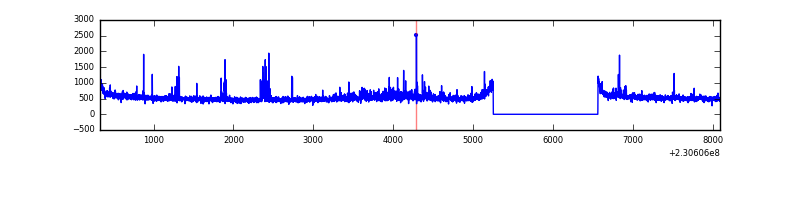 |
| C | 7764 | 6455 | 0 | 0 | 0.00% | 0.00% | 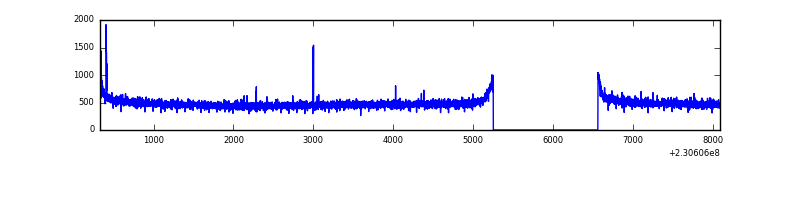 |
| D | 7764 | 6455 | 116 | 116 | 1.49% | 1.80% | 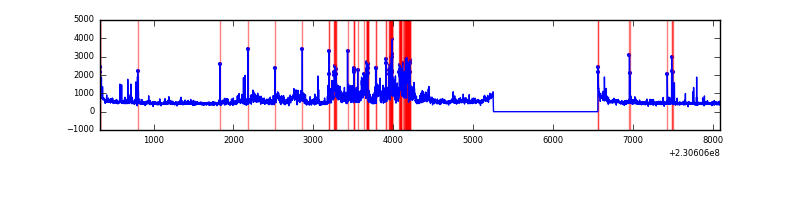 |
Top three noisy pixels from each quadrant. If the there are fewer than three noisy pixels in the level2.evt file, extra rows are filled as -1
| Pixel properties | Quadrant properties | ||||||
|---|---|---|---|---|---|---|---|
| Quadrant | DetID | PixID | Counts | Sigma | Mean | Median | Sigma |
| A | 5 | 16 | 34268 | 199.98 | 828 | 812 | 167.3 |
| A | 4 | 2 | 21794 | 125.42 | 828 | 812 | 167.3 |
| A | 15 | 236 | 19122 | 109.45 | 828 | 812 | 167.3 |
| B | 11 | 51 | 52893 | 330.04 | 837 | 821 | 157.8 |
| B | 0 | 214 | 51923 | 323.89 | 837 | 821 | 157.8 |
| B | 10 | 252 | 47380 | 295.1 | 837 | 821 | 157.8 |
| C | 9 | 54 | 8695 | 42.95 | 794 | 798 | 183.9 |
| C | 13 | 61 | 6132 | 29.01 | 794 | 798 | 183.9 |
| C | 14 | 234 | 4813 | 21.84 | 794 | 798 | 183.9 |
| D | 12 | 221 | 825685 | 4224.94 | 781 | 761 | 195.3 |
| D | 1 | 52 | 315893 | 1613.98 | 781 | 761 | 195.3 |
| D | 7 | 71 | 46547 | 234.5 | 781 | 761 | 195.3 |
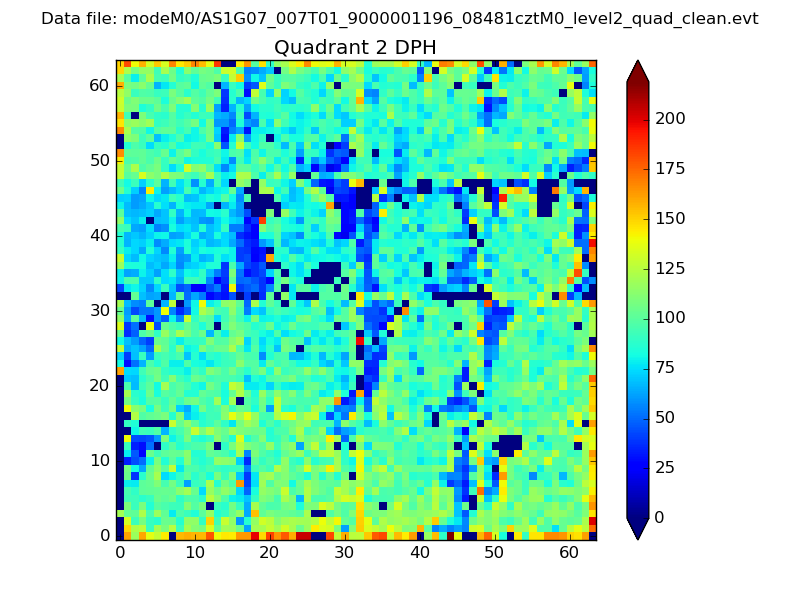
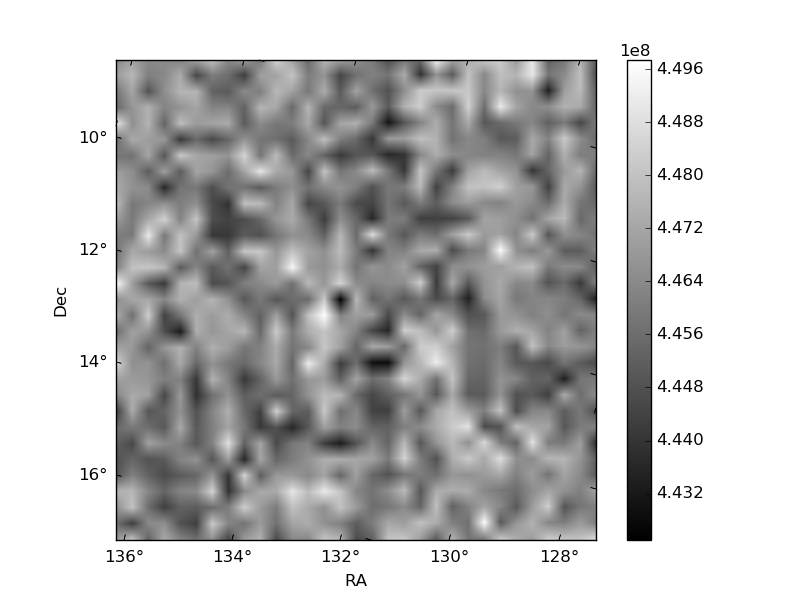
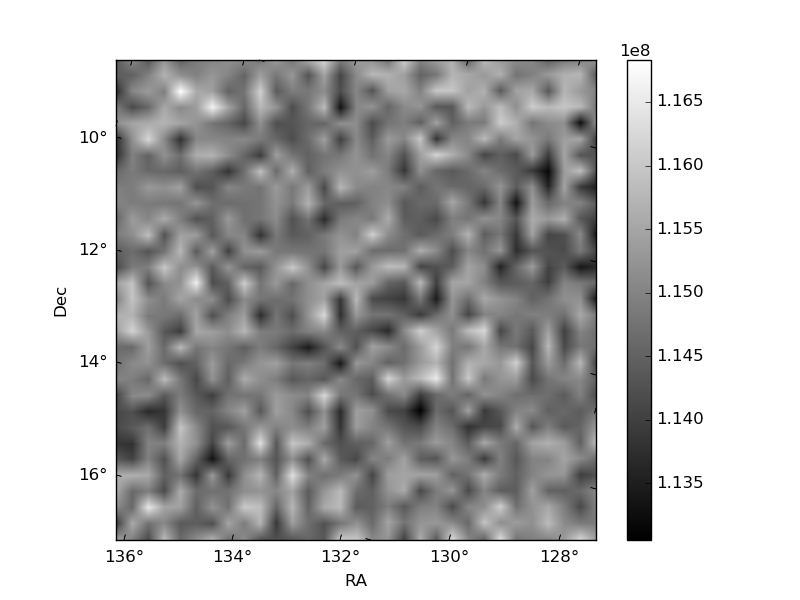
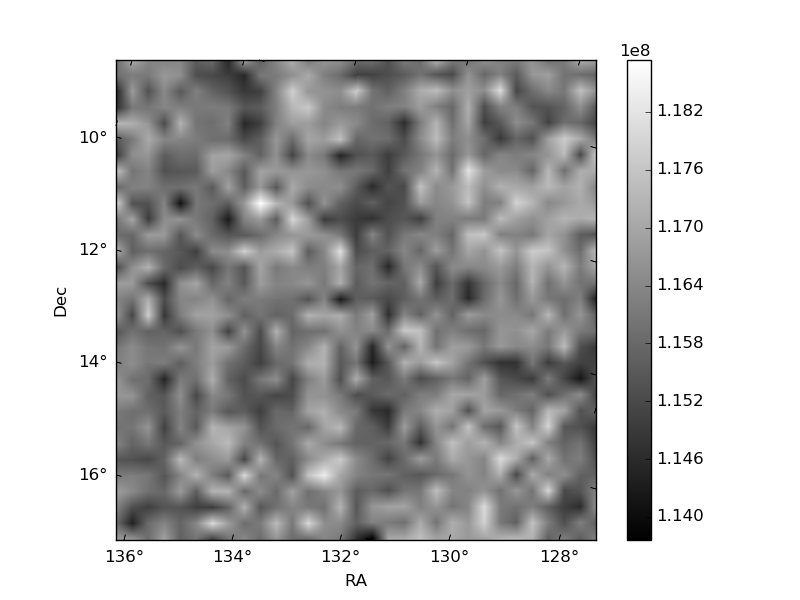
Histogram calculated using DETX and DETY for each event in the final _common_clean file
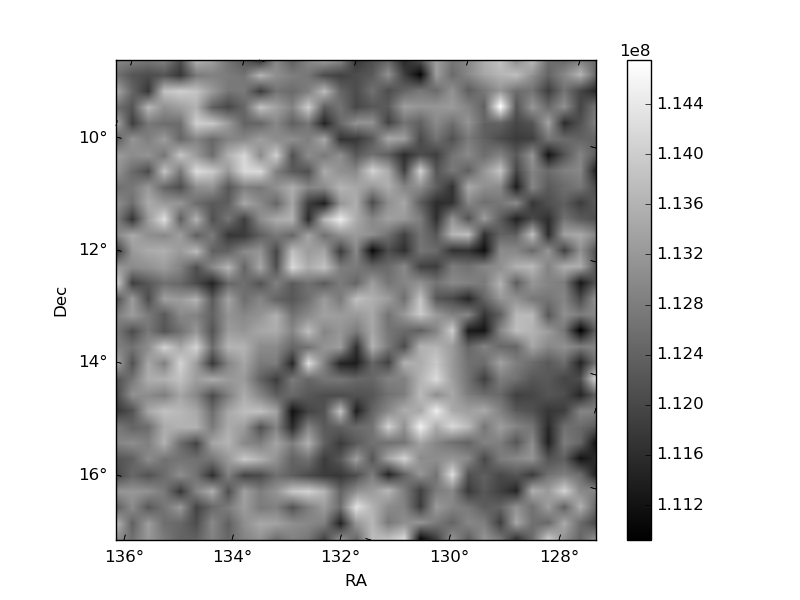
| Quadrant A | 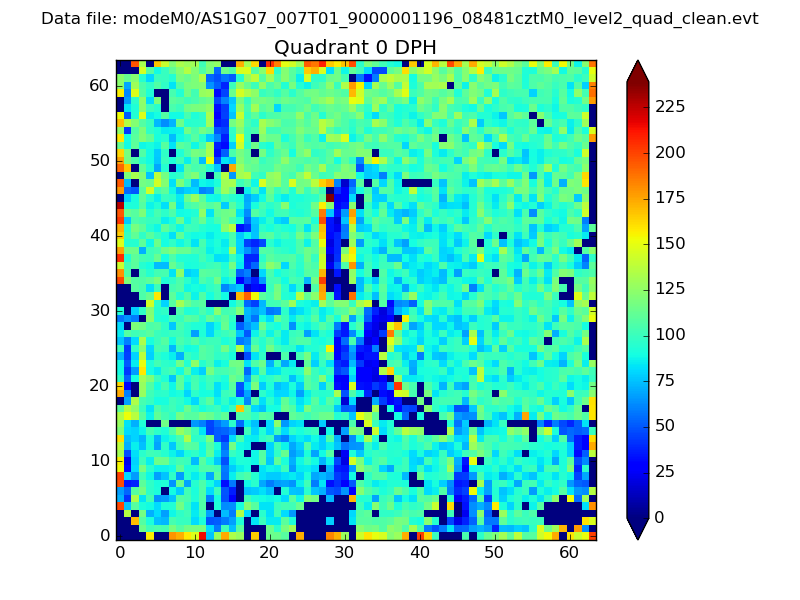 |
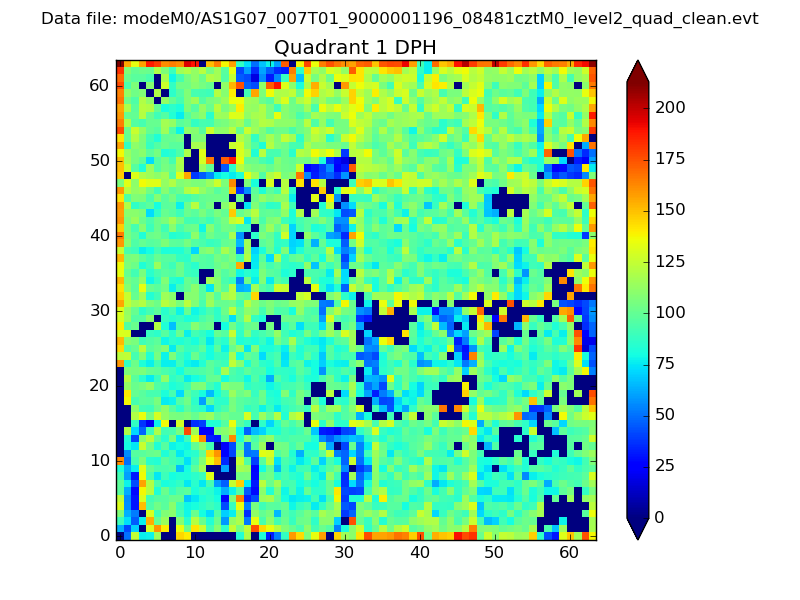 |
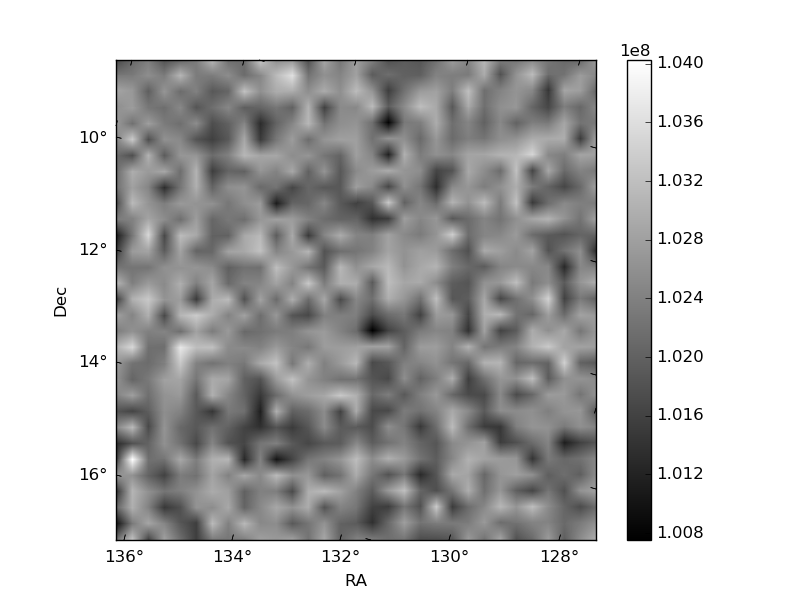
Quadrant B |
|---|---|---|---|
| Quadrant D | 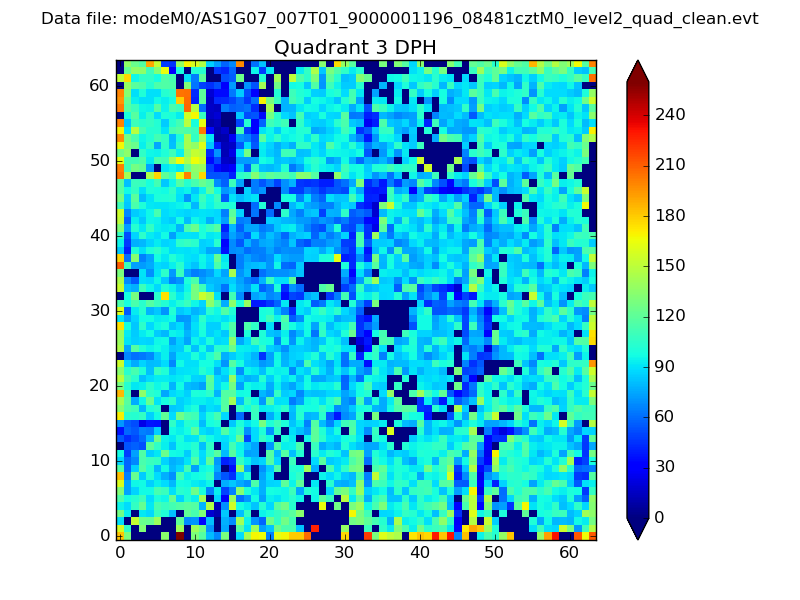 |
 |
Quadrant C |
| Plot type | Count rate plots | Images |
|---|---|---|
| Comparison with Poisson distribution Blue bars denote a histogram of data divided into 1 sec bins. Red curve is a Poisson curve with rate = median count rate of data. |
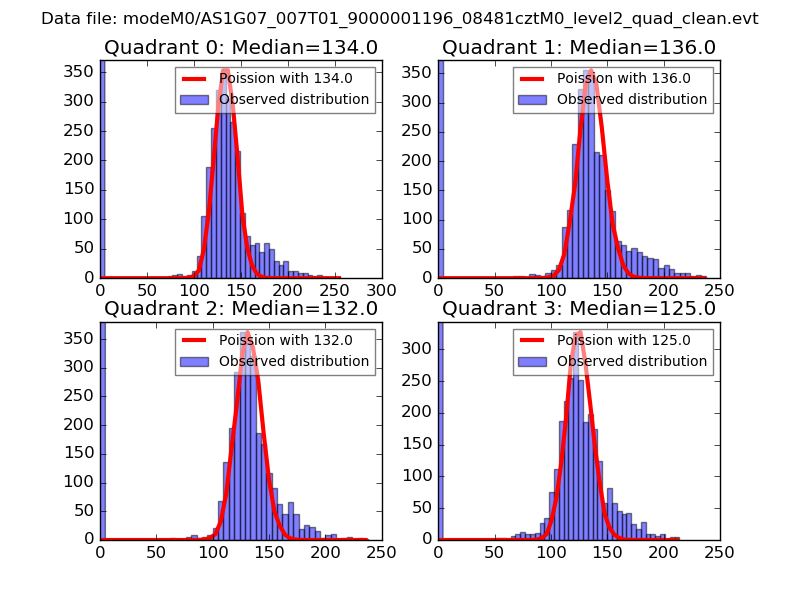 |
 |
| Quadrant-wise count rates Data is divided into 100 sec bins |
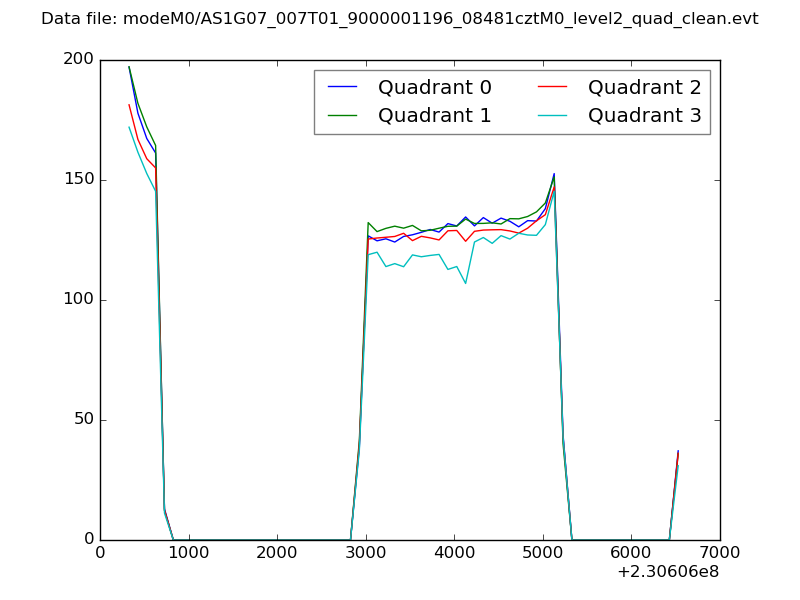 |
|
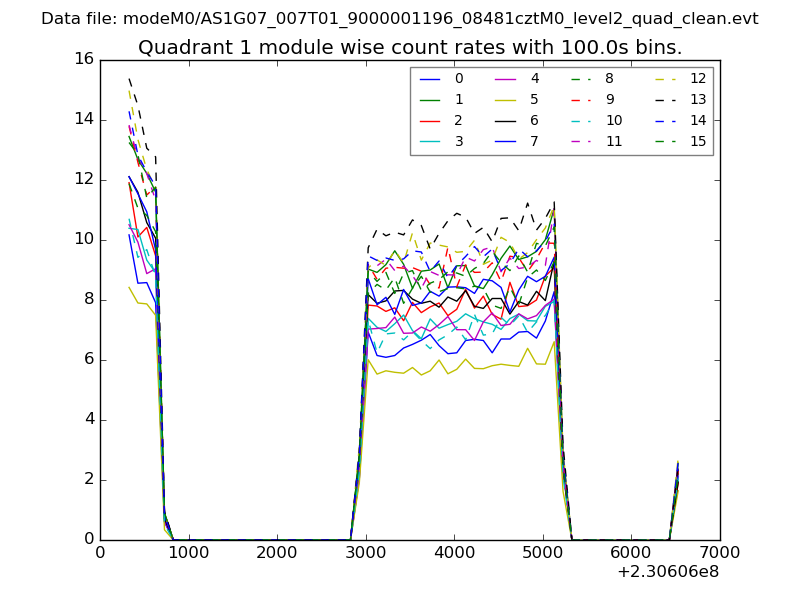
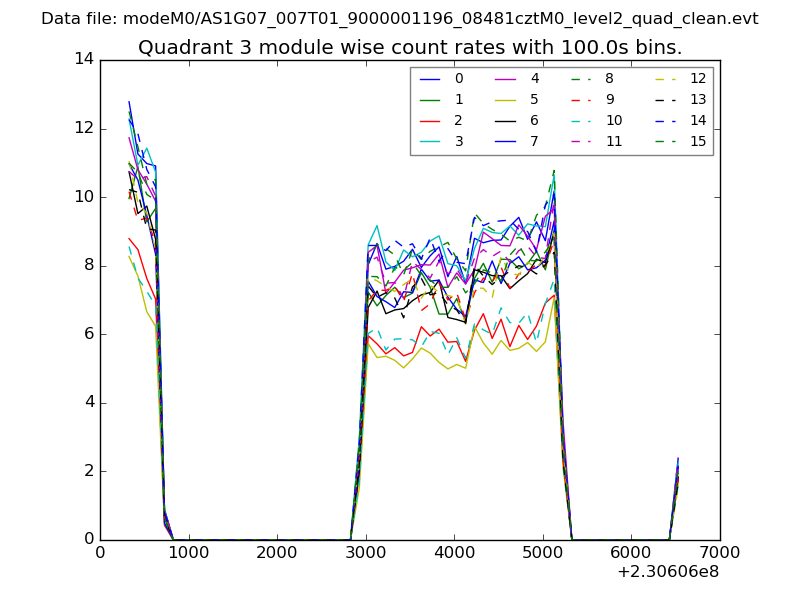
| Module-wise count rates for Quadrant A Data is divided into 100 sec bins |
 |
 |
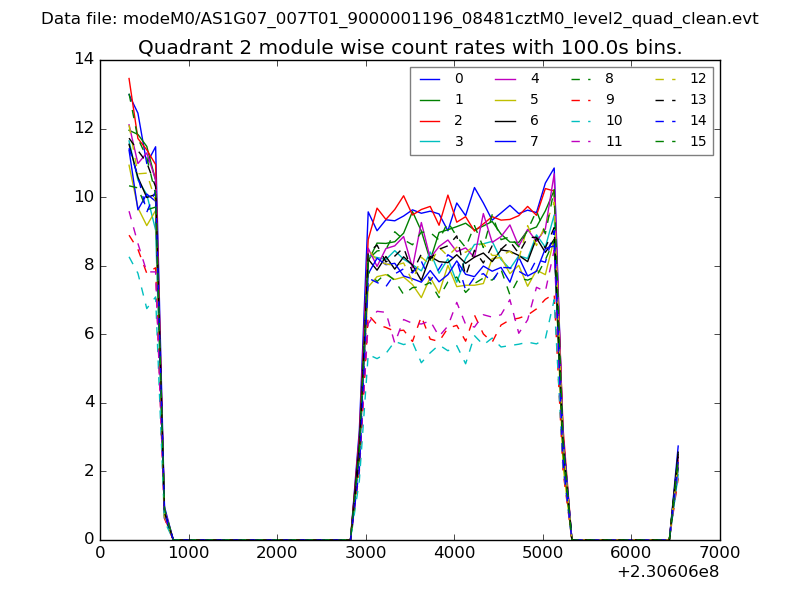
| Module-wise count rates for Quadrant B Data is divided into 100 sec bins |
 |
 |
| Module-wise count rates for Quadrant C Data is divided into 100 sec bins |
 |
 |
| Module-wise count rates for Quadrant D Data is divided into 100 sec bins |
 |
 |
| Parameter | Plot |
|---|---|
| CZT HV Monitor | 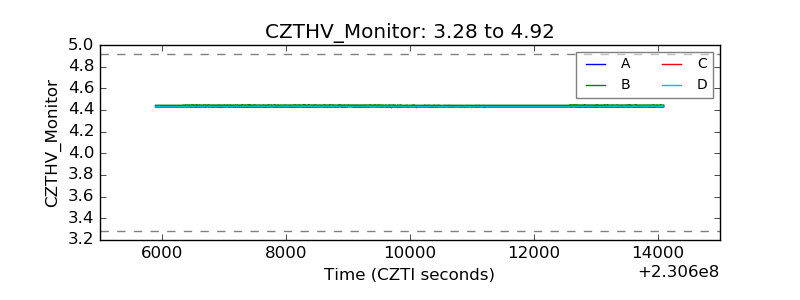 |
| D_VDD | 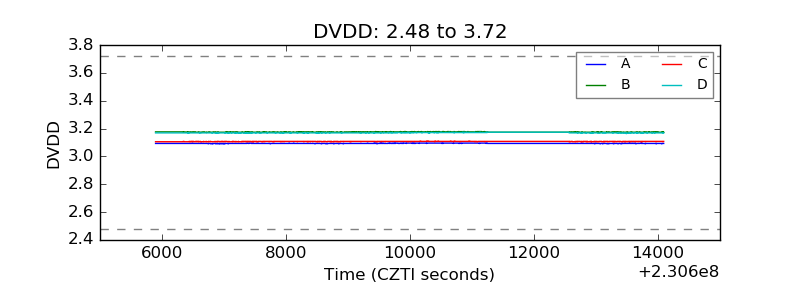 |
| Temperature 1 | 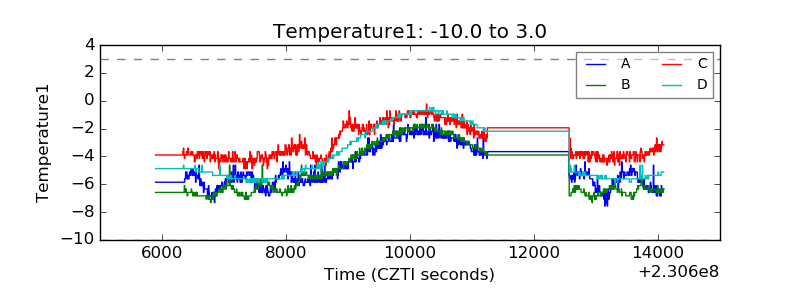 |
| Veto HV Monitor | 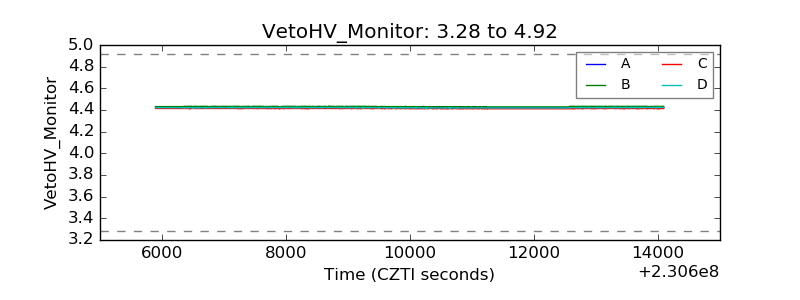 |
| Veto LLD | 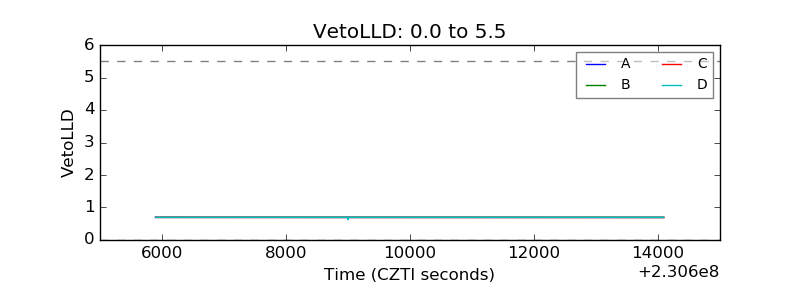 |
| Alpha Counter | 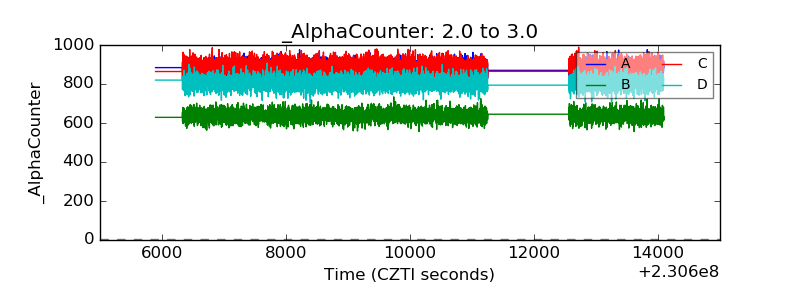 |
| _CPM_Rate | 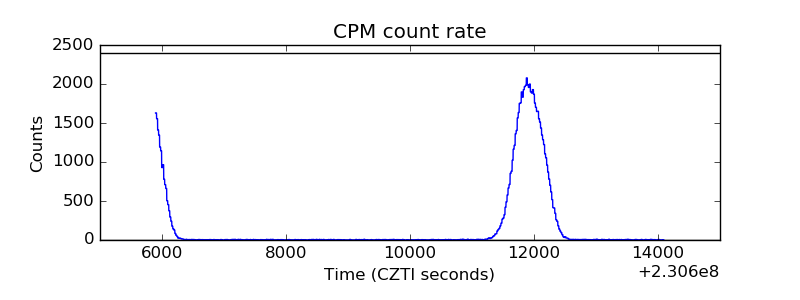 |
| CZT Counter | 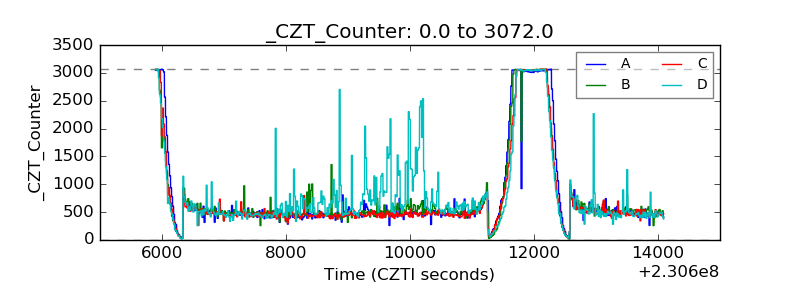 |
| +2.5 Volts monitor |  |
| +5 Volts monitor |  |
| _ROLL_ROT |  |
| _Roll_DEC | 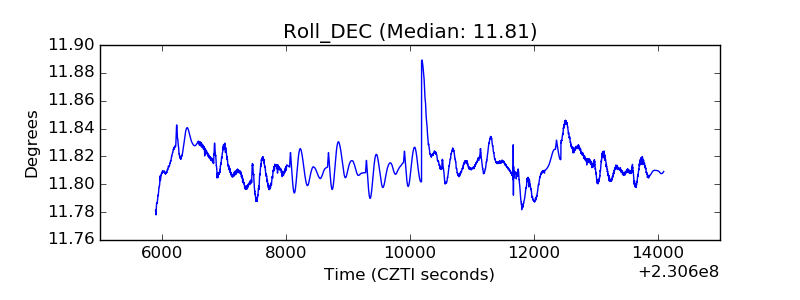 |
| _Roll_RA | 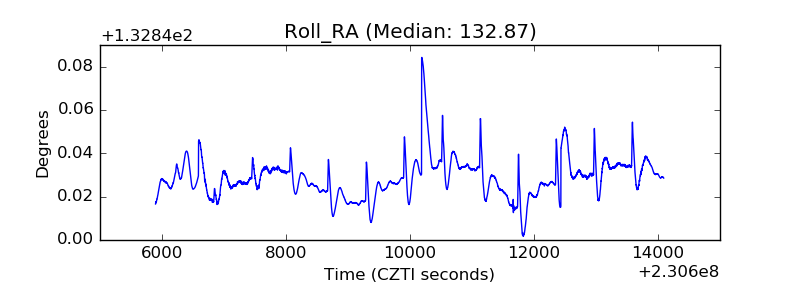 |
| Veto Counter |  |