| Param | Original file | Final file |
|---|---|---|
| Filename | modeM0/AS1G07_007T01_9000001196_08482cztM0_level2.evt | modeM0/AS1G07_007T01_9000001196_08482cztM0_level2_quad_clean.evt |
| Size (bytes) | 443,301,120 | 60,937,920 |
| Size | 422.8 MB | 58.1 MB |
| Events in quadrant A | 3,258,602 | 356,222 |
| Events in quadrant B | 3,465,924 | 359,900 |
| Events in quadrant C | 3,074,181 | 348,539 |
| Events in quadrant D | 3,194,028 | 336,029 |
| Mode SS | |||
|---|---|---|---|
| Quadrant | BADHDUFLAG | Total packets | Discarded packets |
| A | 0 | 130 | 0 |
| B | 0 | 130 | 0 |
| C | 0 | 130 | 0 |
| D | 0 | 130 | 0 |
| Mode M9 | |||
|---|---|---|---|
| Quadrant | BADHDUFLAG | Total packets | Discarded packets |
| A | 0 | 18 | 0 |
| B | 0 | 18 | 0 |
| C | 0 | 18 | 0 |
| D | 0 | 19 | 0 |
| Mode M0 | |||
|---|---|---|---|
| Quadrant | BADHDUFLAG | Total packets | Discarded packets |
| A | 0 | 13465 | 3 |
| B | 0 | 14027 | 2 |
| C | 0 | 13150 | 2 |
| D | 0 | 13678 | 2 |
| Quadrant | Total seconds | Saturated seconds | Saturation percentage |
|---|---|---|---|
| A | 6363 | 54 | 0.848656% |
| B | 6363 | 82 | 1.288700% |
| C | 6363 | 22 | 0.345749% |
| D | 6363 | 47 | 0.738645% |
Noise dominated data is calculated using 1-second bins in cleaned event files. If a bin has >2000 counts, and if more than 50% of those come from <1% of pixels, then it is considered to be noise-dominated and hence unusable.
| Quadrant | # 1 sec bins | Bins with >0 counts | Bins with >2000 counts | High rate bins dominated by noise | Noise dominated (total time) | Noise dominated (detector-on time) | Marked lightcurve |
|---|---|---|---|---|---|---|---|
| A | 7673 | 6364 | 2 | 2 | 0.03% | 0.03% | 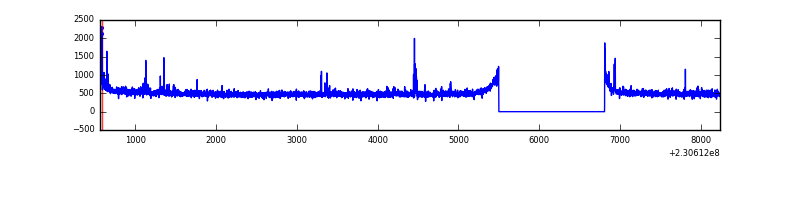 |
| B | 7673 | 6364 | 6 | 6 | 0.08% | 0.09% | 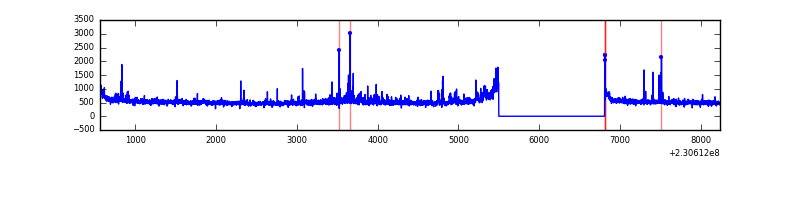 |
| C | 7673 | 6364 | 1 | 1 | 0.01% | 0.02% | 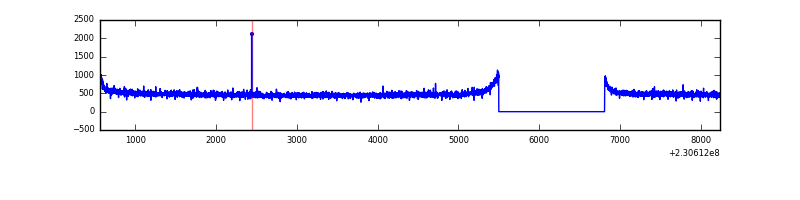 |
| D | 7673 | 6364 | 23 | 23 | 0.30% | 0.36% | 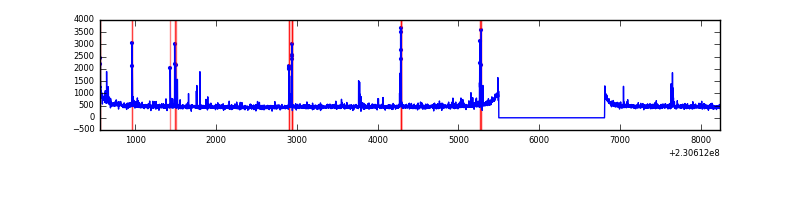 |
Top three noisy pixels from each quadrant. If the there are fewer than three noisy pixels in the level2.evt file, extra rows are filled as -1
| Pixel properties | Quadrant properties | ||||||
|---|---|---|---|---|---|---|---|
| Quadrant | DetID | PixID | Counts | Sigma | Mean | Median | Sigma |
| A | 4 | 2 | 30597 | 180.34 | 820 | 806 | 165.2 |
| A | 15 | 236 | 20929 | 121.82 | 820 | 806 | 165.2 |
| A | 14 | 111 | 19666 | 114.17 | 820 | 806 | 165.2 |
| B | 5 | 255 | 123979 | 795.37 | 824 | 807 | 154.9 |
| B | 11 | 51 | 53179 | 338.19 | 824 | 807 | 154.9 |
| B | 0 | 214 | 47475 | 301.35 | 824 | 807 | 154.9 |
| C | 13 | 61 | 6266 | 30.04 | 786 | 794 | 182.1 |
| C | 8 | 222 | 4809 | 22.04 | 786 | 794 | 182.1 |
| C | 12 | 4 | 4489 | 20.29 | 786 | 794 | 182.1 |
| D | 2 | 14 | 51337 | 258.65 | 780 | 760 | 195.5 |
| D | 13 | 137 | 47399 | 238.51 | 780 | 760 | 195.5 |
| D | 1 | 52 | 33822 | 169.08 | 780 | 760 | 195.5 |
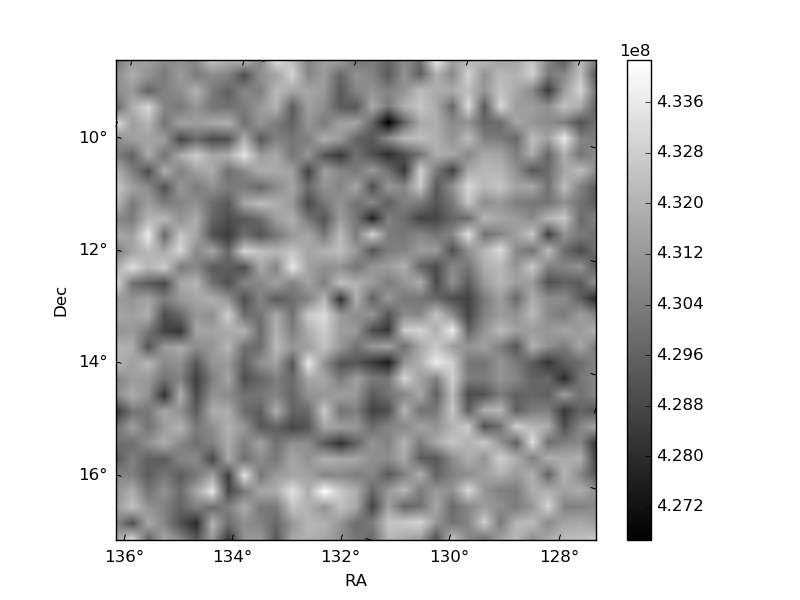
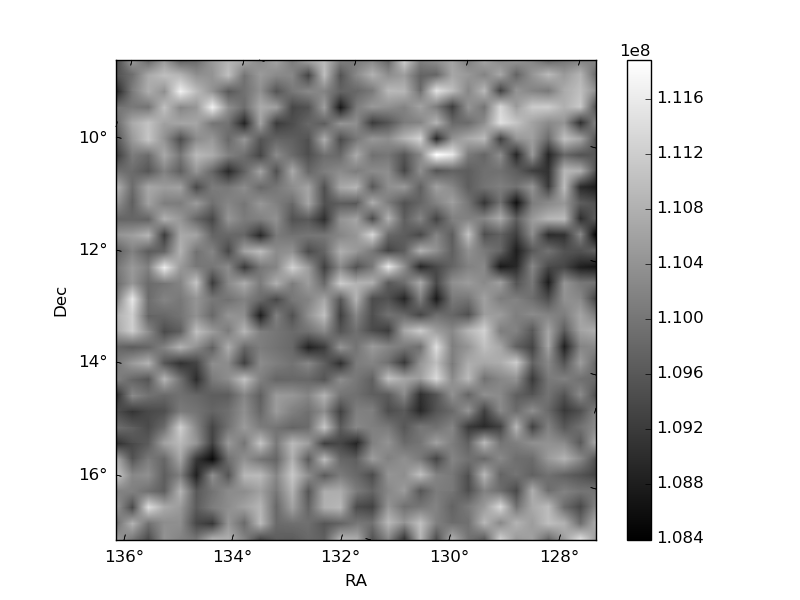
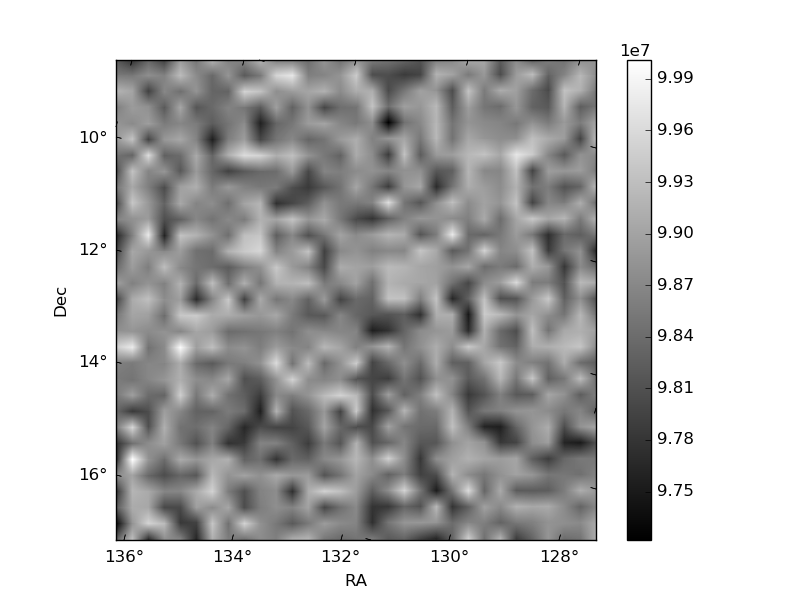
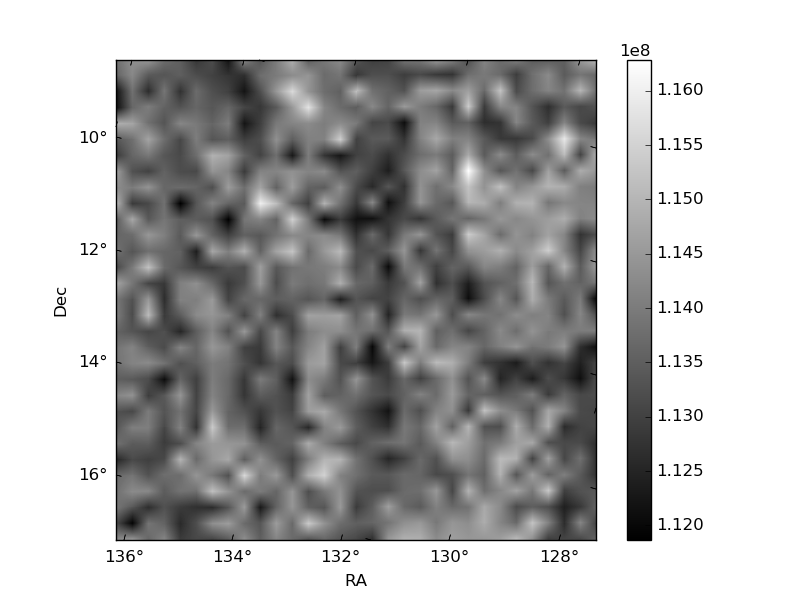
Histogram calculated using DETX and DETY for each event in the final _common_clean file
| Quadrant A | 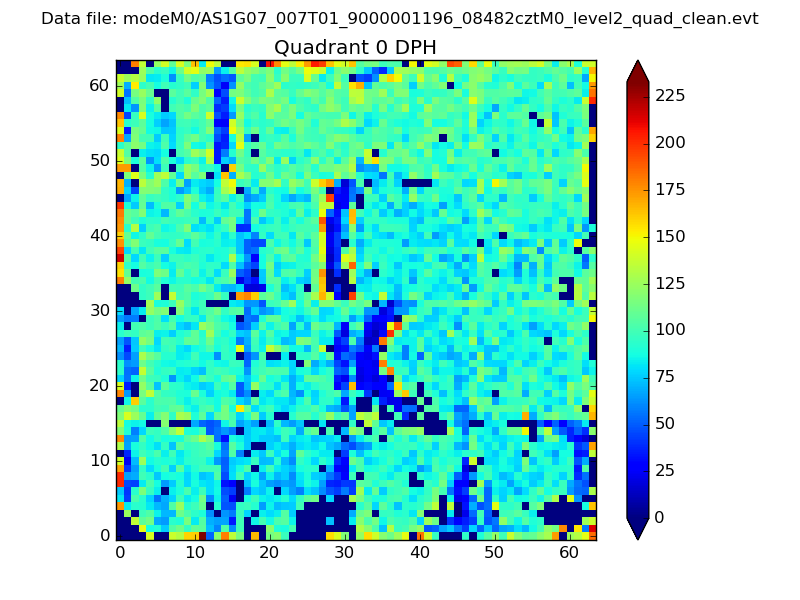 |
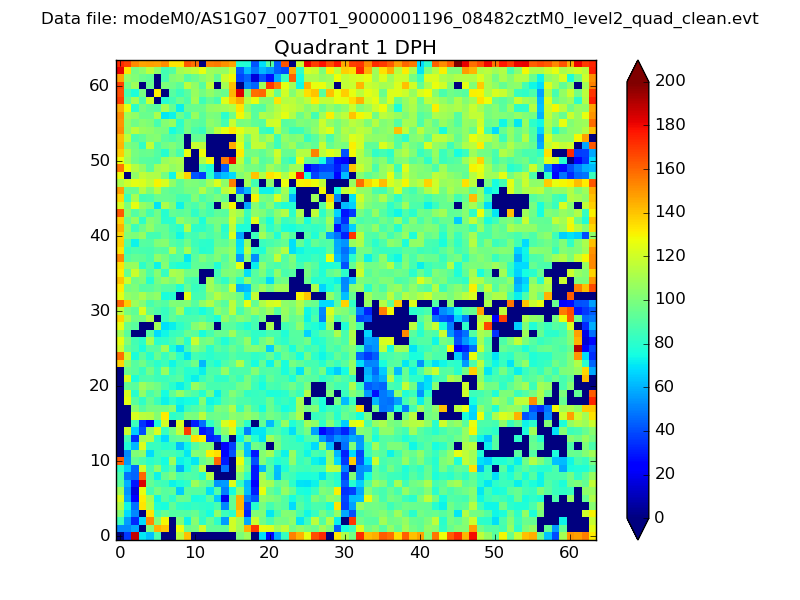 |
Quadrant B |
|---|---|---|---|
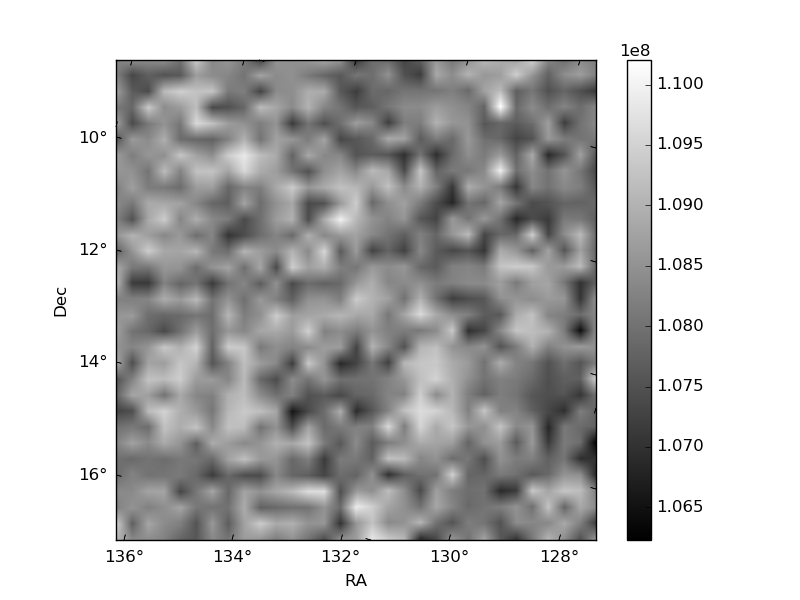
| Quadrant D | 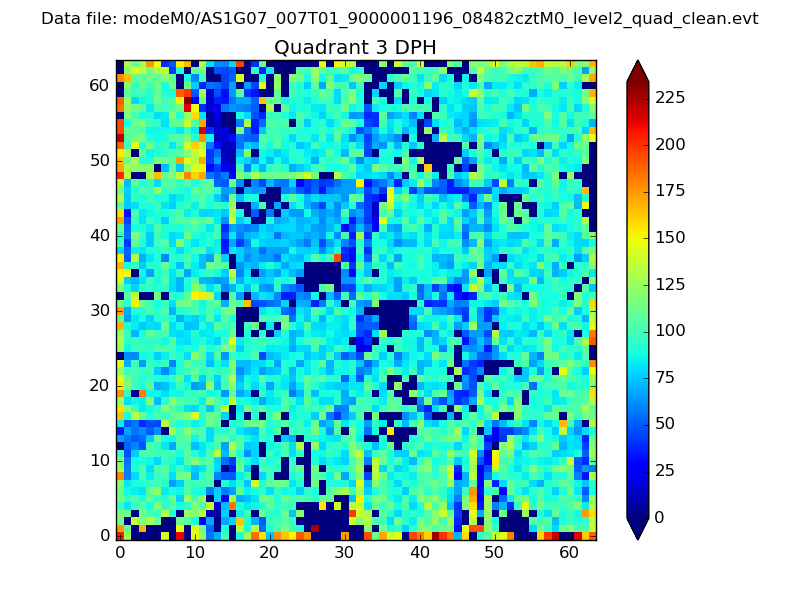 |
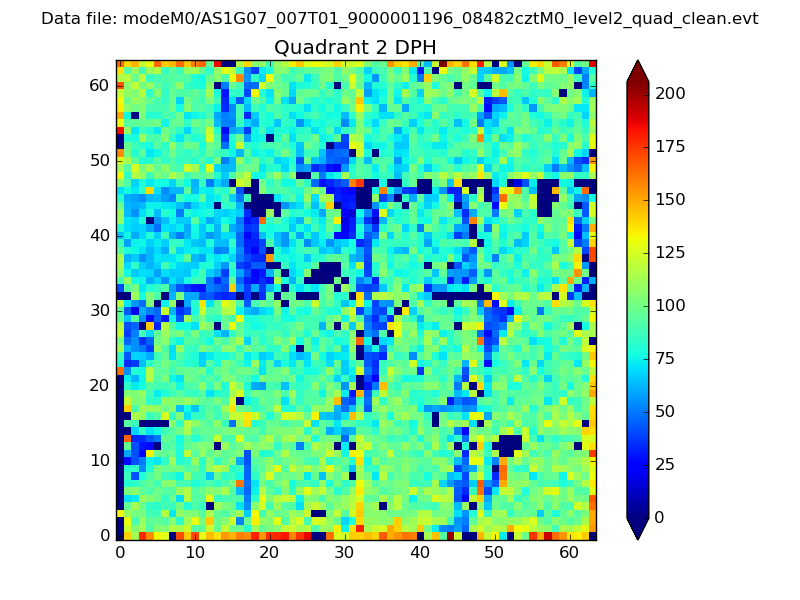 |
Quadrant C |
| Plot type | Count rate plots | Images |
|---|---|---|
| Comparison with Poisson distribution Blue bars denote a histogram of data divided into 1 sec bins. Red curve is a Poisson curve with rate = median count rate of data. |
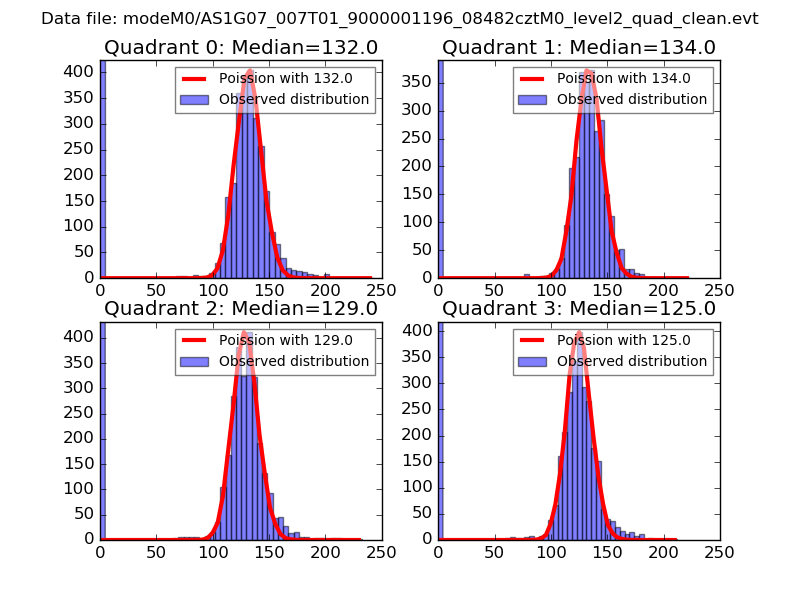 |
 |
| Quadrant-wise count rates Data is divided into 100 sec bins |
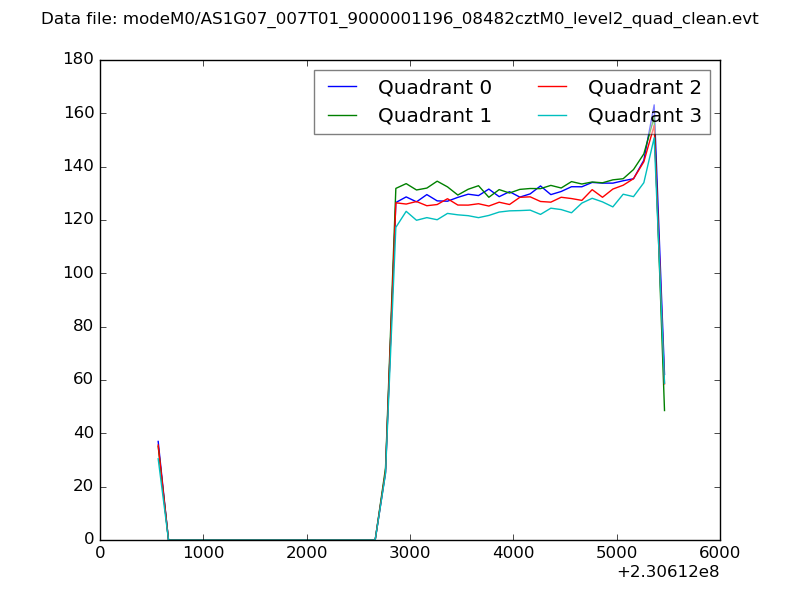 |
|
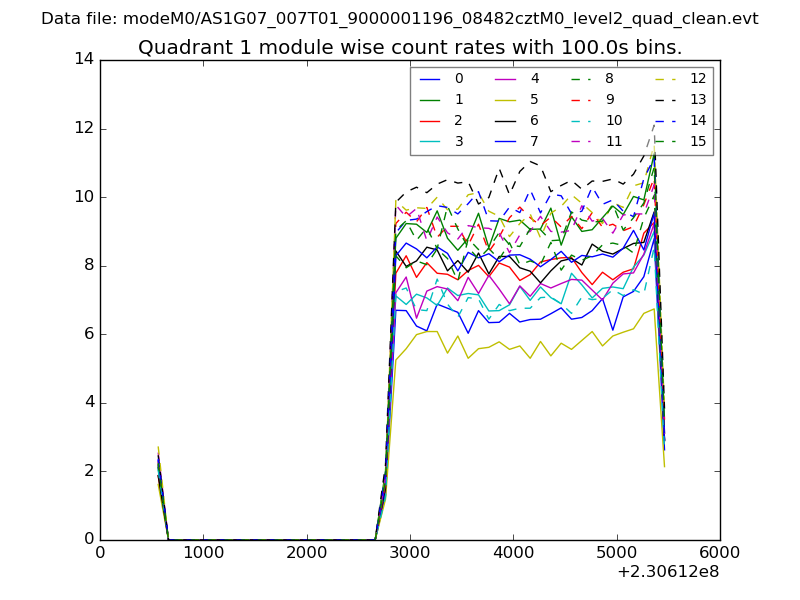
| Module-wise count rates for Quadrant A Data is divided into 100 sec bins |
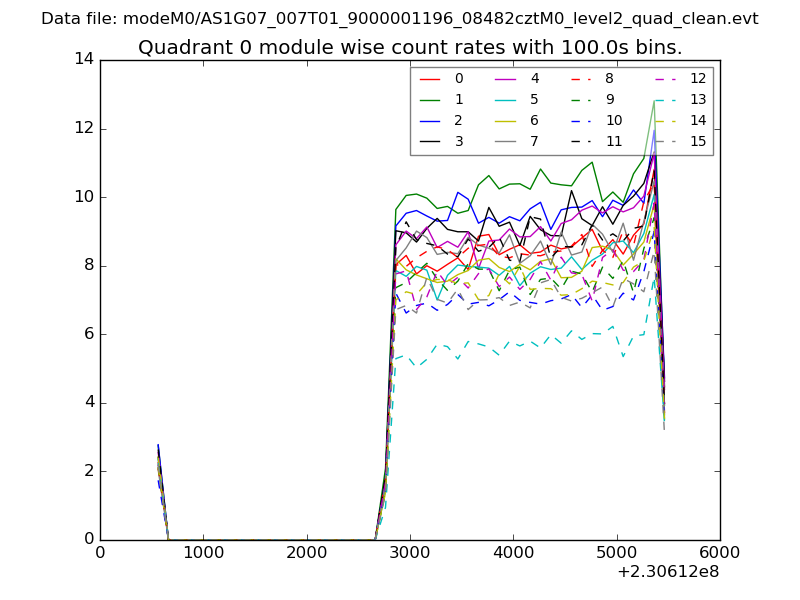 |
 |
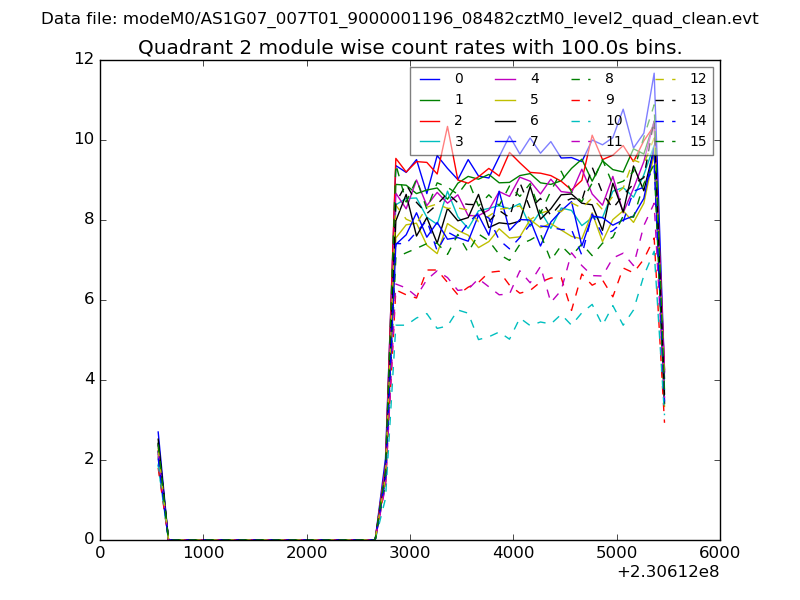
| Module-wise count rates for Quadrant B Data is divided into 100 sec bins |
 |
 |
| Module-wise count rates for Quadrant C Data is divided into 100 sec bins |
 |
 |
| Module-wise count rates for Quadrant D Data is divided into 100 sec bins |
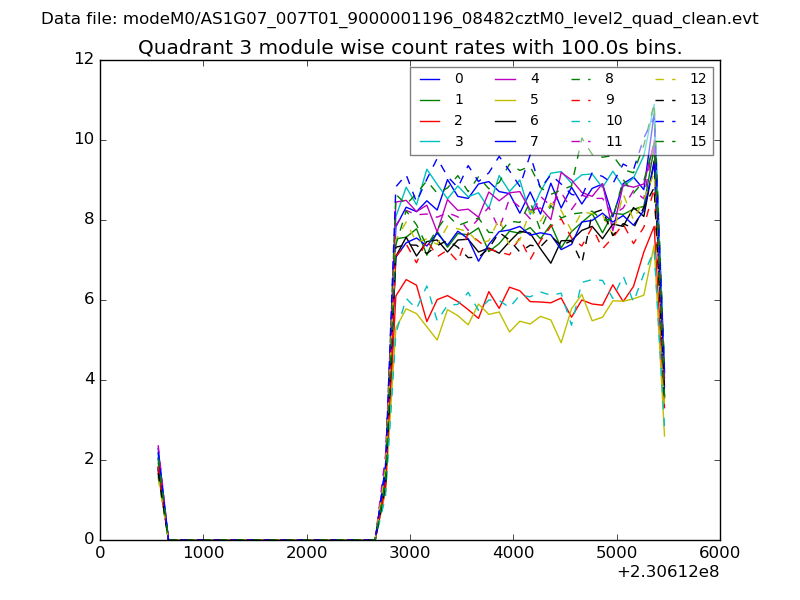 |
 |
| Parameter | Plot |
|---|---|
| CZT HV Monitor | 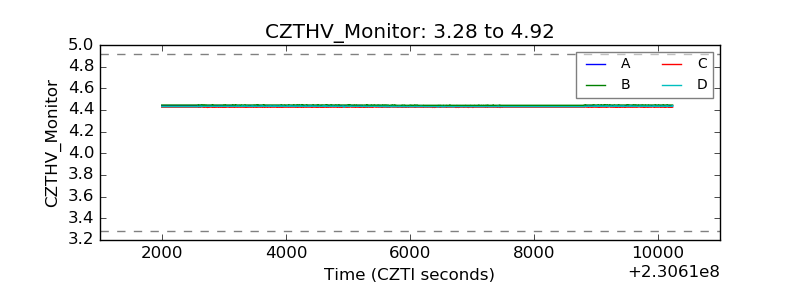 |
| D_VDD | 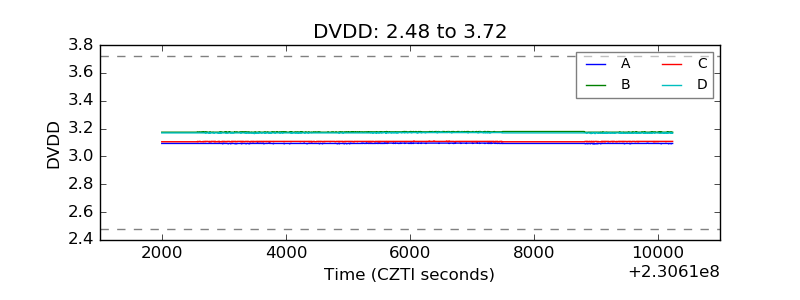 |
| Temperature 1 |  |
| Veto HV Monitor | 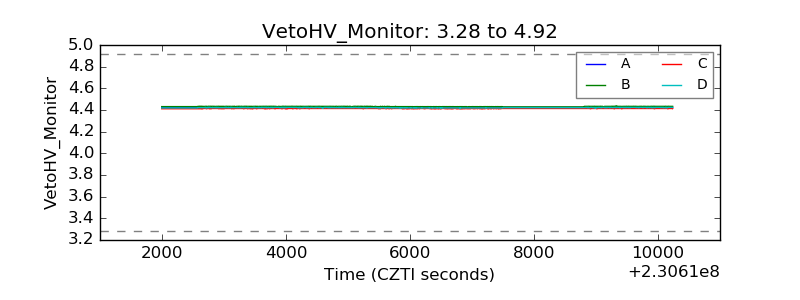 |
| Veto LLD | 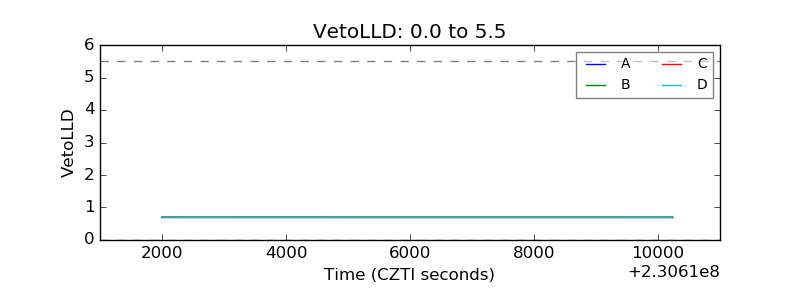 |
| Alpha Counter | 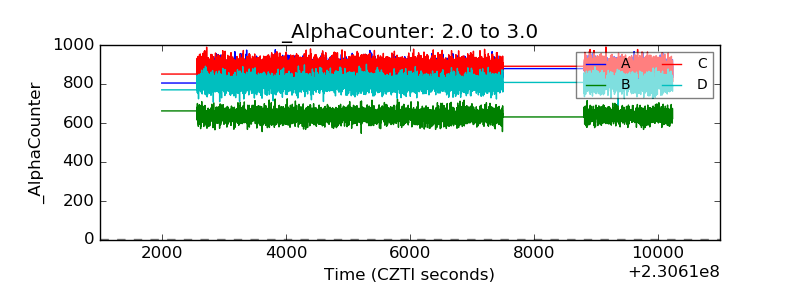 |
| _CPM_Rate | 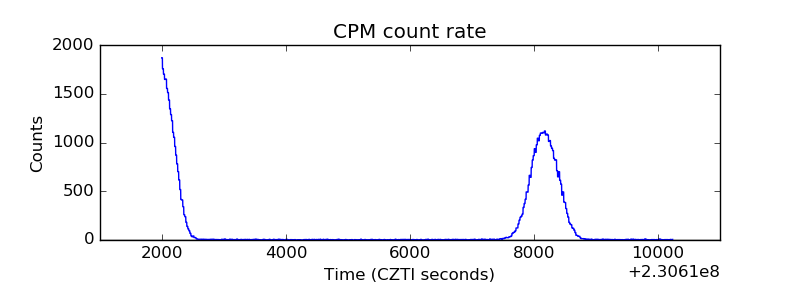 |
| CZT Counter | 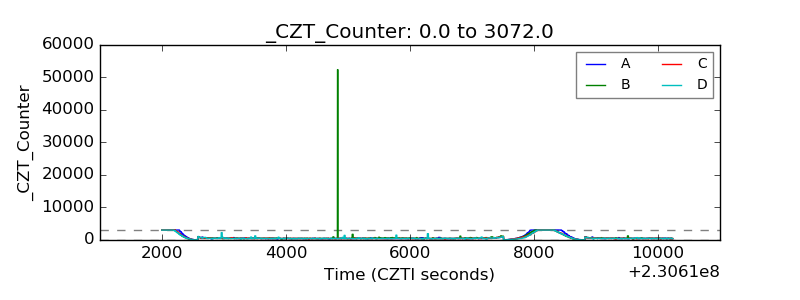 |
| +2.5 Volts monitor |  |
| +5 Volts monitor |  |
| _ROLL_ROT | 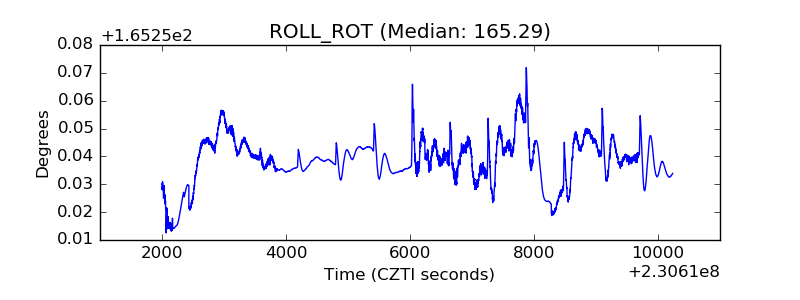 |
| _Roll_DEC | 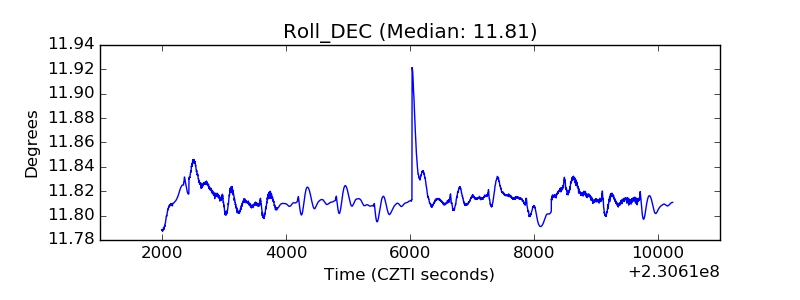 |
| _Roll_RA | 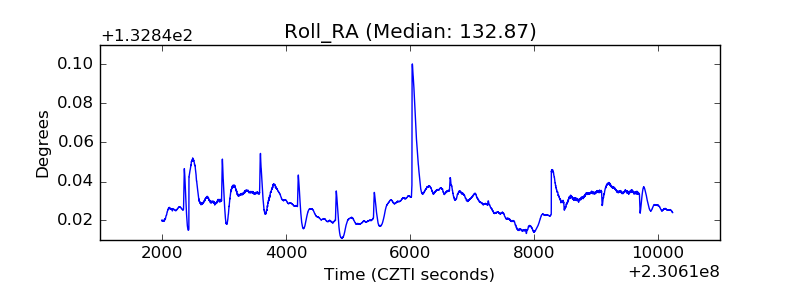 |
| Veto Counter | 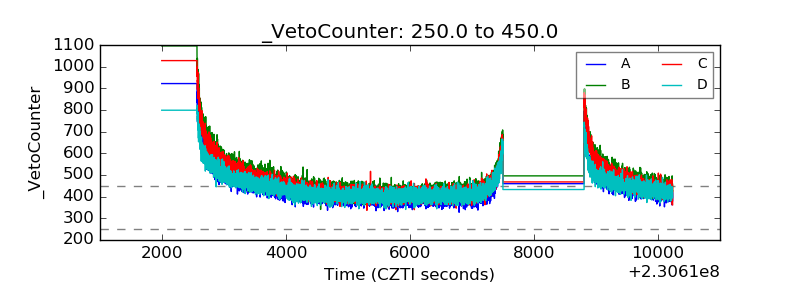 |