| Param | Original file | Final file |
|---|---|---|
| Filename | modeM0/AS1G07_007T01_9000001196_08483cztM0_level2.evt | modeM0/AS1G07_007T01_9000001196_08483cztM0_level2_quad_clean.evt |
| Size (bytes) | 497,479,680 | 68,875,200 |
| Size | 474.4 MB | 65.7 MB |
| Events in quadrant A | 4,642,579 | 411,526 |
| Events in quadrant B | 3,654,918 | 418,930 |
| Events in quadrant C | 3,092,816 | 408,224 |
| Events in quadrant D | 3,238,408 | 397,095 |
| Mode SS | |||
|---|---|---|---|
| Quadrant | BADHDUFLAG | Total packets | Discarded packets |
| A | 0 | 130 | 0 |
| B | 0 | 130 | 0 |
| C | 0 | 130 | 0 |
| D | 0 | 130 | 0 |
| Mode M9 | |||
|---|---|---|---|
| Quadrant | BADHDUFLAG | Total packets | Discarded packets |
| A | 0 | 15 | 0 |
| B | 0 | 15 | 0 |
| C | 0 | 15 | 0 |
| D | 0 | 16 | 0 |
| Mode M0 | |||
|---|---|---|---|
| Quadrant | BADHDUFLAG | Total packets | Discarded packets |
| A | 0 | 17916 | 3 |
| B | 0 | 14699 | 2 |
| C | 0 | 13404 | 2 |
| D | 0 | 13895 | 2 |
| Quadrant | Total seconds | Saturated seconds | Saturation percentage |
|---|---|---|---|
| A | 6445 | 516 | 8.006206% |
| B | 6445 | 188 | 2.916990% |
| C | 6445 | 88 | 1.365400% |
| D | 6445 | 108 | 1.675718% |
Noise dominated data is calculated using 1-second bins in cleaned event files. If a bin has >2000 counts, and if more than 50% of those come from <1% of pixels, then it is considered to be noise-dominated and hence unusable.
| Quadrant | # 1 sec bins | Bins with >0 counts | Bins with >2000 counts | High rate bins dominated by noise | Noise dominated (total time) | Noise dominated (detector-on time) | Marked lightcurve |
|---|---|---|---|---|---|---|---|
| A | 7570 | 6445 | 310 | 310 | 4.10% | 4.81% | 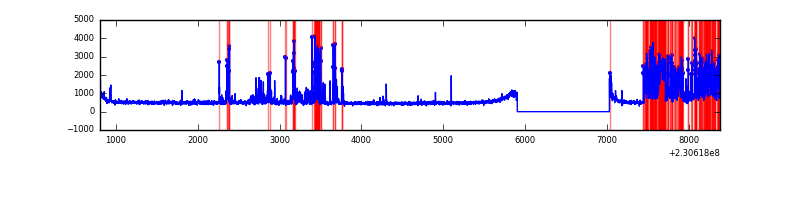 |
| B | 7570 | 6445 | 38 | 38 | 0.50% | 0.59% | 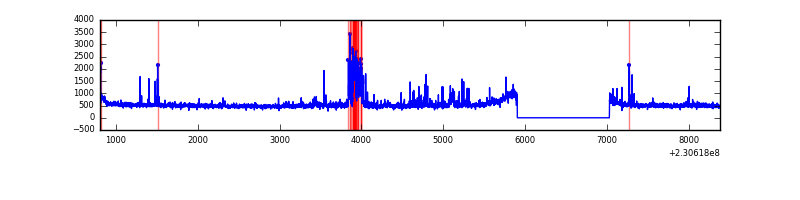 |
| C | 7570 | 6446 | 0 | 0 | 0.00% | 0.00% | 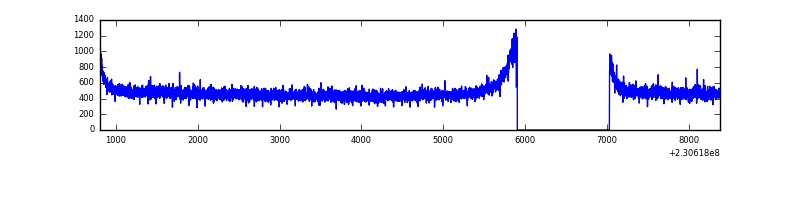 |
| D | 7570 | 6445 | 17 | 17 | 0.22% | 0.26% | 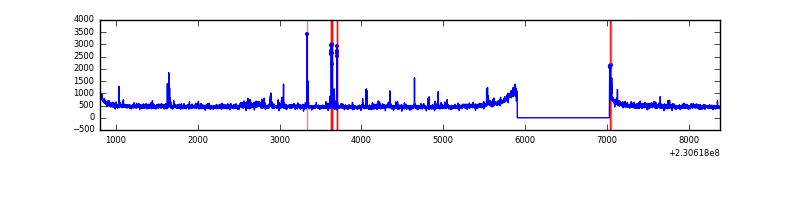 |
Top three noisy pixels from each quadrant. If the there are fewer than three noisy pixels in the level2.evt file, extra rows are filled as -1
| Pixel properties | Quadrant properties | ||||||
|---|---|---|---|---|---|---|---|
| Quadrant | DetID | PixID | Counts | Sigma | Mean | Median | Sigma |
| A | 5 | 16 | 1485284 | 9067.26 | 808 | 790 | 163.7 |
| A | 15 | 236 | 18680 | 109.27 | 808 | 790 | 163.7 |
| A | 13 | 251 | 17044 | 99.28 | 808 | 790 | 163.7 |
| B | 5 | 255 | 273198 | 1730.28 | 826 | 810 | 157.4 |
| B | 11 | 51 | 58335 | 365.41 | 826 | 810 | 157.4 |
| B | 0 | 214 | 50662 | 316.67 | 826 | 810 | 157.4 |
| C | 13 | 61 | 6209 | 29.51 | 792 | 799 | 183.3 |
| C | 8 | 222 | 2636 | 10.02 | 792 | 799 | 183.3 |
| C | 3 | 202 | 2018 | 6.65 | 792 | 799 | 183.3 |
| D | 2 | 152 | 65453 | 331.35 | 788 | 770 | 195.2 |
| D | 1 | 52 | 55890 | 282.36 | 788 | 770 | 195.2 |
| D | 7 | 71 | 40017 | 201.05 | 788 | 770 | 195.2 |
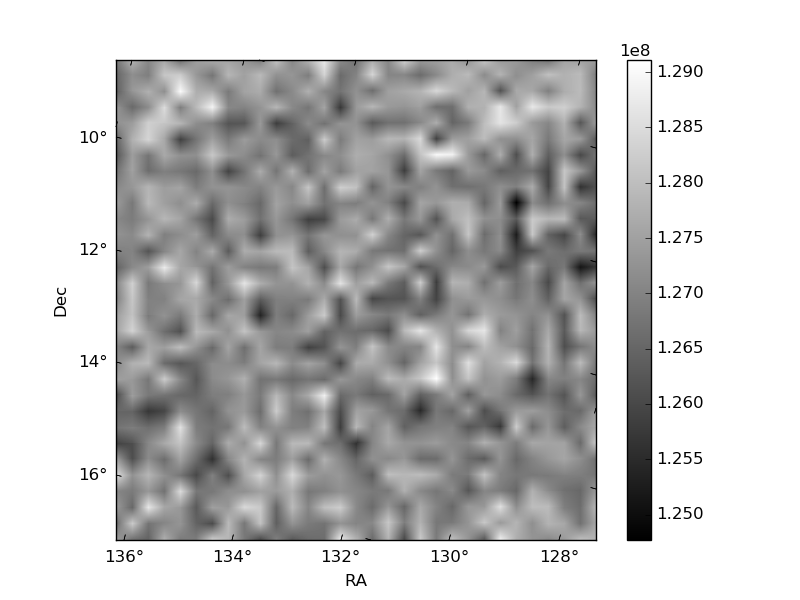
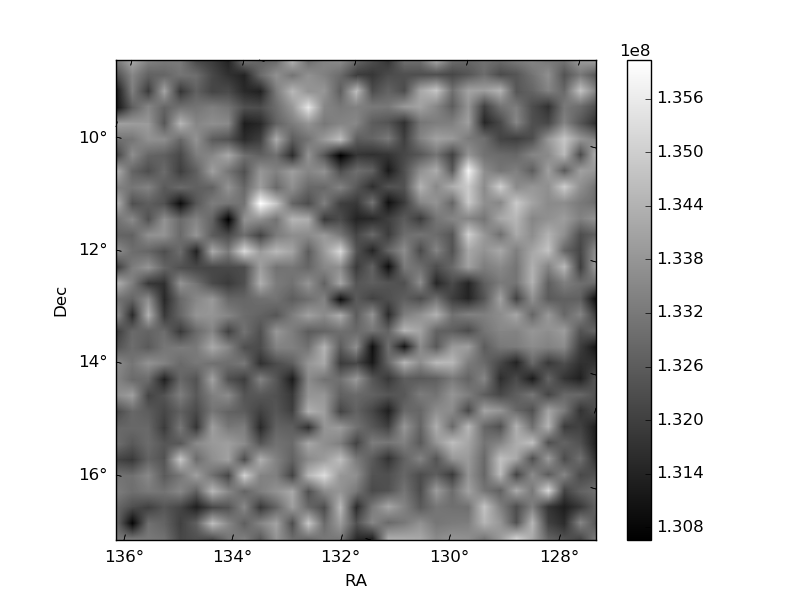
Histogram calculated using DETX and DETY for each event in the final _common_clean file
| Quadrant A |  |
 |
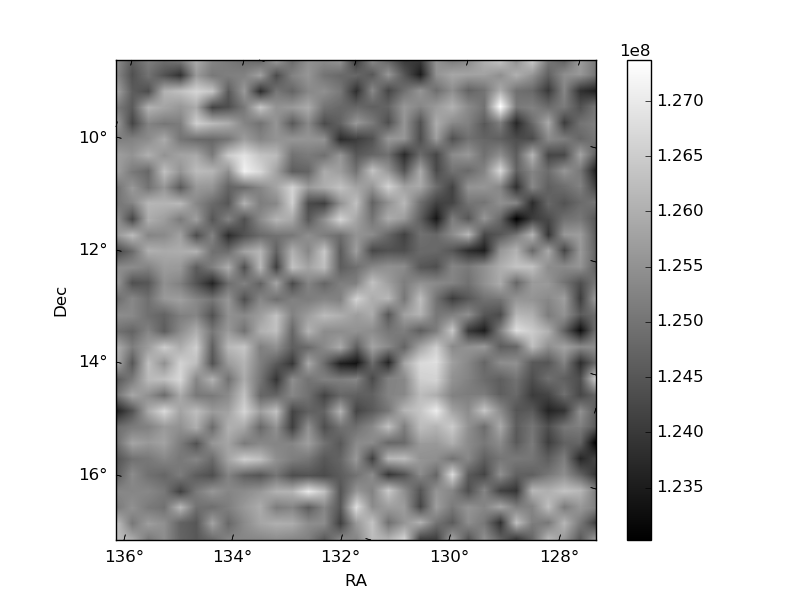
Quadrant B |
|---|---|---|---|
| Quadrant D |  |
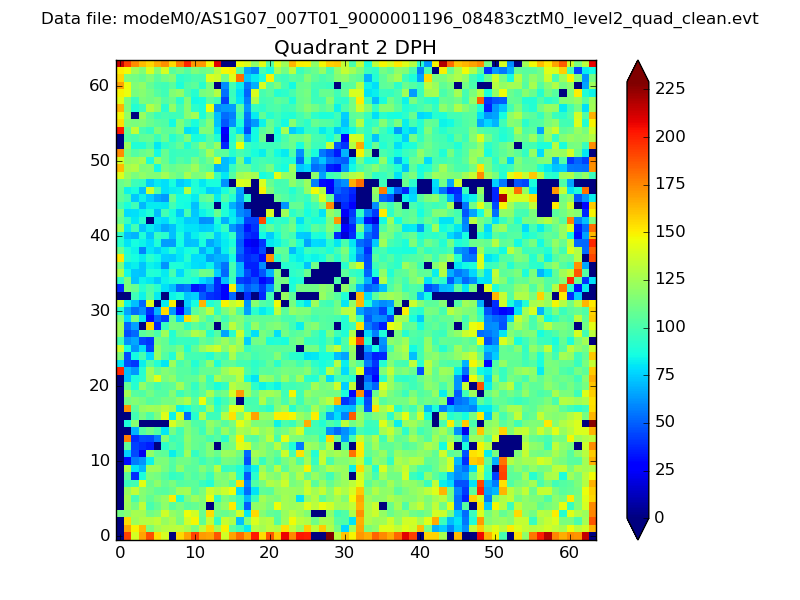 |
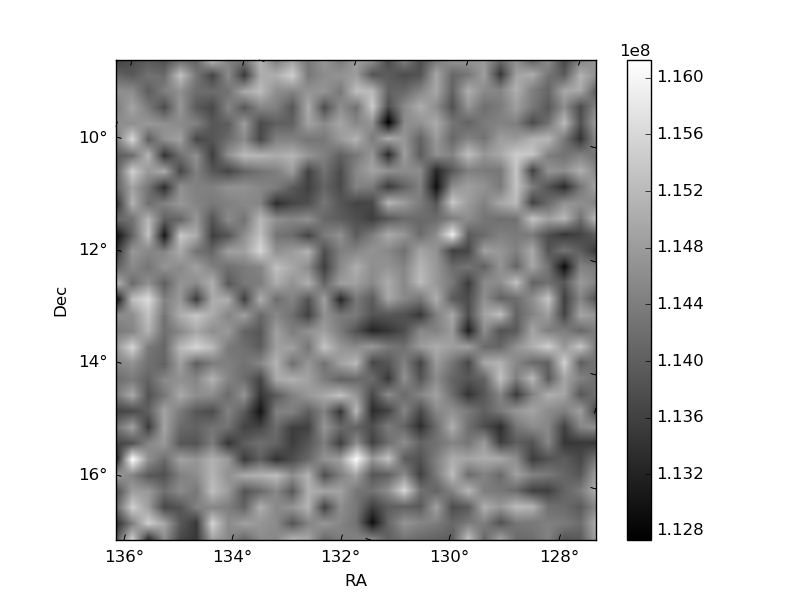
Quadrant C |
| Plot type | Count rate plots | Images |
|---|---|---|
| Comparison with Poisson distribution Blue bars denote a histogram of data divided into 1 sec bins. Red curve is a Poisson curve with rate = median count rate of data. |
 |
 |
| Quadrant-wise count rates Data is divided into 100 sec bins |
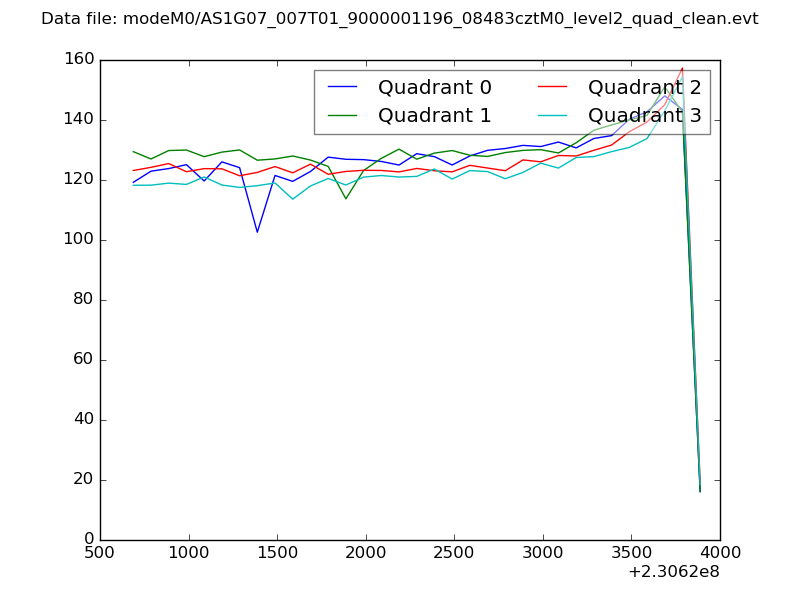 |
|
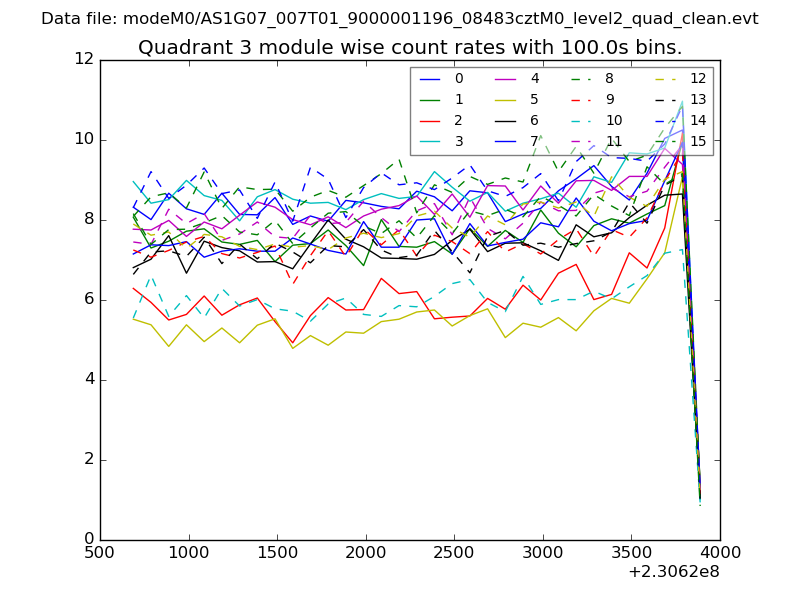
| Module-wise count rates for Quadrant A Data is divided into 100 sec bins |
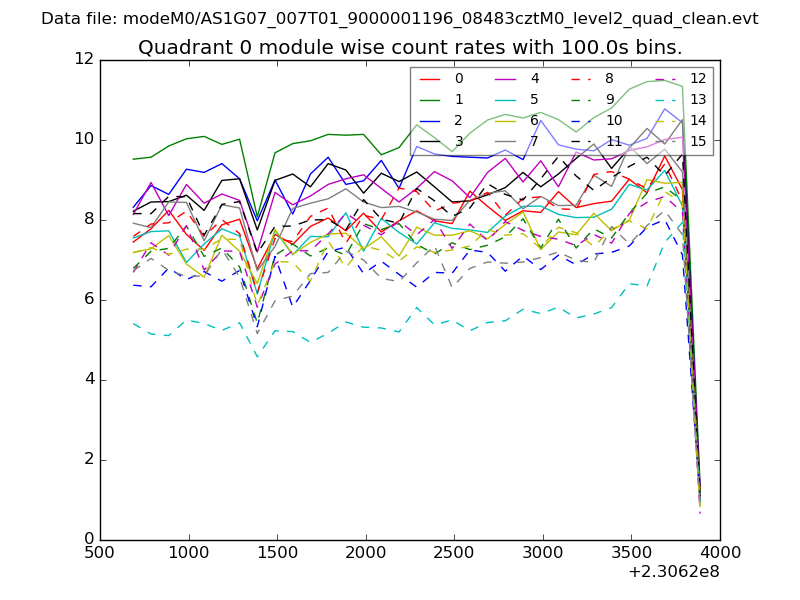 |
 |
| Module-wise count rates for Quadrant B Data is divided into 100 sec bins |
 |
 |
| Module-wise count rates for Quadrant C Data is divided into 100 sec bins |
 |
 |
| Module-wise count rates for Quadrant D Data is divided into 100 sec bins |
 |
 |
| Parameter | Plot |
|---|---|
| CZT HV Monitor |  |
| D_VDD | 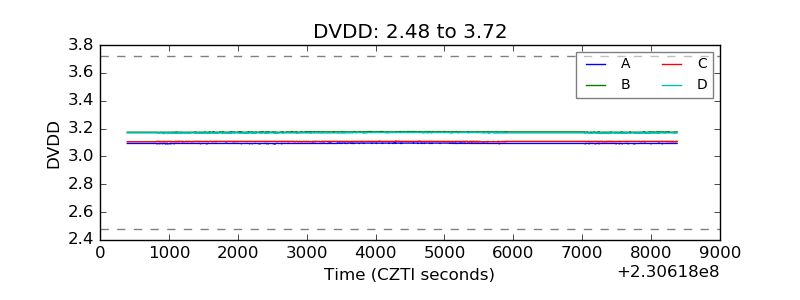 |
| Temperature 1 | 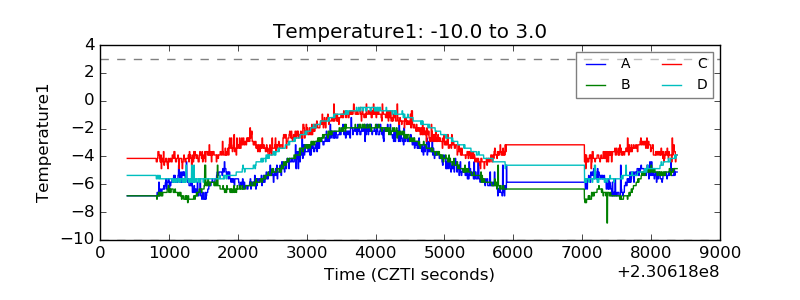 |
| Veto HV Monitor | 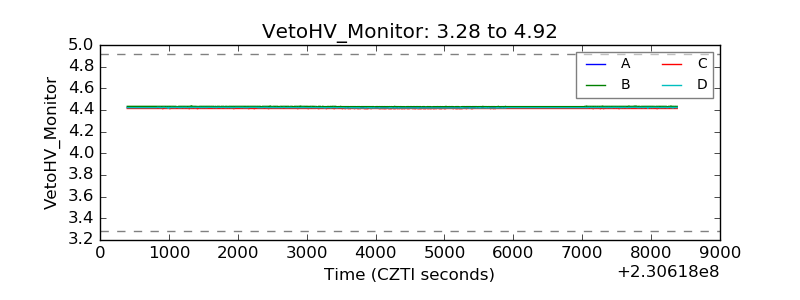 |
| Veto LLD | 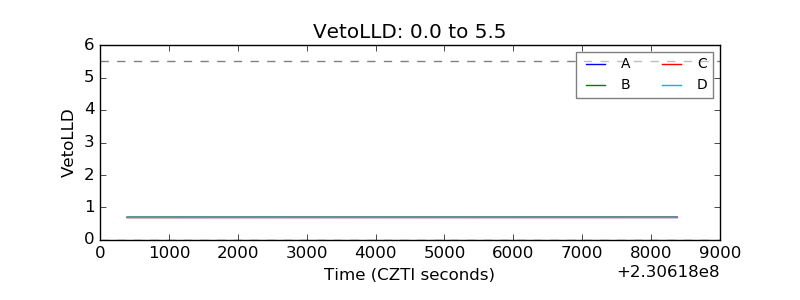 |
| Alpha Counter | 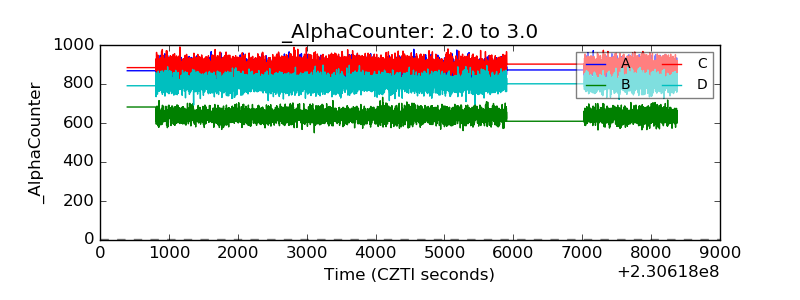 |
| _CPM_Rate | 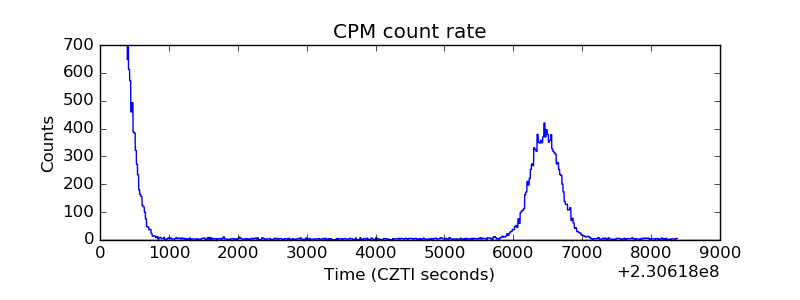 |
| CZT Counter | 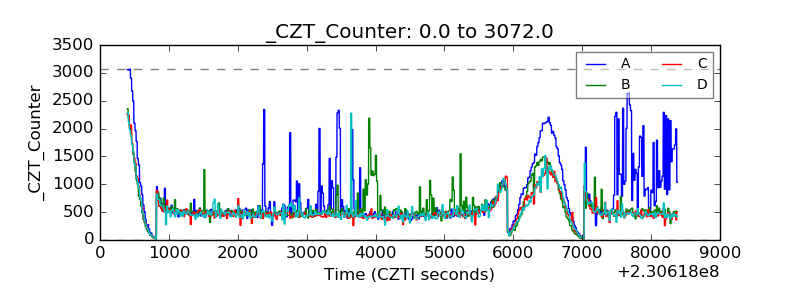 |
| +2.5 Volts monitor |  |
| +5 Volts monitor |  |
| _ROLL_ROT | 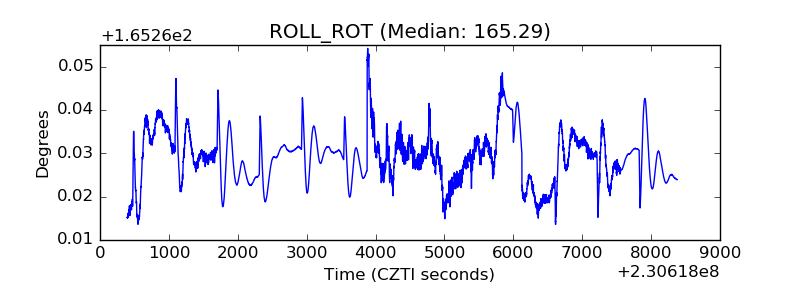 |
| _Roll_DEC | 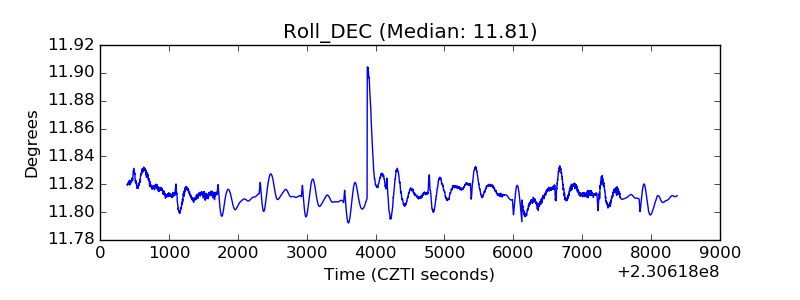 |
| _Roll_RA | 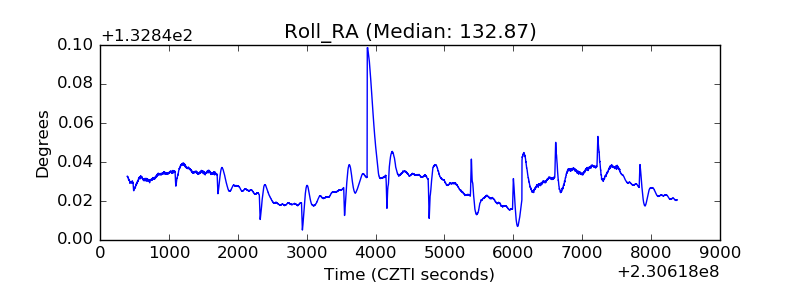 |
| Veto Counter | 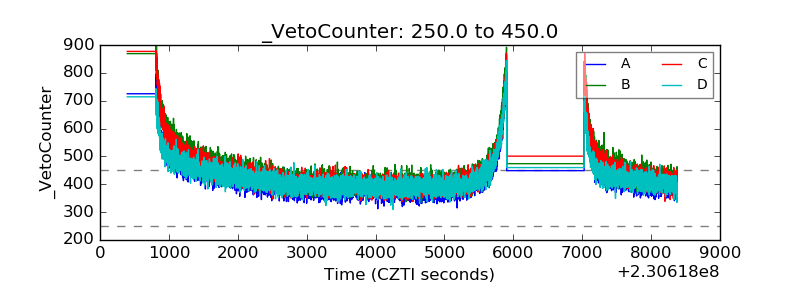 |