| Param | Original file | Final file |
|---|---|---|
| Filename | modeM0/AS1G07_007T01_9000001196_08485cztM0_level2.evt | modeM0/AS1G07_007T01_9000001196_08485cztM0_level2_quad_clean.evt |
| Size (bytes) | 588,769,920 | 83,531,520 |
| Size | 561.5 MB | 79.7 MB |
| Events in quadrant A | 6,347,239 | 496,982 |
| Events in quadrant B | 3,999,451 | 512,205 |
| Events in quadrant C | 3,367,102 | 512,035 |
| Events in quadrant D | 3,617,503 | 495,556 |
| Mode SS | |||
|---|---|---|---|
| Quadrant | BADHDUFLAG | Total packets | Discarded packets |
| A | 0 | 148 | 0 |
| B | 0 | 148 | 0 |
| C | 0 | 148 | 0 |
| D | 0 | 148 | 0 |
| Mode M9 | |||
|---|---|---|---|
| Quadrant | BADHDUFLAG | Total packets | Discarded packets |
| A | 0 | 3 | 0 |
| B | 0 | 3 | 0 |
| C | 0 | 3 | 0 |
| D | 0 | 3 | 0 |
| Mode M0 | |||
|---|---|---|---|
| Quadrant | BADHDUFLAG | Total packets | Discarded packets |
| A | 0 | 23915 | 2 |
| B | 0 | 16440 | 1 |
| C | 0 | 15145 | 1 |
| D | 0 | 15949 | 1 |
| Quadrant | Total seconds | Saturated seconds | Saturation percentage |
|---|---|---|---|
| A | 7367 | 976 | 13.248269% |
| B | 7367 | 323 | 4.384417% |
| C | 7367 | 152 | 2.063255% |
| D | 7367 | 231 | 3.135605% |
Noise dominated data is calculated using 1-second bins in cleaned event files. If a bin has >2000 counts, and if more than 50% of those come from <1% of pixels, then it is considered to be noise-dominated and hence unusable.
| Quadrant | # 1 sec bins | Bins with >0 counts | Bins with >2000 counts | High rate bins dominated by noise | Noise dominated (total time) | Noise dominated (detector-on time) | Marked lightcurve |
|---|---|---|---|---|---|---|---|
| A | 7647 | 7366 | 543 | 543 | 7.10% | 7.37% | 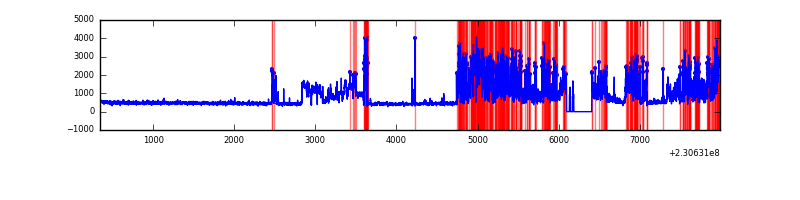 |
| B | 7648 | 7367 | 74 | 74 | 0.97% | 1.00% | 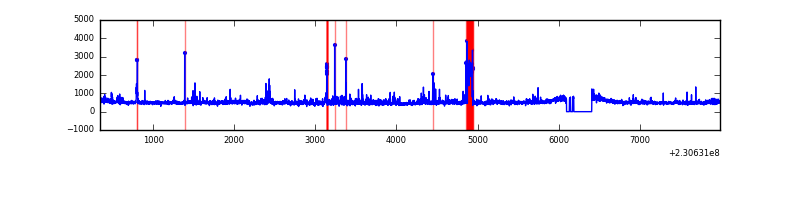 |
| C | 7648 | 7369 | 0 | 0 | 0.00% | 0.00% | 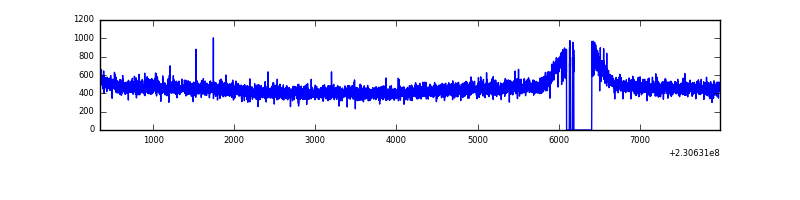 |
| D | 7648 | 7369 | 37 | 37 | 0.48% | 0.50% | 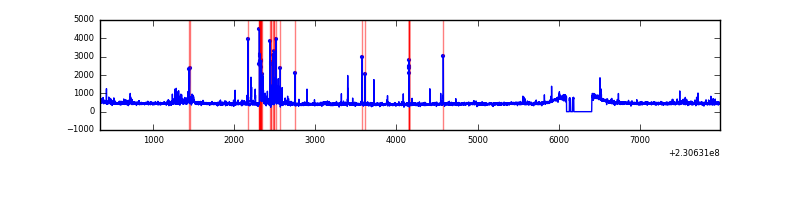 |
Top three noisy pixels from each quadrant. If the there are fewer than three noisy pixels in the level2.evt file, extra rows are filled as -1
| Pixel properties | Quadrant properties | ||||||
|---|---|---|---|---|---|---|---|
| Quadrant | DetID | PixID | Counts | Sigma | Mean | Median | Sigma |
| A | 5 | 16 | 2448714 | 14155.56 | 847 | 829 | 172.9 |
| A | 15 | 236 | 577875 | 3336.93 | 847 | 829 | 172.9 |
| A | 13 | 248 | 34636 | 195.5 | 847 | 829 | 172.9 |
| B | 4 | 81 | 211775 | 1231.89 | 884 | 861 | 171.2 |
| B | 11 | 51 | 126373 | 733.08 | 884 | 861 | 171.2 |
| B | 5 | 255 | 82115 | 474.58 | 884 | 861 | 171.2 |
| C | 13 | 61 | 6360 | 27.35 | 862 | 864 | 200.9 |
| C | 8 | 222 | 4715 | 19.17 | 862 | 864 | 200.9 |
| C | 3 | 202 | 2138 | 6.34 | 862 | 864 | 200.9 |
| D | 7 | 71 | 130541 | 599.8 | 858 | 834 | 216.2 |
| D | 12 | 233 | 76837 | 351.46 | 858 | 834 | 216.2 |
| D | 2 | 152 | 57345 | 261.32 | 858 | 834 | 216.2 |
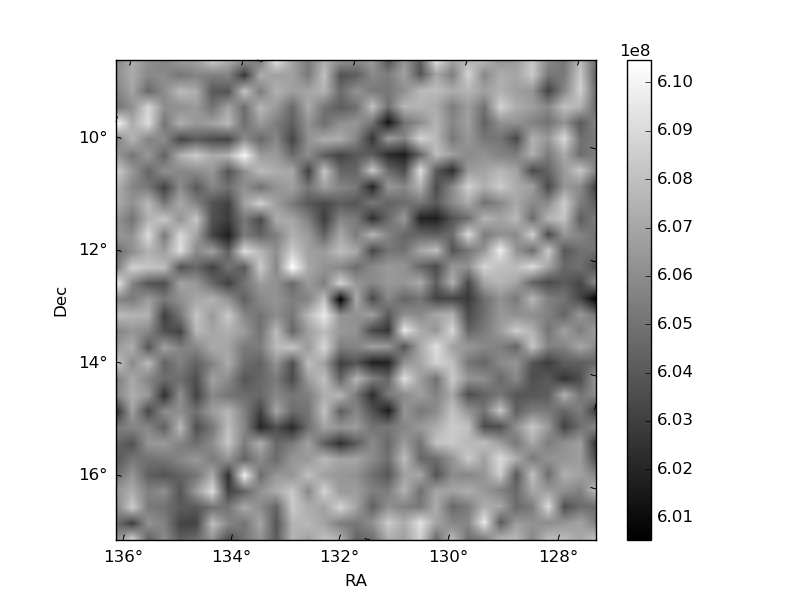
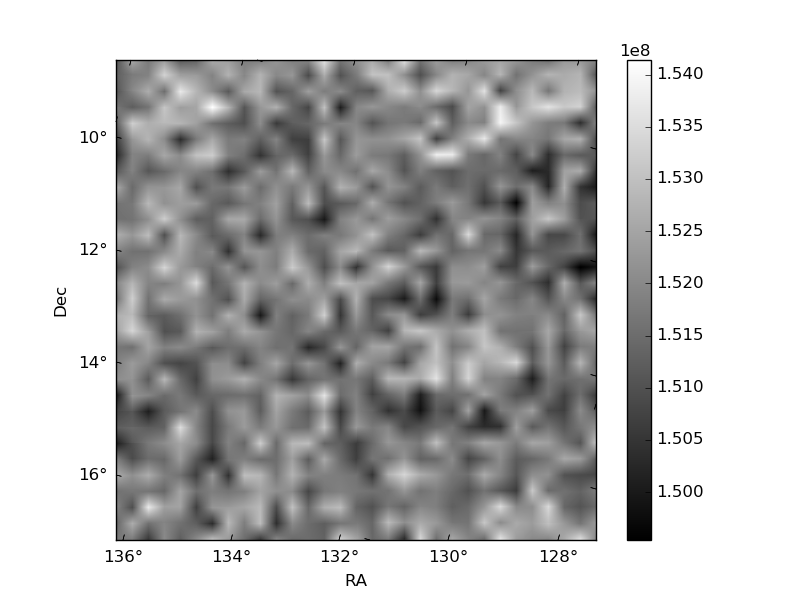
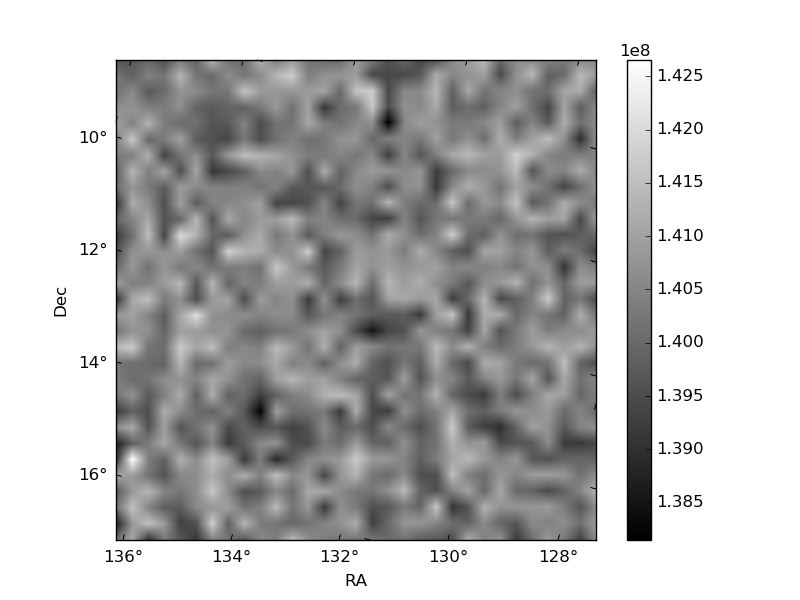
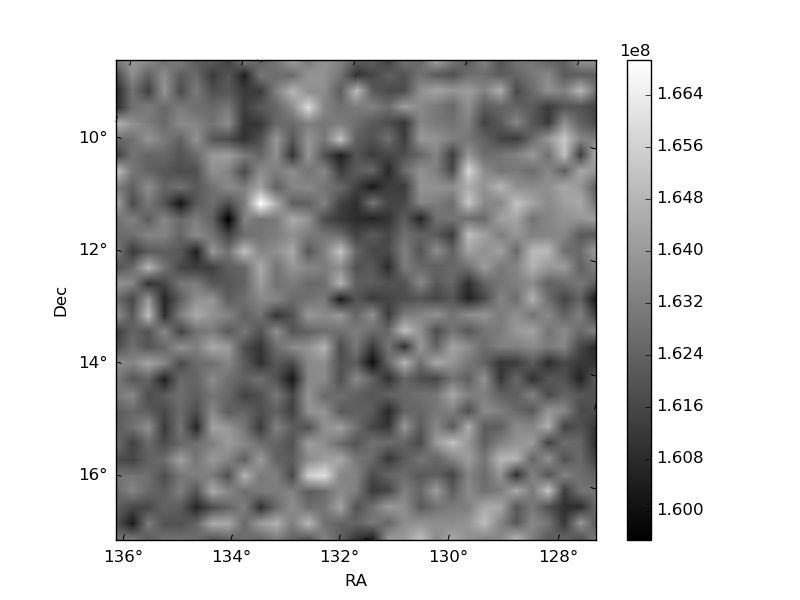
Histogram calculated using DETX and DETY for each event in the final _common_clean file
| Quadrant A | 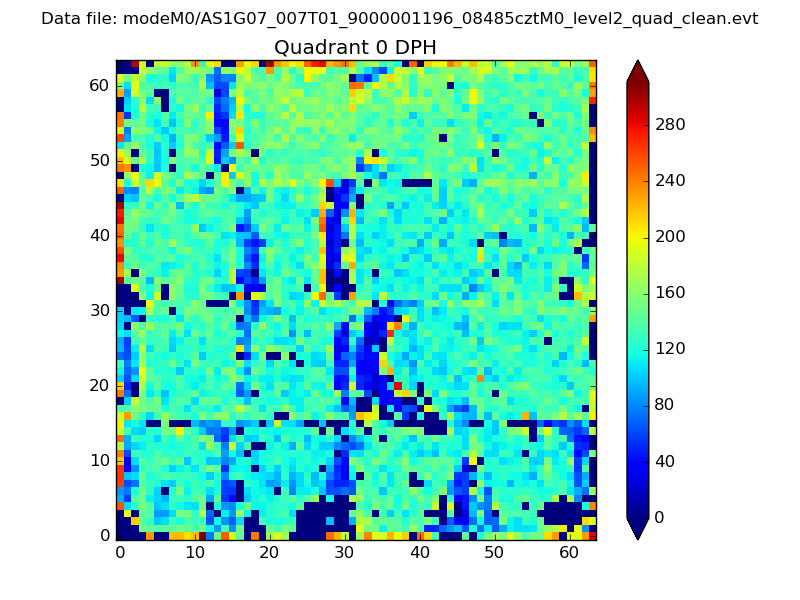 |
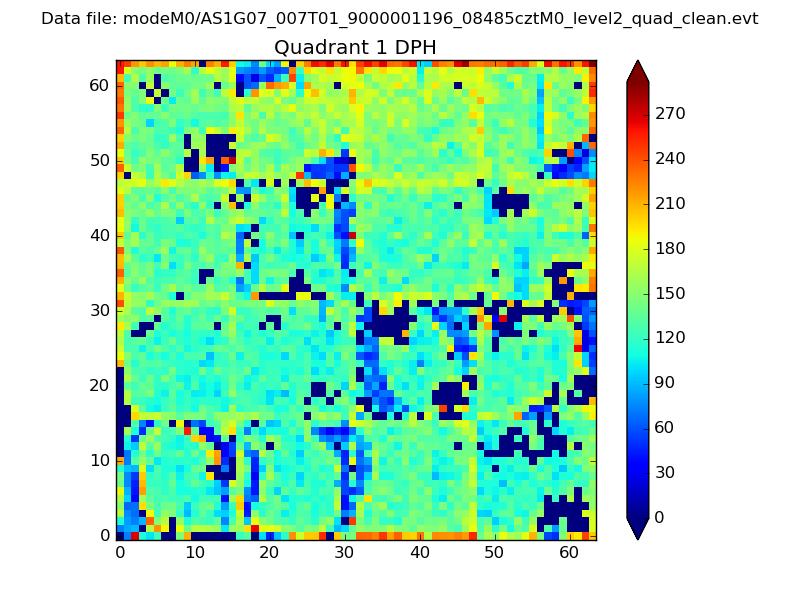 |
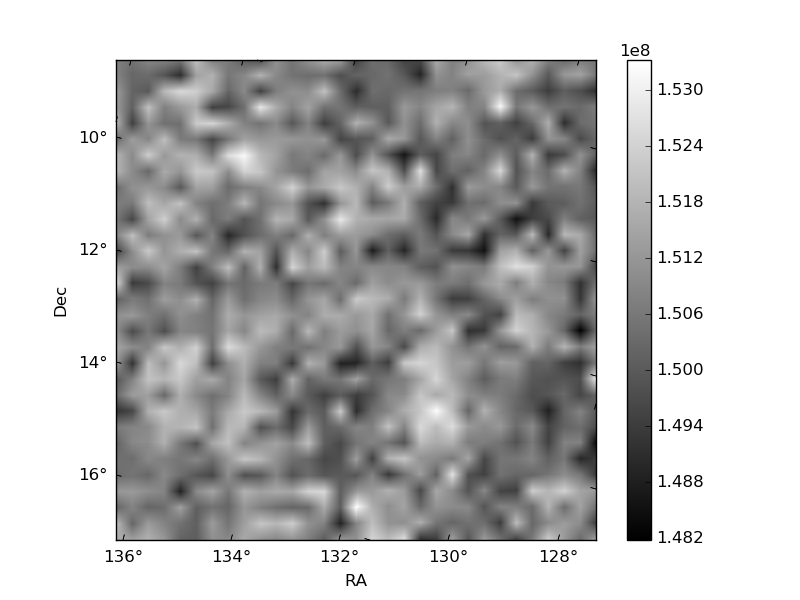
Quadrant B |
|---|---|---|---|
| Quadrant D | 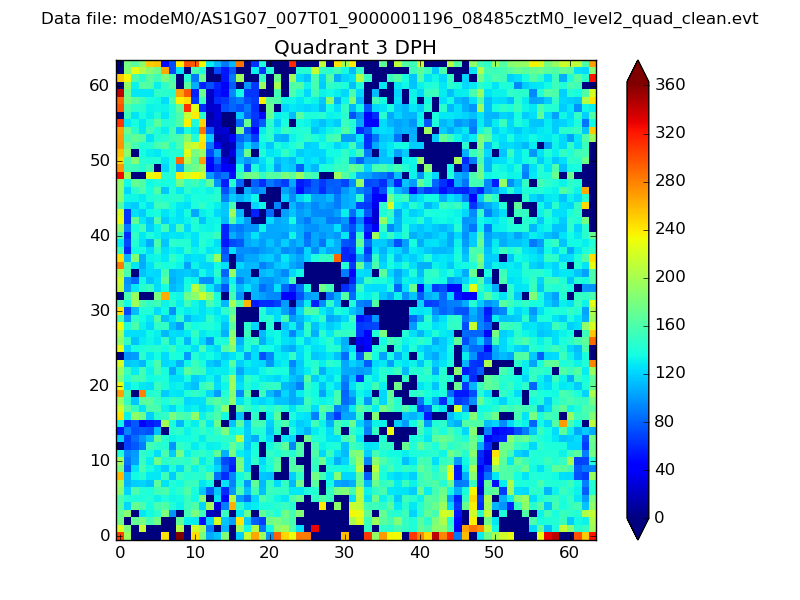 |
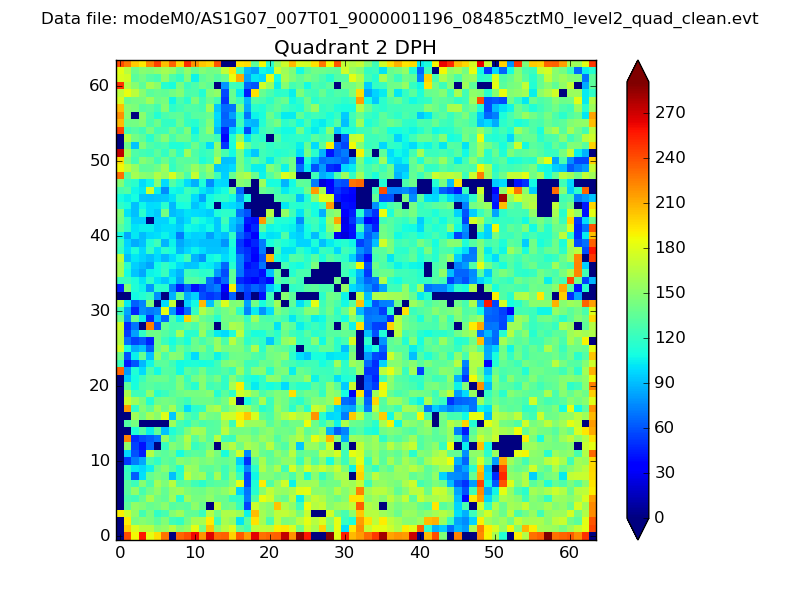 |
Quadrant C |
| Plot type | Count rate plots | Images |
|---|---|---|
| Comparison with Poisson distribution Blue bars denote a histogram of data divided into 1 sec bins. Red curve is a Poisson curve with rate = median count rate of data. |
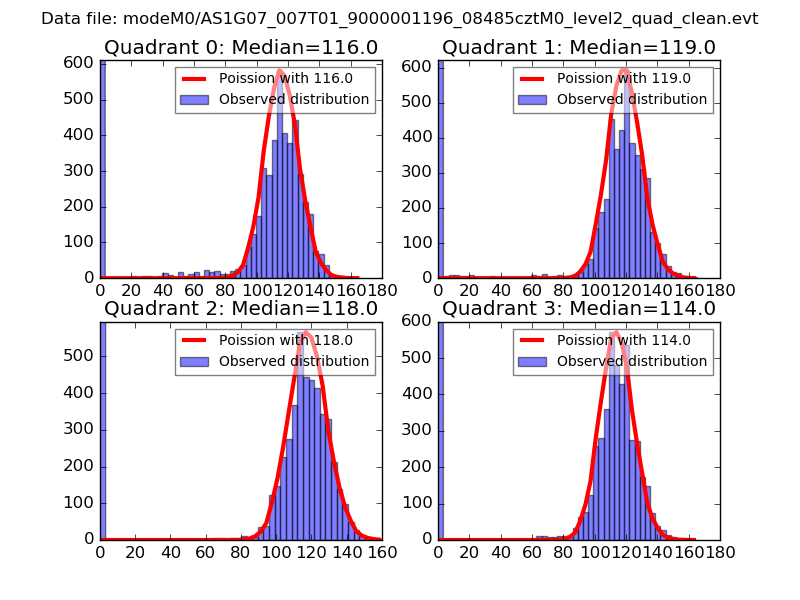 |
 |
| Quadrant-wise count rates Data is divided into 100 sec bins |
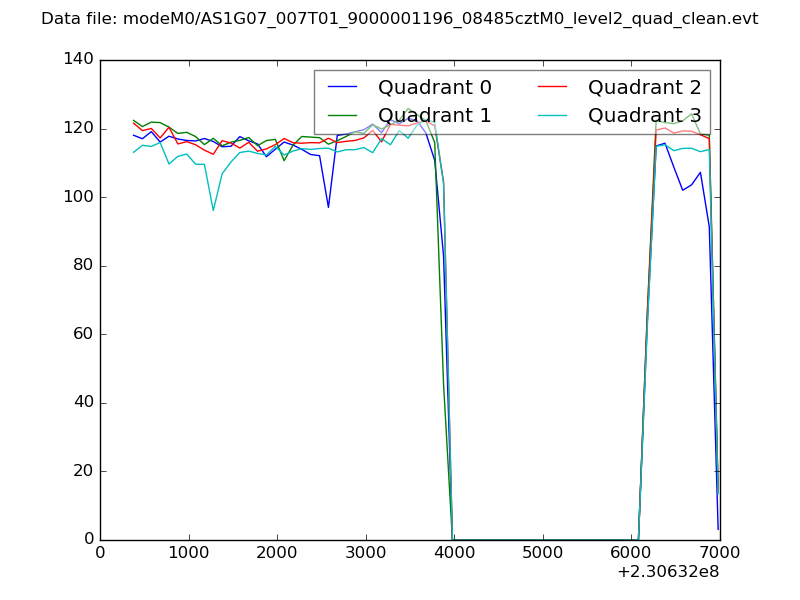 |
|
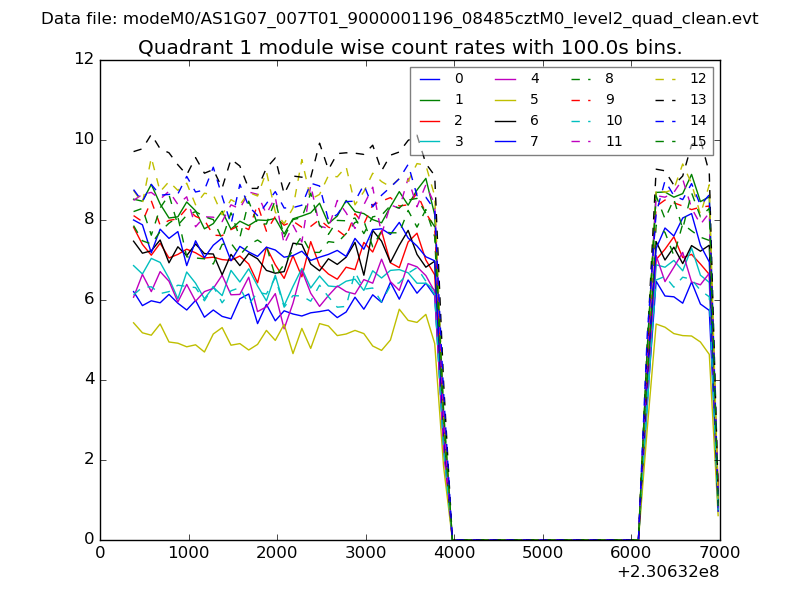
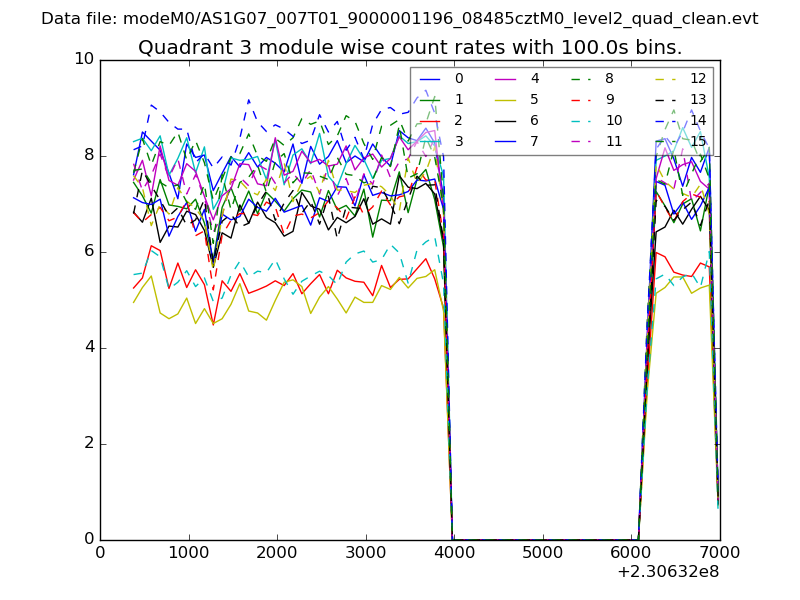
| Module-wise count rates for Quadrant A Data is divided into 100 sec bins |
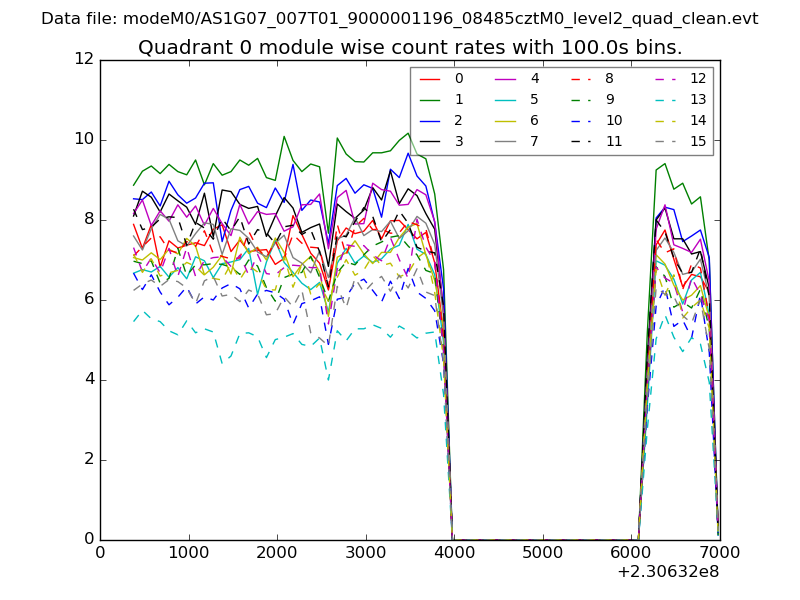 |
 |
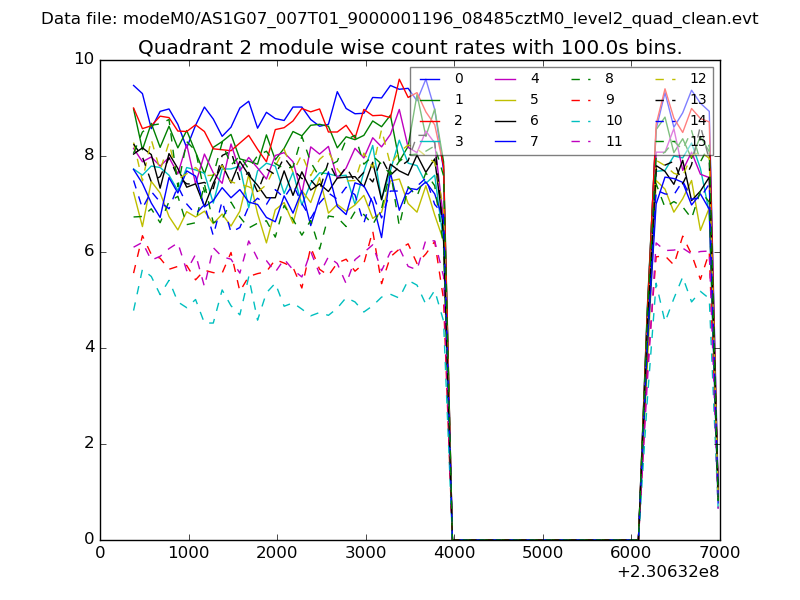
| Module-wise count rates for Quadrant B Data is divided into 100 sec bins |
 |
 |
| Module-wise count rates for Quadrant C Data is divided into 100 sec bins |
 |
 |
| Module-wise count rates for Quadrant D Data is divided into 100 sec bins |
 |
 |
| Parameter | Plot |
|---|---|
| CZT HV Monitor | 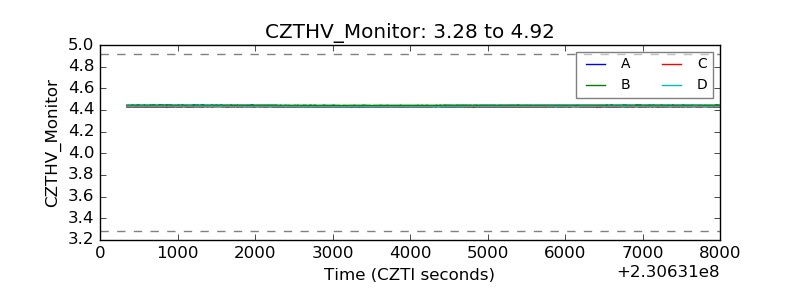 |
| D_VDD | 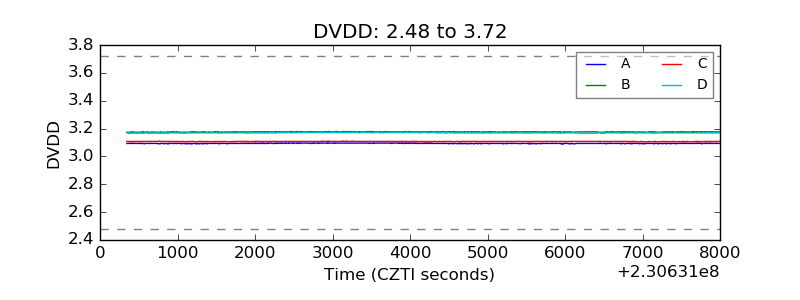 |
| Temperature 1 | 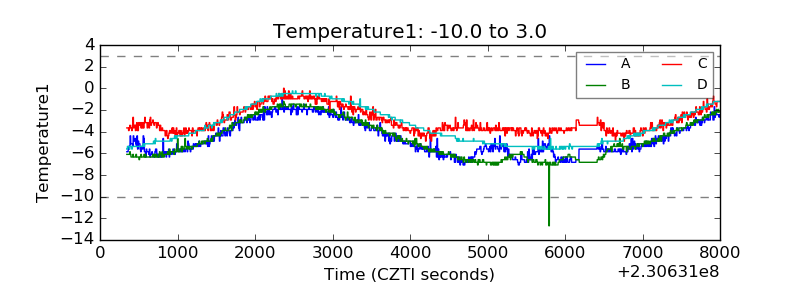 |
| Veto HV Monitor | 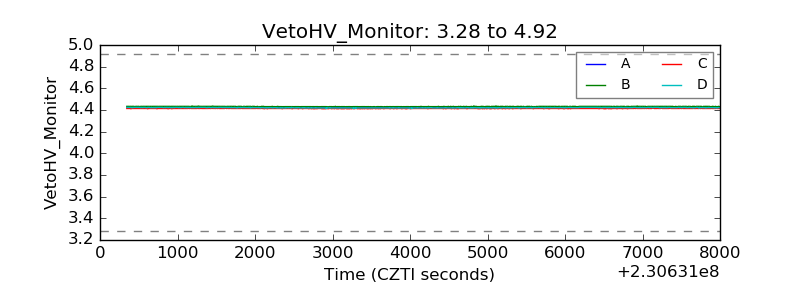 |
| Veto LLD | 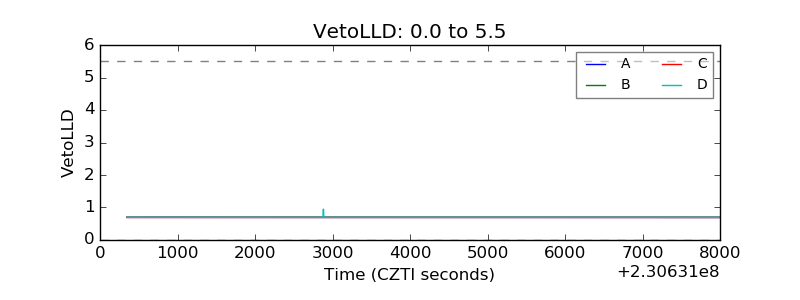 |
| Alpha Counter | 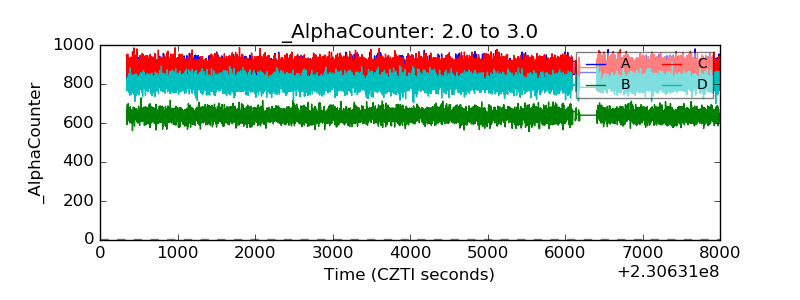 |
| _CPM_Rate | 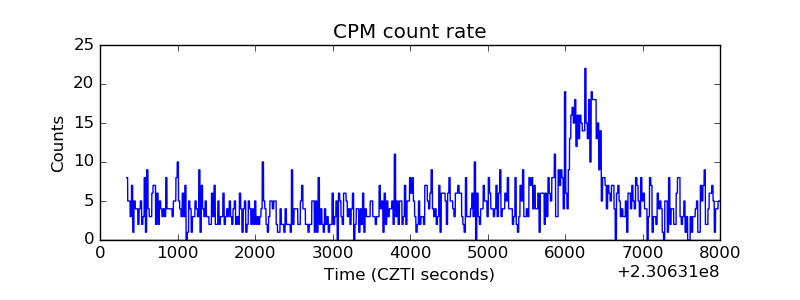 |
| CZT Counter | 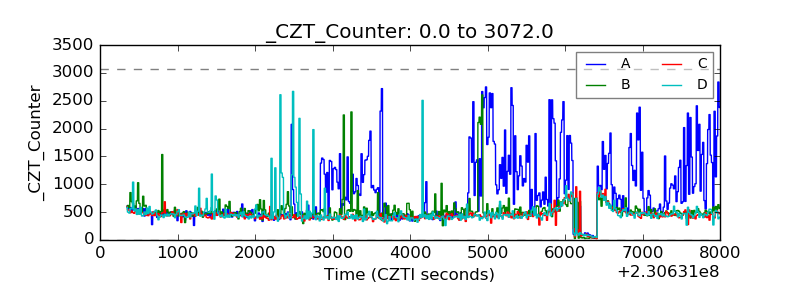 |
| +2.5 Volts monitor | 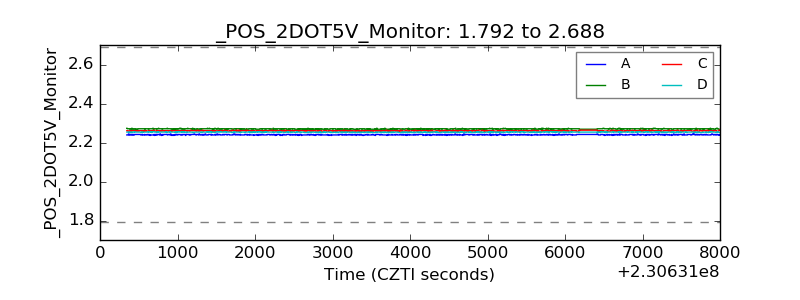 |
| +5 Volts monitor |  |
| _ROLL_ROT | 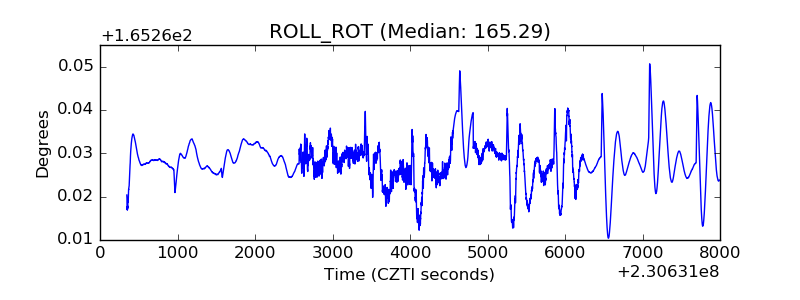 |
| _Roll_DEC | 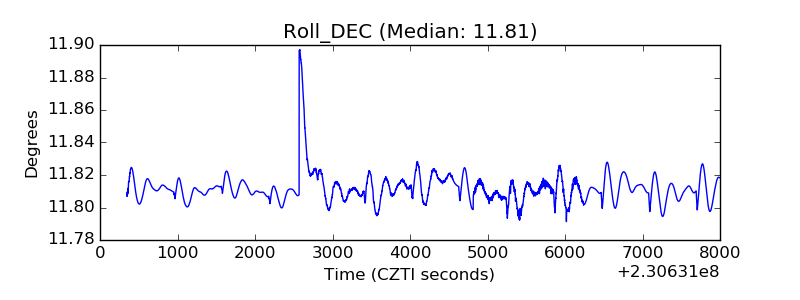 |
| _Roll_RA | 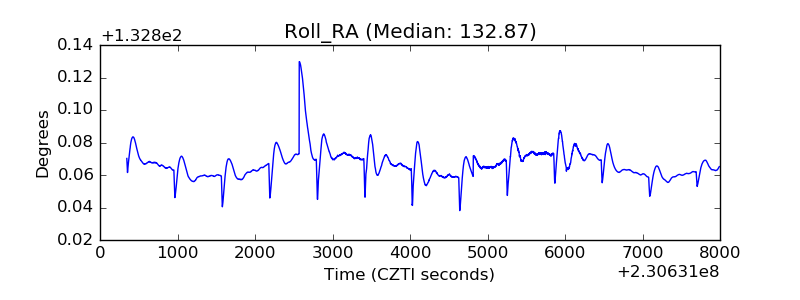 |
| Veto Counter | 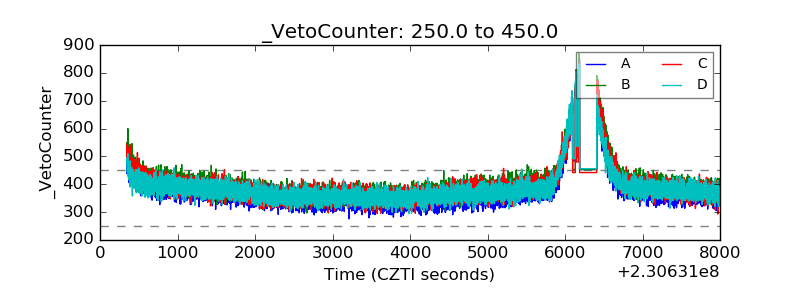 |