| Param | Original file | Final file |
|---|---|---|
| Filename | modeM0/AS1G07_007T01_9000001196_08486cztM0_level2.evt | modeM0/AS1G07_007T01_9000001196_08486cztM0_level2_quad_clean.evt |
| Size (bytes) | 608,889,600 | 94,668,480 |
| Size | 580.7 MB | 90.3 MB |
| Events in quadrant A | 5,501,836 | 575,317 |
| Events in quadrant B | 4,257,784 | 593,770 |
| Events in quadrant C | 3,589,294 | 586,278 |
| Events in quadrant D | 4,558,022 | 564,690 |
| Mode SS | |||
|---|---|---|---|
| Quadrant | BADHDUFLAG | Total packets | Discarded packets |
| A | 0 | 158 | 0 |
| B | 0 | 158 | 0 |
| C | 0 | 158 | 0 |
| D | 0 | 158 | 0 |
| Mode M0 | |||
|---|---|---|---|
| Quadrant | BADHDUFLAG | Total packets | Discarded packets |
| A | 0 | 21695 | 1 |
| B | 0 | 17576 | 0 |
| C | 0 | 16218 | 0 |
| D | 0 | 19111 | 0 |
| Quadrant | Total seconds | Saturated seconds | Saturation percentage |
|---|---|---|---|
| A | 7861 | 658 | 8.370436% |
| B | 7861 | 207 | 2.633253% |
| C | 7861 | 71 | 0.903193% |
| D | 7861 | 399 | 5.075690% |
Noise dominated data is calculated using 1-second bins in cleaned event files. If a bin has >2000 counts, and if more than 50% of those come from <1% of pixels, then it is considered to be noise-dominated and hence unusable.
| Quadrant | # 1 sec bins | Bins with >0 counts | Bins with >2000 counts | High rate bins dominated by noise | Noise dominated (total time) | Noise dominated (detector-on time) | Marked lightcurve |
|---|---|---|---|---|---|---|---|
| A | 7861 | 7861 | 356 | 356 | 4.53% | 4.53% | 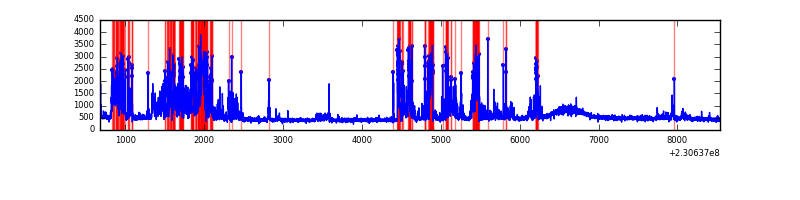 |
| B | 7861 | 7861 | 20 | 20 | 0.25% | 0.25% | 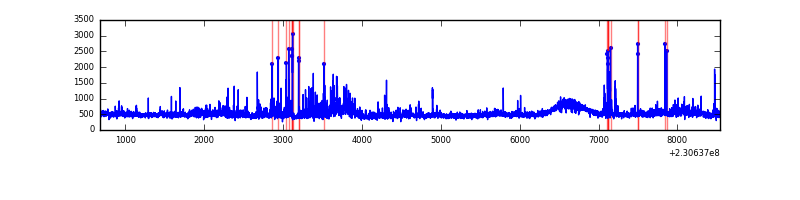 |
| C | 7861 | 7861 | 0 | 0 | 0.00% | 0.00% | 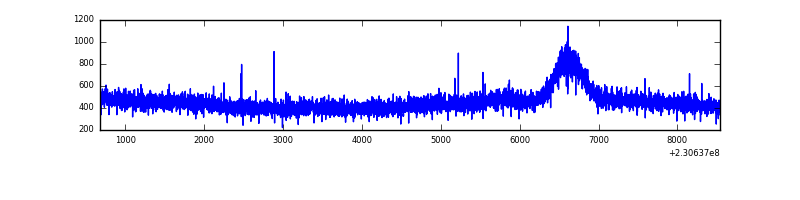 |
| D | 7861 | 7861 | 102 | 102 | 1.30% | 1.30% | 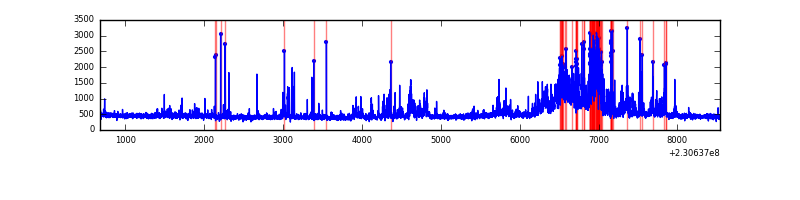 |
Top three noisy pixels from each quadrant. If the there are fewer than three noisy pixels in the level2.evt file, extra rows are filled as -1
| Pixel properties | Quadrant properties | ||||||
|---|---|---|---|---|---|---|---|
| Quadrant | DetID | PixID | Counts | Sigma | Mean | Median | Sigma |
| A | 5 | 16 | 1844574 | 9576.51 | 934 | 912 | 192.5 |
| A | 15 | 236 | 41969 | 213.26 | 934 | 912 | 192.5 |
| A | 15 | 174 | 21347 | 106.15 | 934 | 912 | 192.5 |
| B | 4 | 48 | 182525 | 982.91 | 949 | 923 | 184.8 |
| B | 0 | 214 | 156698 | 843.12 | 949 | 923 | 184.8 |
| B | 11 | 51 | 102984 | 552.4 | 949 | 923 | 184.8 |
| C | 13 | 61 | 6943 | 28.08 | 919 | 921 | 214.5 |
| C | 8 | 222 | 6262 | 24.9 | 919 | 921 | 214.5 |
| C | 3 | 202 | 2291 | 6.39 | 919 | 921 | 214.5 |
| D | 12 | 233 | 944118 | 3865.86 | 903 | 880 | 244.0 |
| D | 1 | 52 | 64235 | 259.66 | 903 | 880 | 244.0 |
| D | 7 | 71 | 47848 | 192.5 | 903 | 880 | 244.0 |
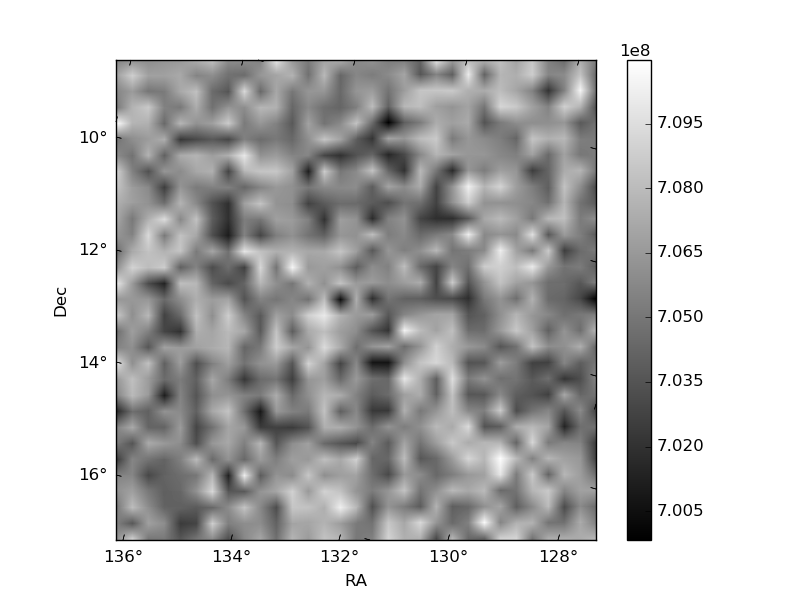
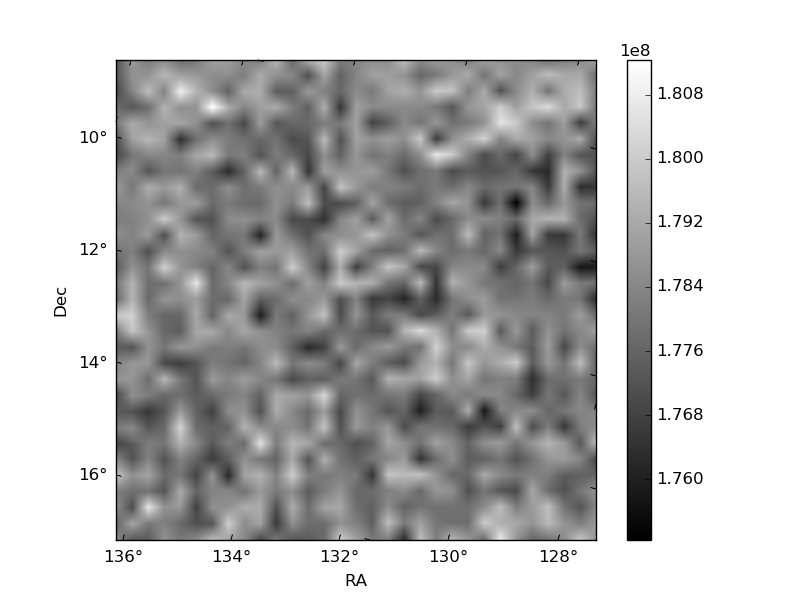
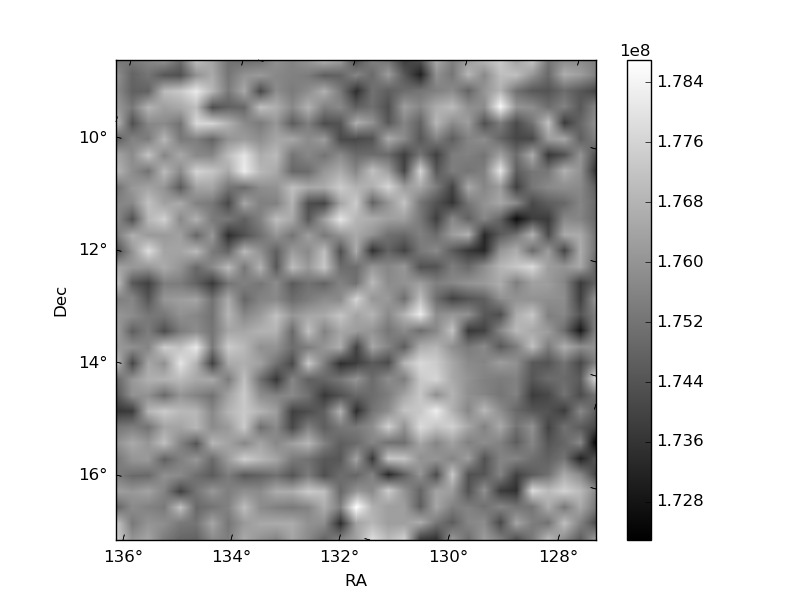
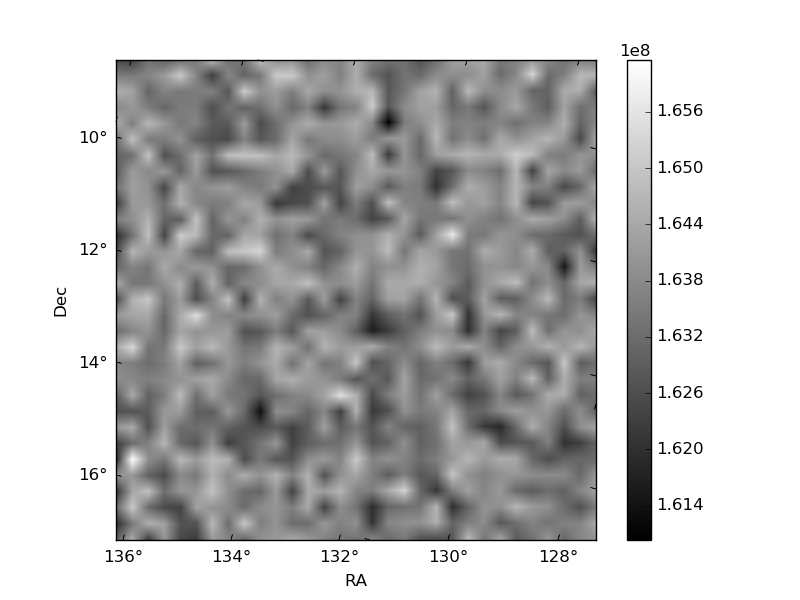
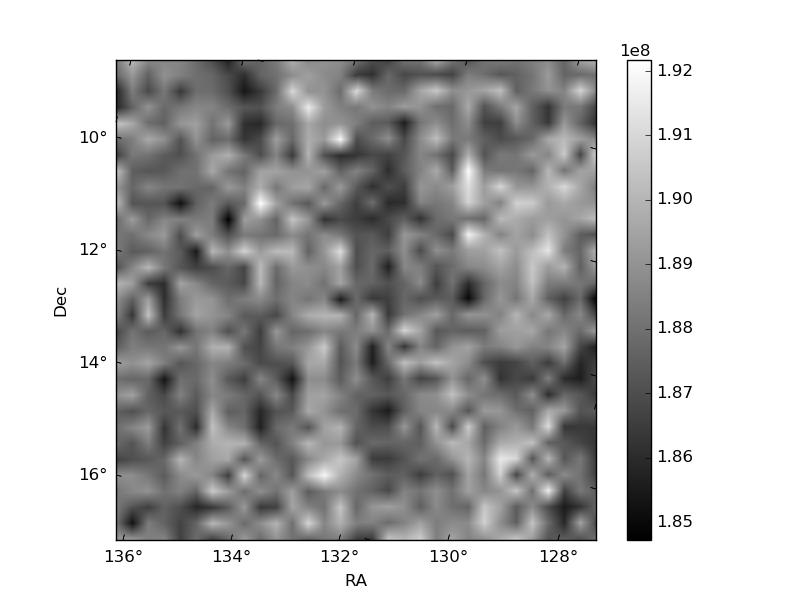
Histogram calculated using DETX and DETY for each event in the final _common_clean file
| Quadrant A | 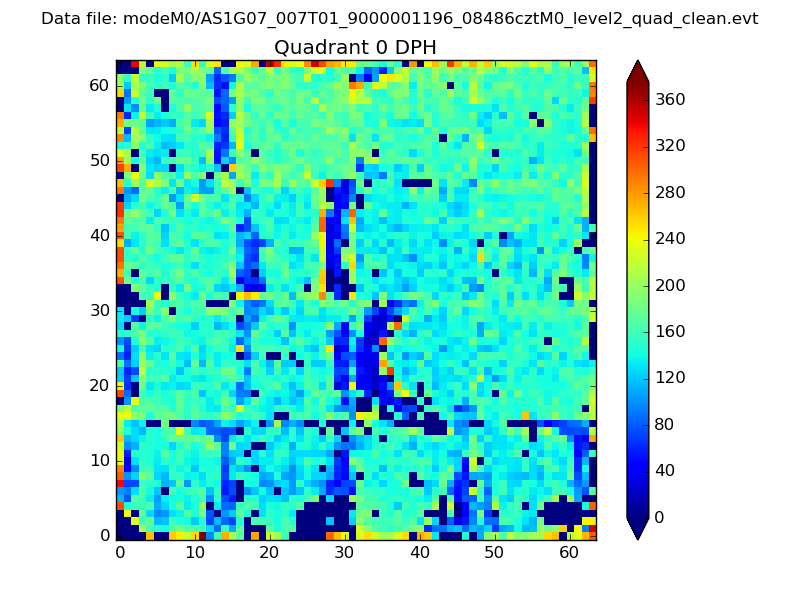 |
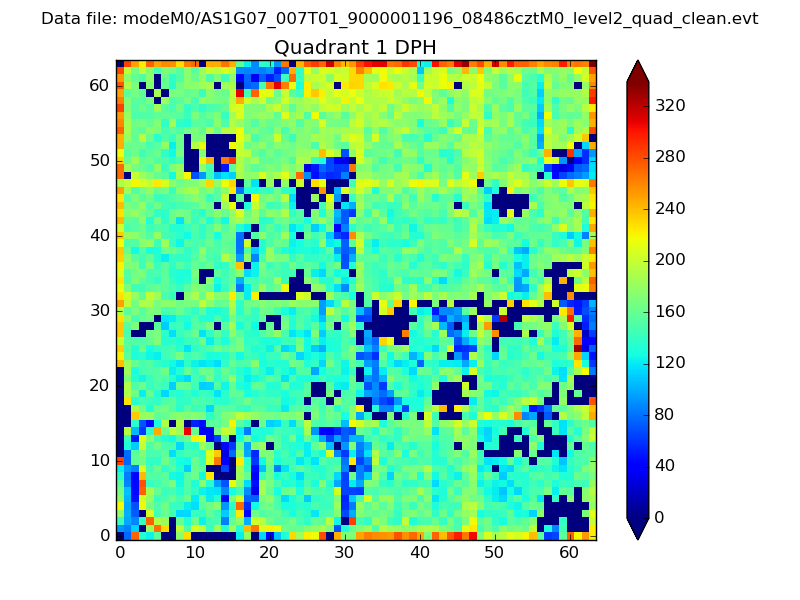 |
Quadrant B |
|---|---|---|---|
| Quadrant D | 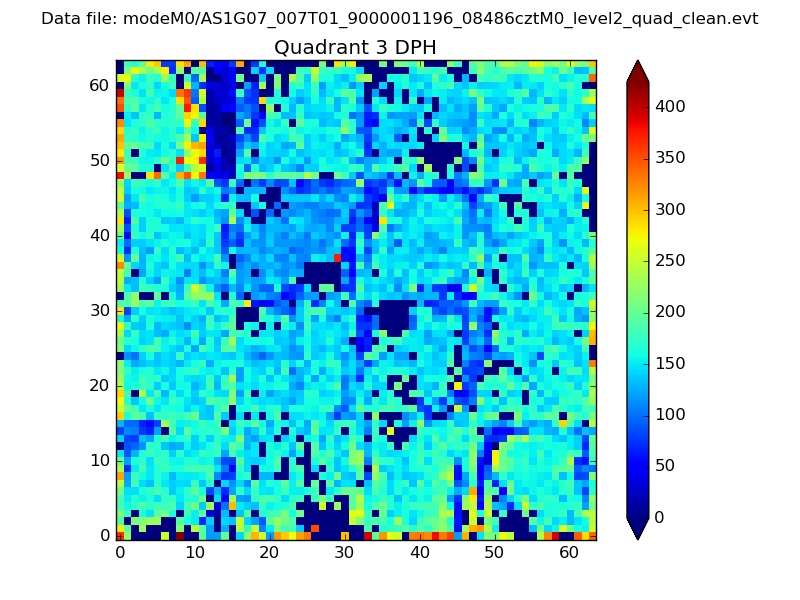 |
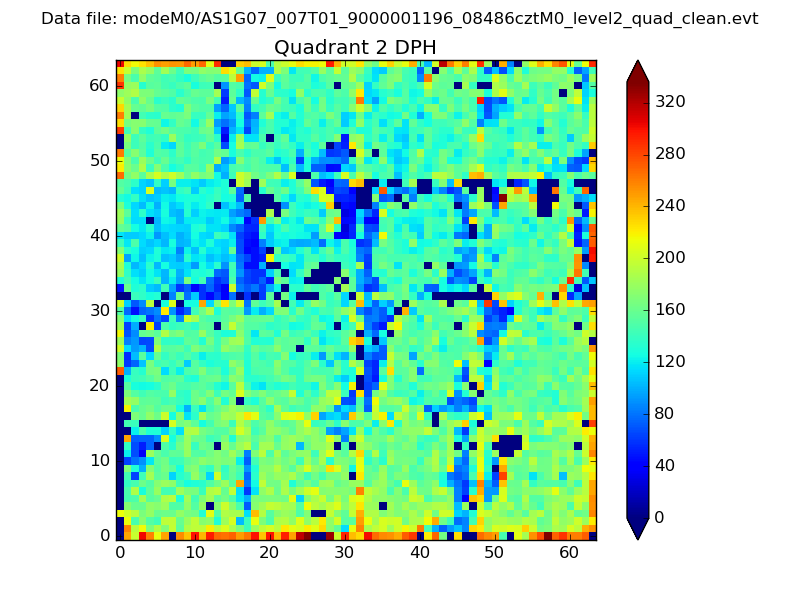 |
Quadrant C |
| Plot type | Count rate plots | Images |
|---|---|---|
| Comparison with Poisson distribution Blue bars denote a histogram of data divided into 1 sec bins. Red curve is a Poisson curve with rate = median count rate of data. |
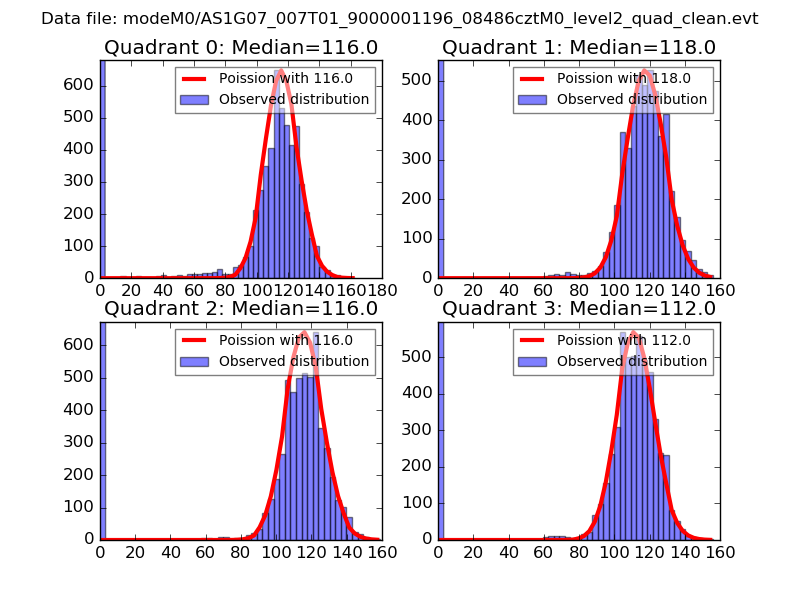 |
 |
| Quadrant-wise count rates Data is divided into 100 sec bins |
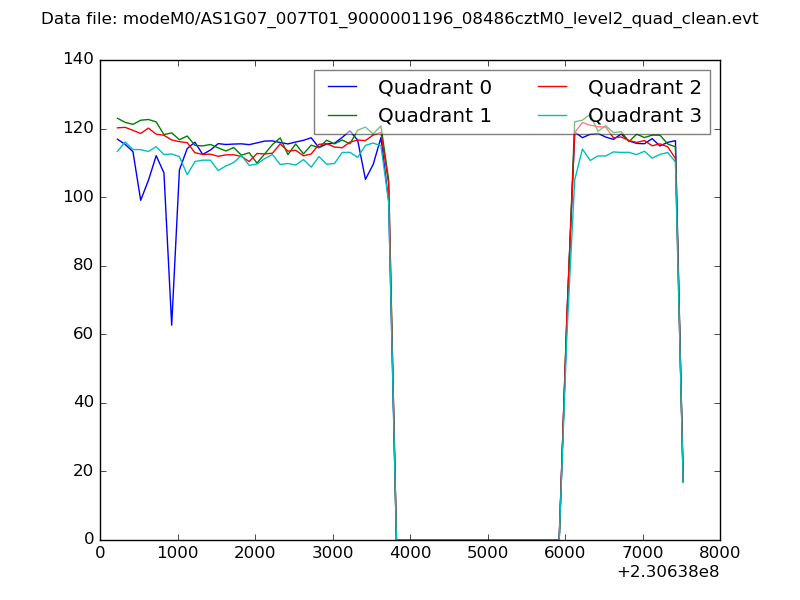 |
|
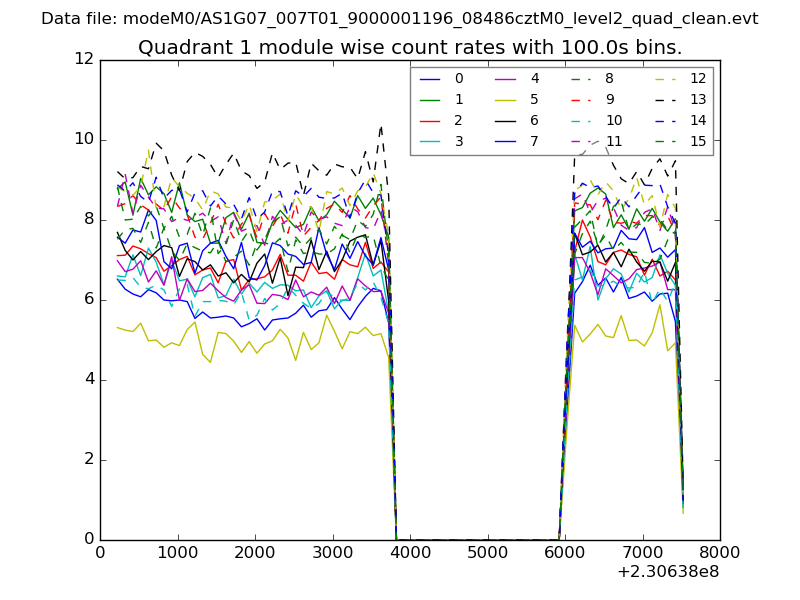
| Module-wise count rates for Quadrant A Data is divided into 100 sec bins |
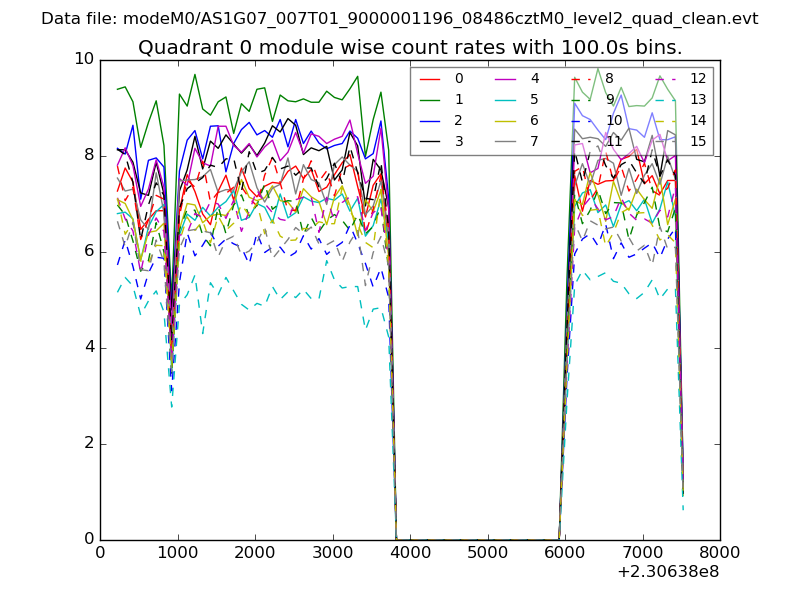 |
 |
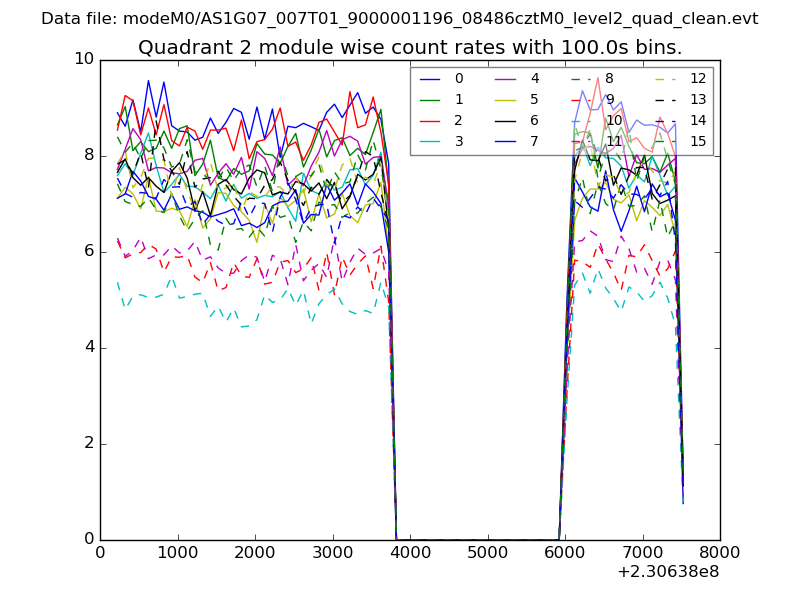
| Module-wise count rates for Quadrant B Data is divided into 100 sec bins |
 |
 |
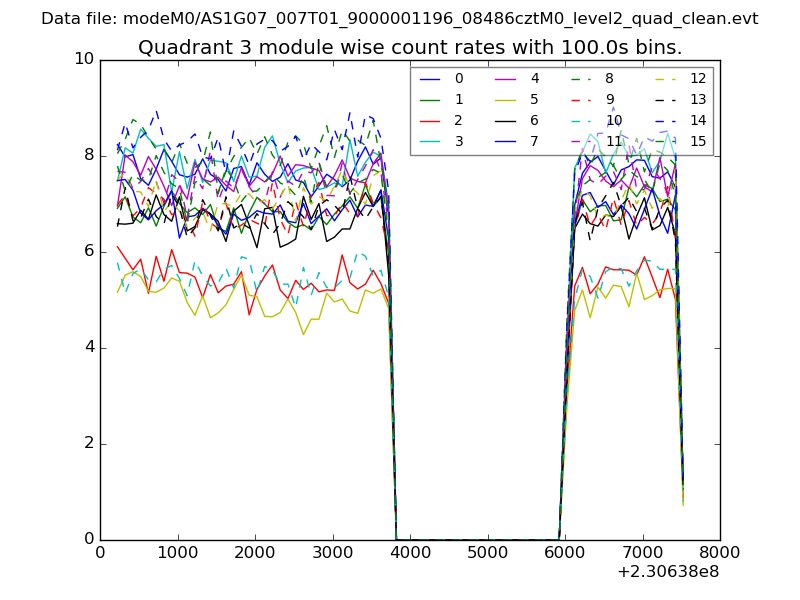
| Module-wise count rates for Quadrant C Data is divided into 100 sec bins |
 |
 |
| Module-wise count rates for Quadrant D Data is divided into 100 sec bins |
 |
 |
| Parameter | Plot |
|---|---|
| CZT HV Monitor |  |
| D_VDD | 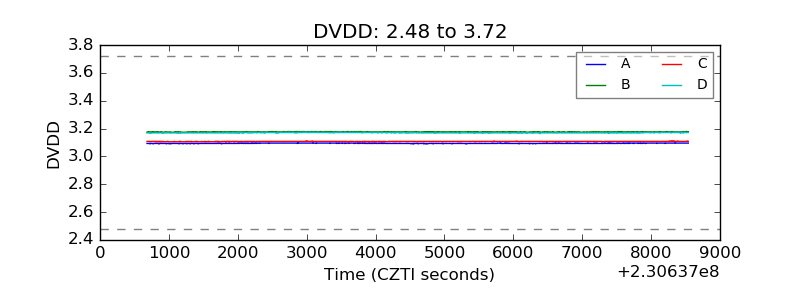 |
| Temperature 1 | 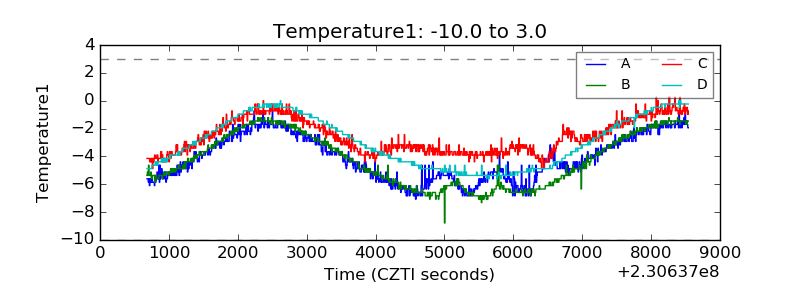 |
| Veto HV Monitor | 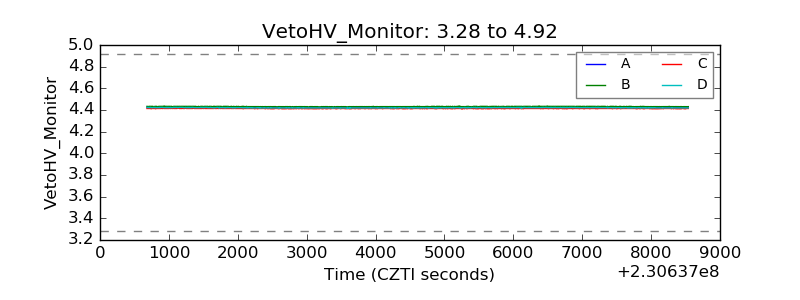 |
| Veto LLD |  |
| Alpha Counter | 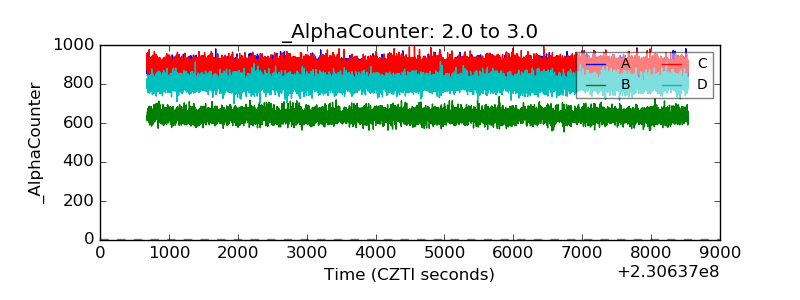 |
| _CPM_Rate | 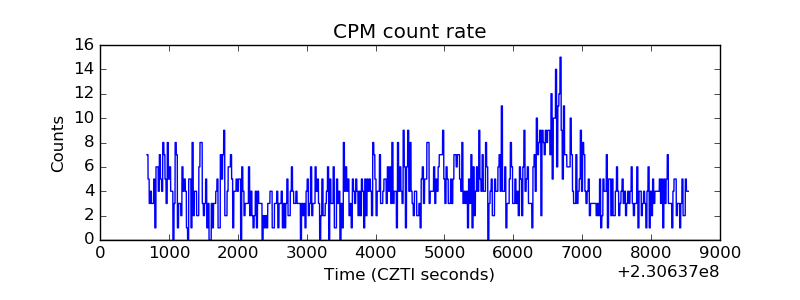 |
| CZT Counter | 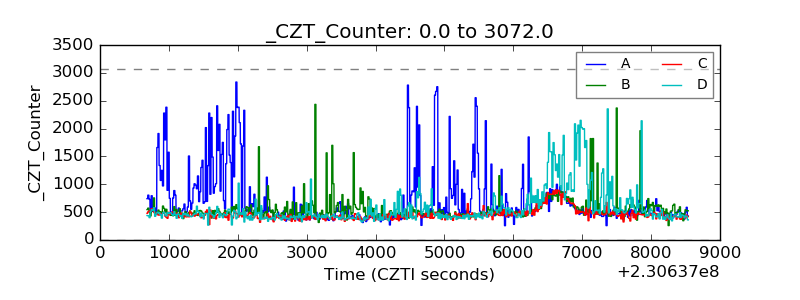 |
| +2.5 Volts monitor |  |
| +5 Volts monitor |  |
| _ROLL_ROT | 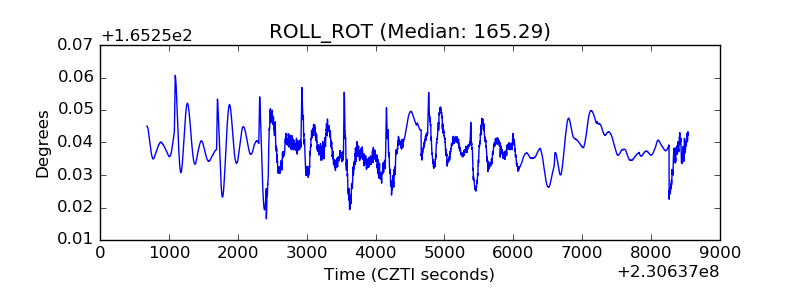 |
| _Roll_DEC | 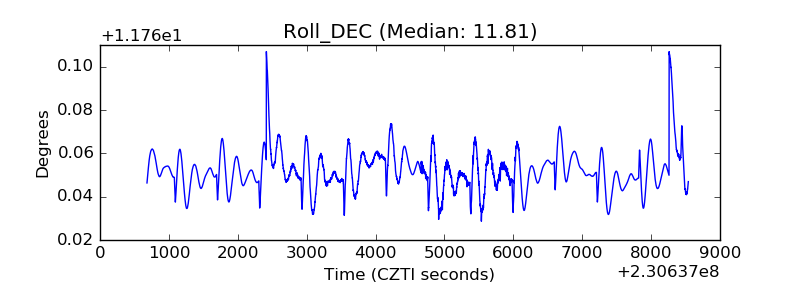 |
| _Roll_RA | 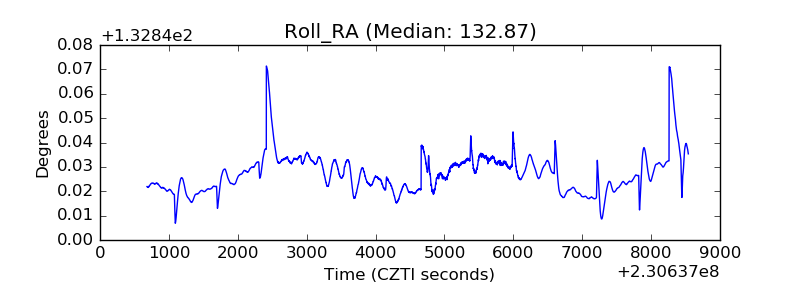 |
| Veto Counter | 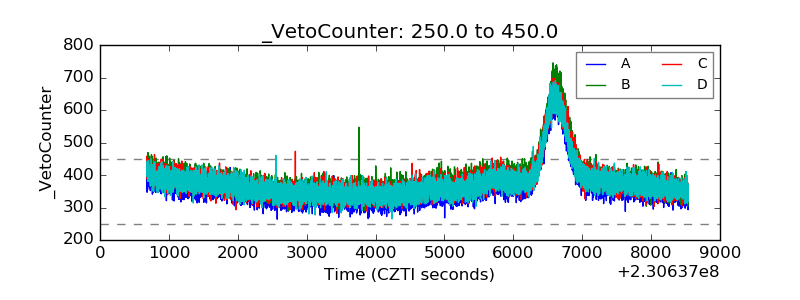 |