| Param | Original file | Final file |
|---|---|---|
| Filename | modeM0/AS1C02_033T02_9000001198cztM0_level2.fits | modeM0/AS1C02_033T02_9000001198cztM0_level2_quad_clean.evt |
| Size (bytes) | 211,014,720 | 173,174,400 |
| Size | 201.2 MB | 165.2 MB |
| Events in quadrant A | 1,267,650 | 958,896 |
| Events in quadrant B | 1,218,262 | 949,910 |
| Events in quadrant C | 1,235,846 | 901,844 |
| Events in quadrant D | 1,078,444 | 842,107 |
| Mode M9 | |||
|---|---|---|---|
| Quadrant | BADHDUFLAG | Total packets | Discarded packets |
| A | 0 | 34 | 0 |
| B | 0 | 34 | 0 |
| C | 0 | 34 | 0 |
| D | 0 | 34 | 0 |
| Mode M0 | |||
|---|---|---|---|
| Quadrant | BADHDUFLAG | Total packets | Discarded packets |
| A | 0 | 47612 | 0 |
| B | 0 | 48468 | 0 |
| C | 0 | 47072 | 0 |
| D | 0 | 49018 | 0 |
| Mode SS | |||
|---|---|---|---|
| Quadrant | BADHDUFLAG | Total packets | Discarded packets |
| A | 0 | 470 | 0 |
| B | 0 | 470 | 0 |
| C | 0 | 470 | 0 |
| D | 0 | 470 | 0 |
| Quadrant | Total seconds | Saturated seconds | Saturation percentage |
|---|---|---|---|
| A | 23114 | 180 | 0.778749% |
| B | 23114 | 192 | 0.830665% |
| C | 23114 | 114 | 0.493208% |
| D | 23113 | 188 | 0.813395% |
Noise dominated data is calculated using 1-second bins in cleaned event files. If a bin has >2000 counts, and if more than 50% of those come from <1% of pixels, then it is considered to be noise-dominated and hence unusable.
| Quadrant | # 1 sec bins | Bins with >0 counts | Bins with >2000 counts | High rate bins dominated by noise | Noise dominated (total time) | Noise dominated (detector-on time) | Marked lightcurve |
|---|---|---|---|---|---|---|---|
| A | 26514 | 23112 | 0 | 0 | 0.00% | 0.00% |  |
| B | 26514 | 23112 | 0 | 0 | 0.00% | 0.00% | 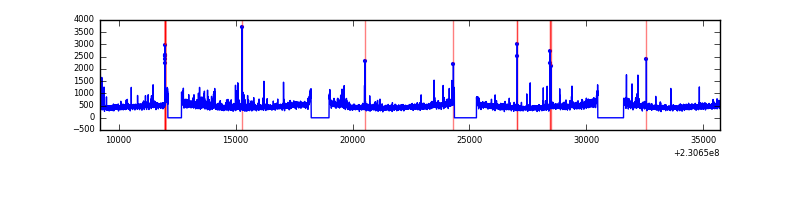 |
| C | 26514 | 23113 | 0 | 0 | 0.00% | 0.00% | 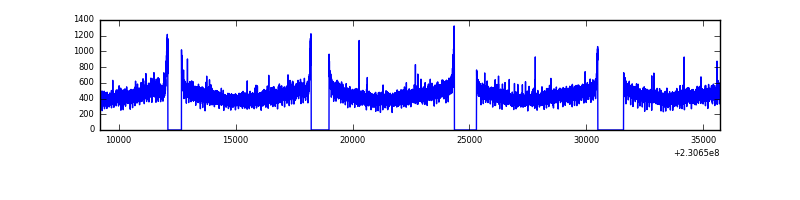 |
| D | 26514 | 23114 | 0 | 0 | 0.00% | 0.00% | 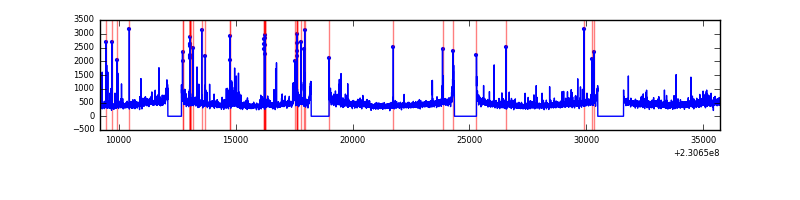 |
Top three noisy pixels from each quadrant. If the there are fewer than three noisy pixels in the level2.evt file, extra rows are filled as -1
| Pixel properties | Quadrant properties | ||||||
|---|---|---|---|---|---|---|---|
| Quadrant | DetID | PixID | Counts | Sigma | Mean | Median | Sigma |
| A | 14 | 188 | 1270 | 11.36 | 328 | 306 | 84.8 |
| A | 0 | 29 | 1219 | 10.76 | 328 | 306 | 84.8 |
| A | 14 | 204 | 1127 | 9.68 | 328 | 306 | 84.8 |
| B | 2 | 9 | 1011 | 10.54 | 321 | 305 | 67.0 |
| B | 3 | 17 | 920 | 9.18 | 321 | 305 | 67.0 |
| B | 14 | 254 | 817 | 7.64 | 321 | 305 | 67.0 |
| C | 12 | 241 | 860 | 6.35 | 326 | 301 | 88.0 |
| C | 3 | 126 | 847 | 6.2 | 326 | 301 | 88.0 |
| C | 7 | 111 | 829 | 6.0 | 326 | 301 | 88.0 |
| D | 7 | 5 | 842 | 6.56 | 307 | 277 | 86.1 |
| D | 3 | 14 | 810 | 6.19 | 307 | 277 | 86.1 |
| D | 6 | 231 | 806 | 6.15 | 307 | 277 | 86.1 |
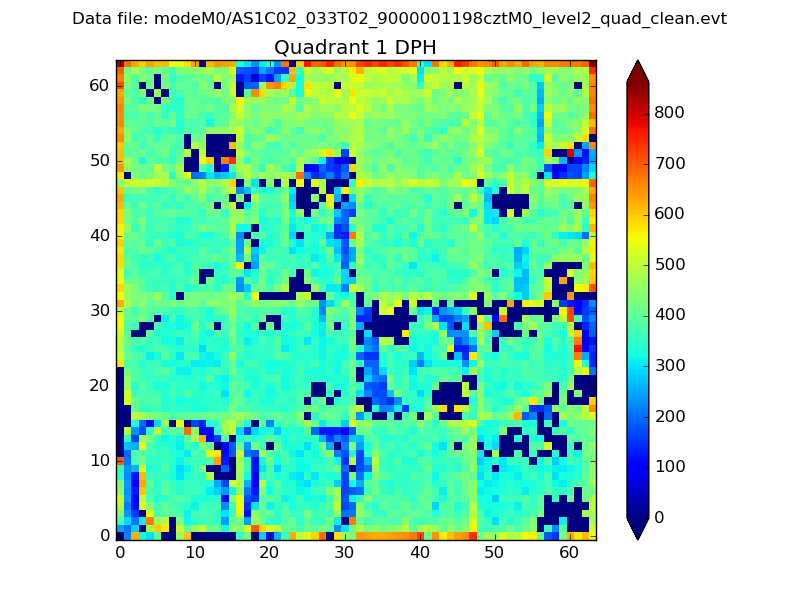
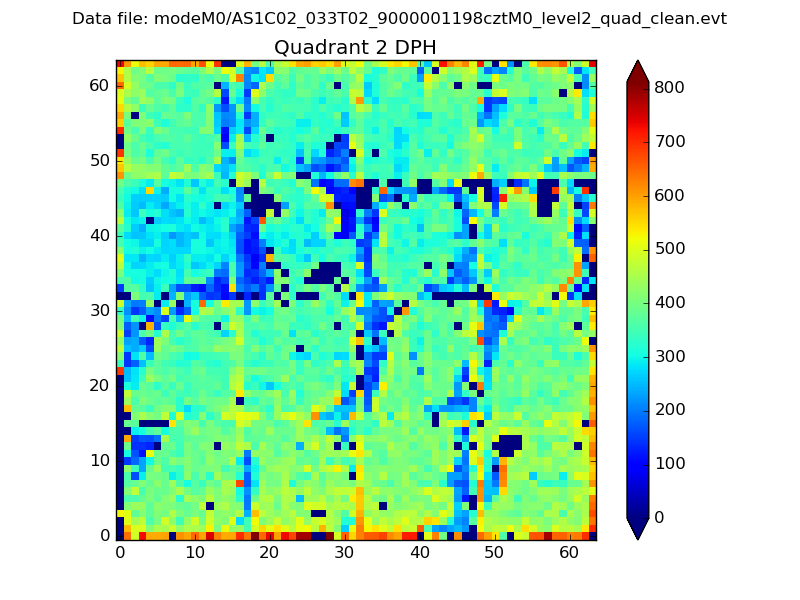
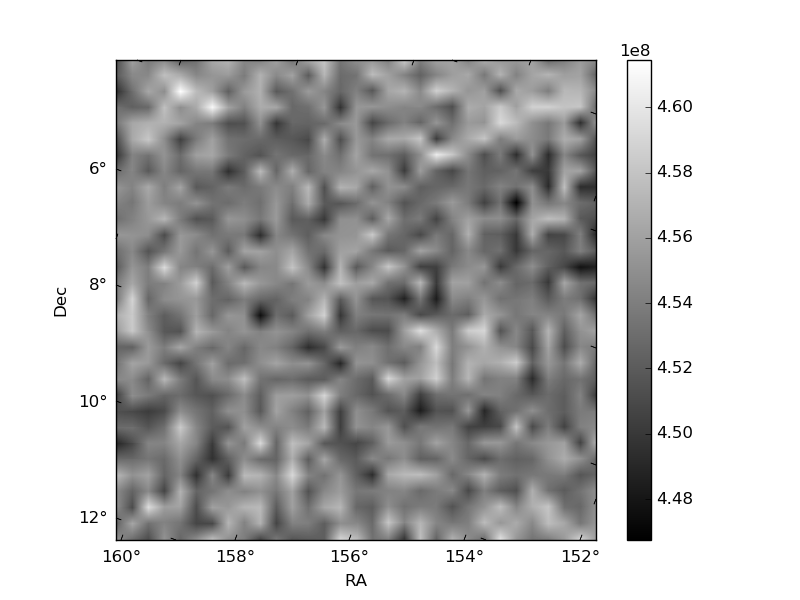
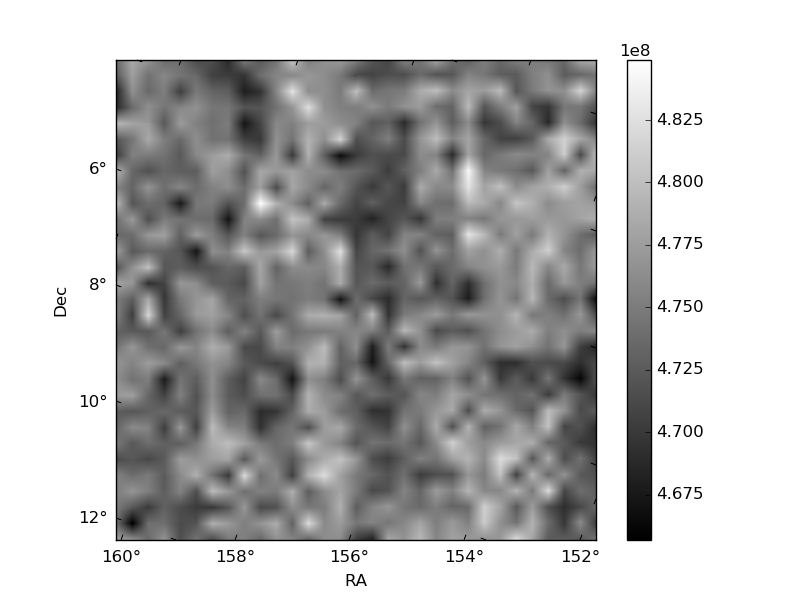
Histogram calculated using DETX and DETY for each event in the final _common_clean file
| Quadrant A | 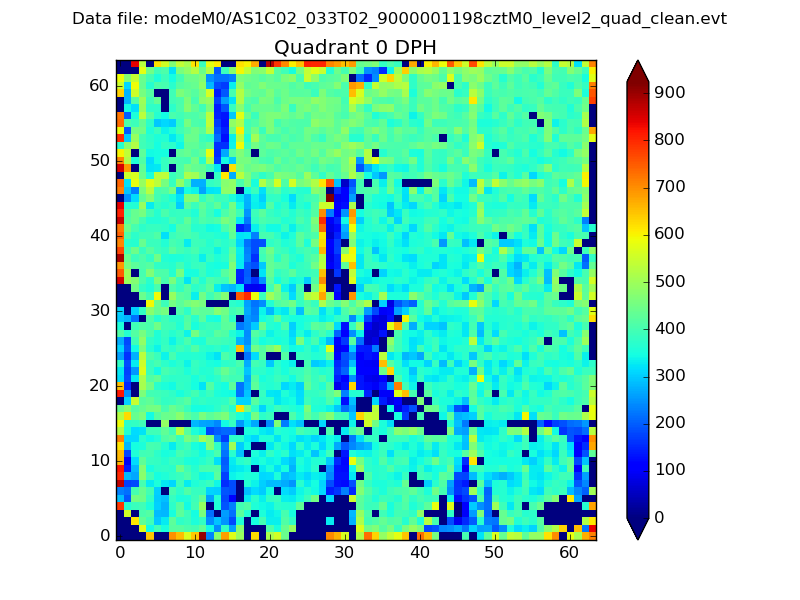 |
 |
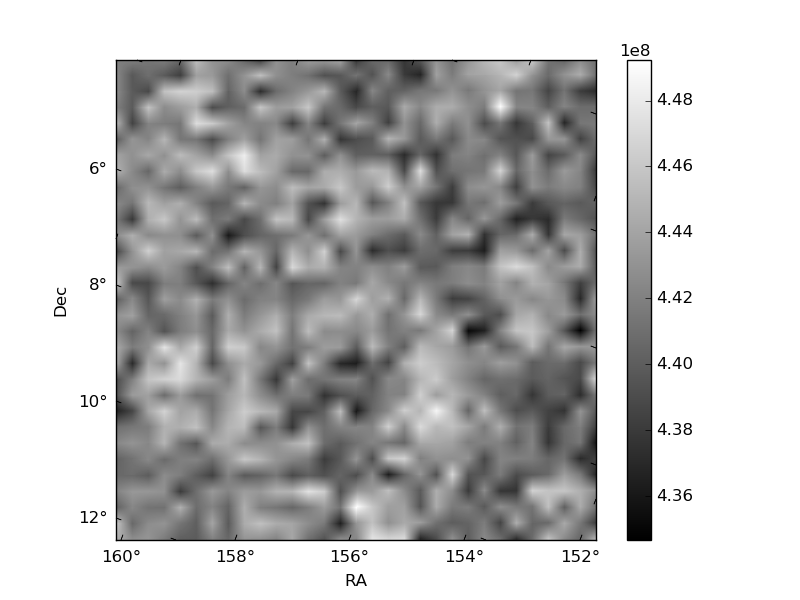
Quadrant B |
|---|---|---|---|
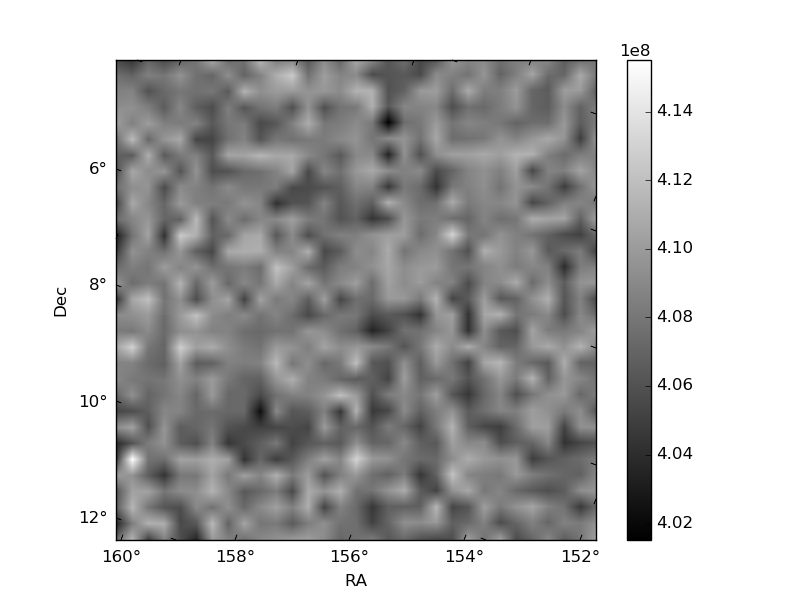
| Quadrant D | 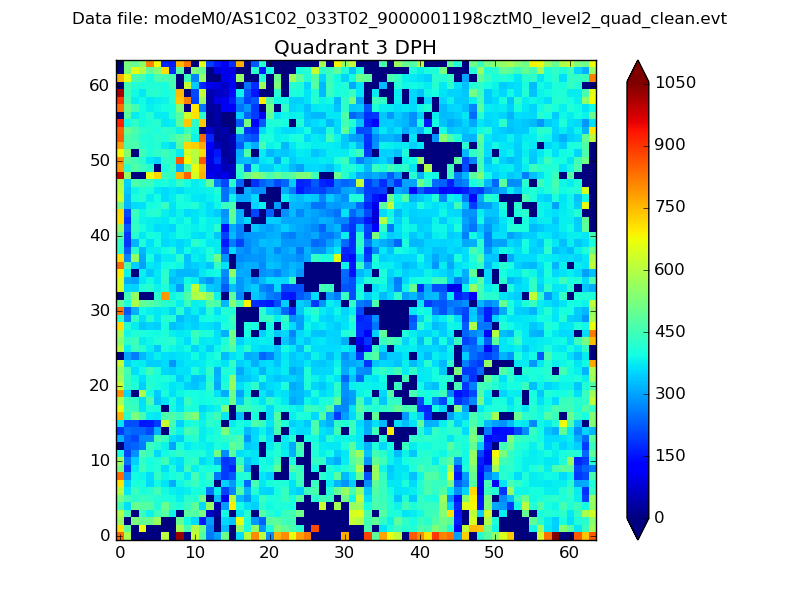 |
 |
Quadrant C |
| Plot type | Count rate plots | Images |
|---|---|---|
| Comparison with Poisson distribution Blue bars denote a histogram of data divided into 1 sec bins. Red curve is a Poisson curve with rate = median count rate of data. |
 |
 |
| Quadrant-wise count rates Data is divided into 100 sec bins |
 |
|
| Module-wise count rates for Quadrant A Data is divided into 100 sec bins |
 |
 |
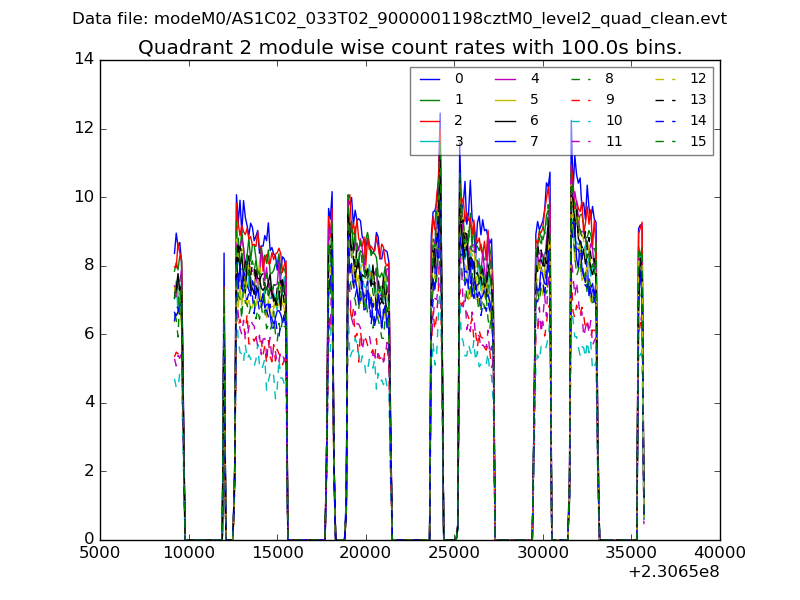
| Module-wise count rates for Quadrant B Data is divided into 100 sec bins |
 |
 |
| Module-wise count rates for Quadrant C Data is divided into 100 sec bins |
 |
 |
| Module-wise count rates for Quadrant D Data is divided into 100 sec bins |
 |
 |
| Parameter | Plot |
|---|---|
| CZT HV Monitor |  |
| D_VDD | 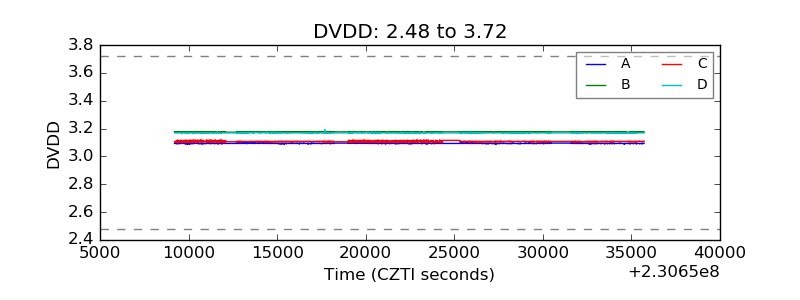 |
| Temperature 1 | 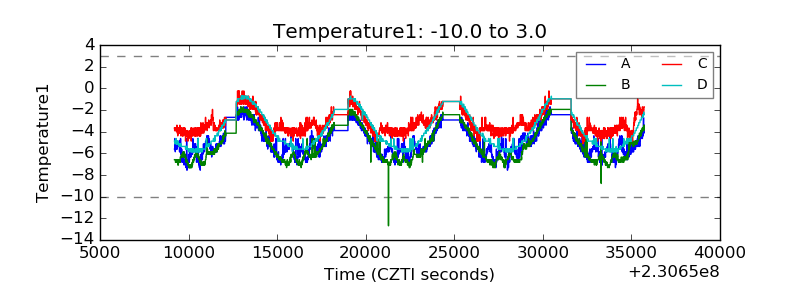 |
| Veto HV Monitor |  |
| Veto LLD | 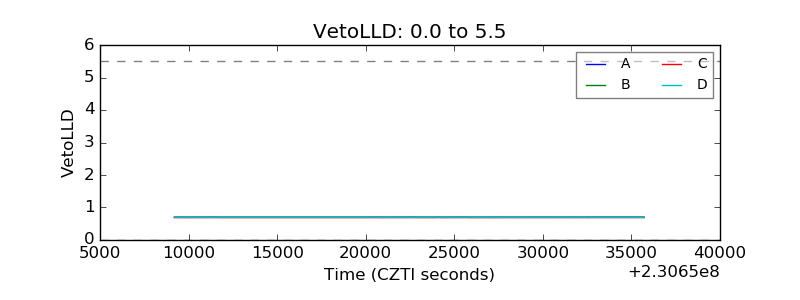 |
| Alpha Counter |  |
| _CPM_Rate |  |
| CZT Counter | 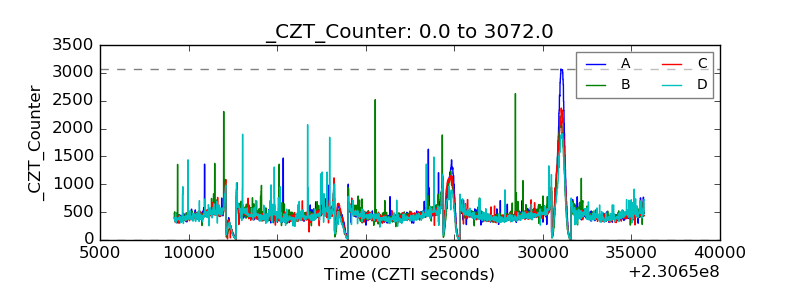 |
| +2.5 Volts monitor |  |
| +5 Volts monitor |  |
| _ROLL_ROT |  |
| _Roll_DEC |  |
| _Roll_RA | 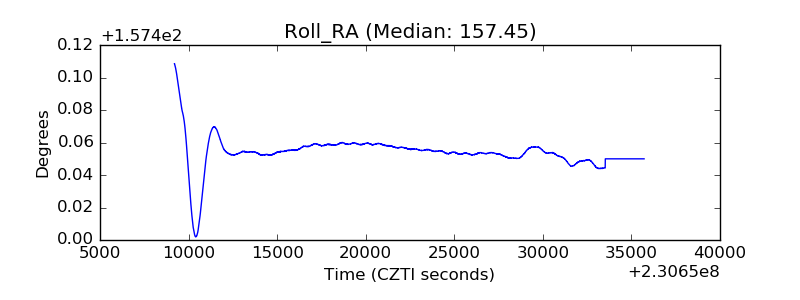 |
| Veto Counter | 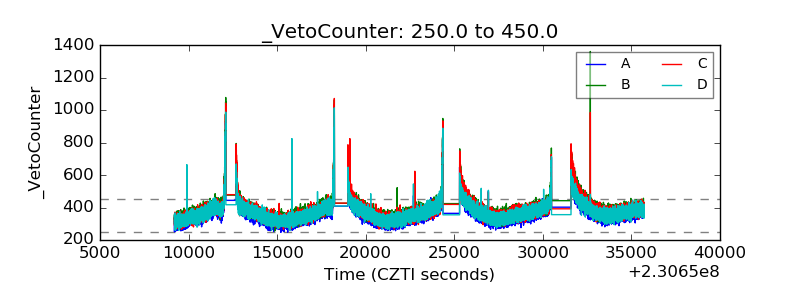 |