| Param | Original file | Final file |
|---|---|---|
| Filename | modeM0/AS1C02_033T02_9000001198_08491cztM0_level2.evt | modeM0/AS1C02_033T02_9000001198_08491cztM0_level2_quad_clean.evt |
| Size (bytes) | 423,691,200 | 88,839,360 |
| Size | 404.1 MB | 84.7 MB |
| Events in quadrant A | 3,100,022 | 565,417 |
| Events in quadrant B | 3,200,984 | 564,522 |
| Events in quadrant C | 3,013,110 | 551,351 |
| Events in quadrant D | 3,060,846 | 541,268 |
| Mode M9 | |||
|---|---|---|---|
| Quadrant | BADHDUFLAG | Total packets | Discarded packets |
| A | 0 | 17 | 0 |
| B | 0 | 17 | 0 |
| C | 0 | 17 | 0 |
| D | 0 | 17 | 0 |
| Mode M0 | |||
|---|---|---|---|
| Quadrant | BADHDUFLAG | Total packets | Discarded packets |
| A | 0 | 13950 | 2 |
| B | 0 | 14108 | 1 |
| C | 0 | 13744 | 1 |
| D | 0 | 14030 | 1 |
| Mode SS | |||
|---|---|---|---|
| Quadrant | BADHDUFLAG | Total packets | Discarded packets |
| A | 0 | 134 | 0 |
| B | 0 | 134 | 0 |
| C | 0 | 134 | 0 |
| D | 0 | 134 | 0 |
| Quadrant | Total seconds | Saturated seconds | Saturation percentage |
|---|---|---|---|
| A | 6717 | 46 | 0.684830% |
| B | 6717 | 48 | 0.714605% |
| C | 6717 | 31 | 0.461516% |
| D | 6717 | 43 | 0.640167% |
Noise dominated data is calculated using 1-second bins in cleaned event files. If a bin has >2000 counts, and if more than 50% of those come from <1% of pixels, then it is considered to be noise-dominated and hence unusable.
| Quadrant | # 1 sec bins | Bins with >0 counts | Bins with >2000 counts | High rate bins dominated by noise | Noise dominated (total time) | Noise dominated (detector-on time) | Marked lightcurve |
|---|---|---|---|---|---|---|---|
| A | 7662 | 6718 | 3 | 3 | 0.04% | 0.04% | 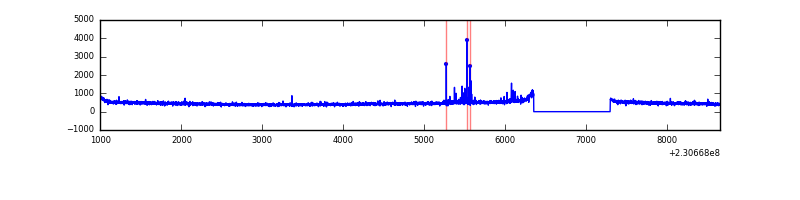 |
| B | 7662 | 6718 | 2 | 2 | 0.03% | 0.03% | 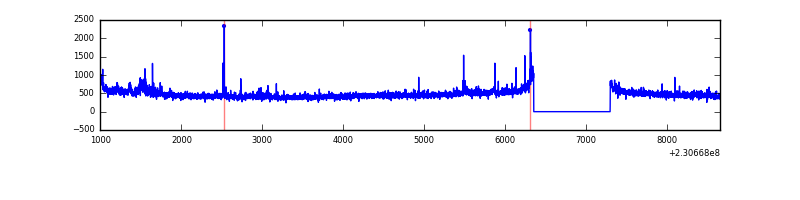 |
| C | 7662 | 6718 | 0 | 0 | 0.00% | 0.00% | 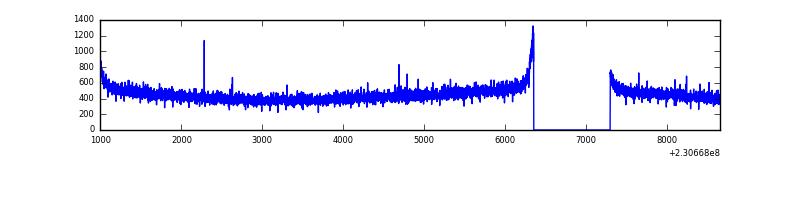 |
| D | 7662 | 6718 | 6 | 6 | 0.08% | 0.09% |  |
Top three noisy pixels from each quadrant. If the there are fewer than three noisy pixels in the level2.evt file, extra rows are filled as -1
| Pixel properties | Quadrant properties | ||||||
|---|---|---|---|---|---|---|---|
| Quadrant | DetID | PixID | Counts | Sigma | Mean | Median | Sigma |
| A | 5 | 16 | 50251 | 304.49 | 790 | 772 | 162.5 |
| A | 13 | 251 | 10891 | 62.27 | 790 | 772 | 162.5 |
| A | 0 | 226 | 7313 | 40.25 | 790 | 772 | 162.5 |
| B | 0 | 214 | 68171 | 439.77 | 791 | 772 | 153.3 |
| B | 4 | 81 | 25918 | 164.07 | 791 | 772 | 153.3 |
| B | 12 | 111 | 16307 | 101.36 | 791 | 772 | 153.3 |
| C | 8 | 128 | 14497 | 76.98 | 764 | 767 | 178.4 |
| C | 8 | 112 | 6867 | 34.2 | 764 | 767 | 178.4 |
| C | 13 | 61 | 5904 | 28.8 | 764 | 767 | 178.4 |
| D | 13 | 105 | 48731 | 238.4 | 761 | 743 | 201.3 |
| D | 1 | 52 | 29837 | 144.54 | 761 | 743 | 201.3 |
| D | 2 | 234 | 25659 | 123.78 | 761 | 743 | 201.3 |
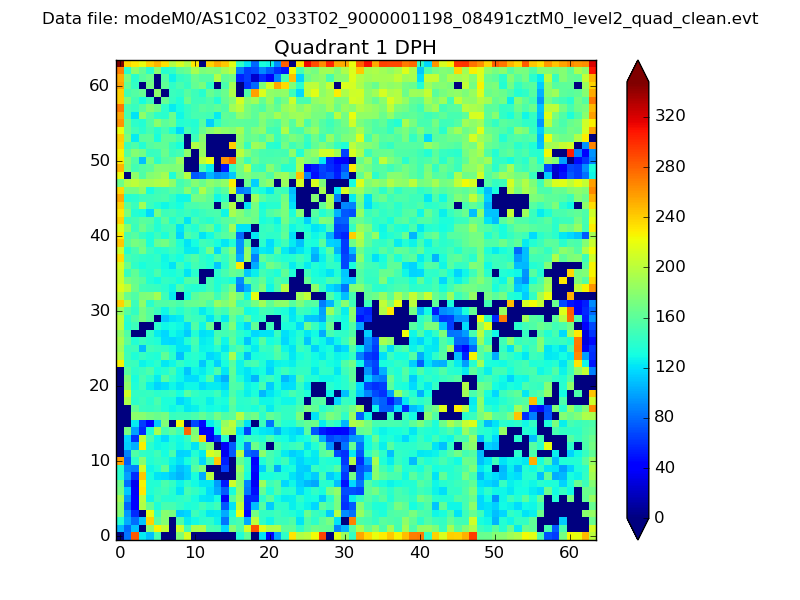
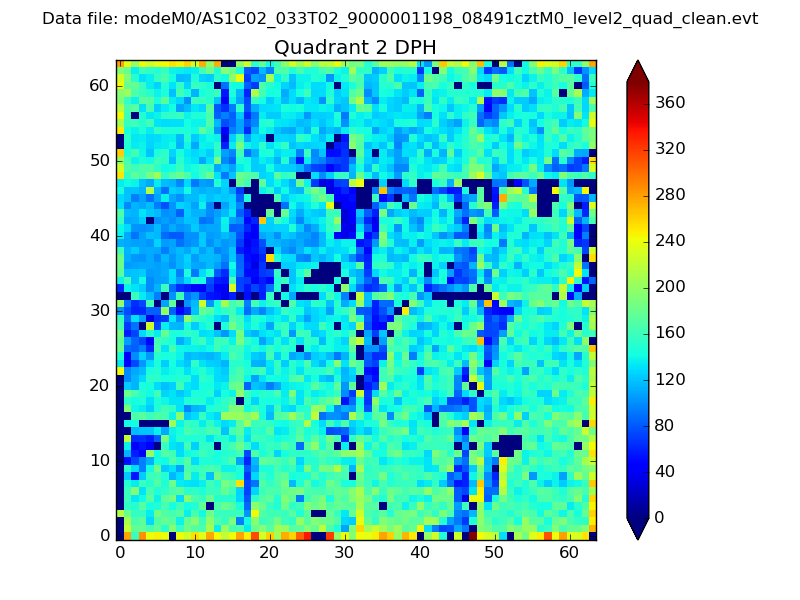
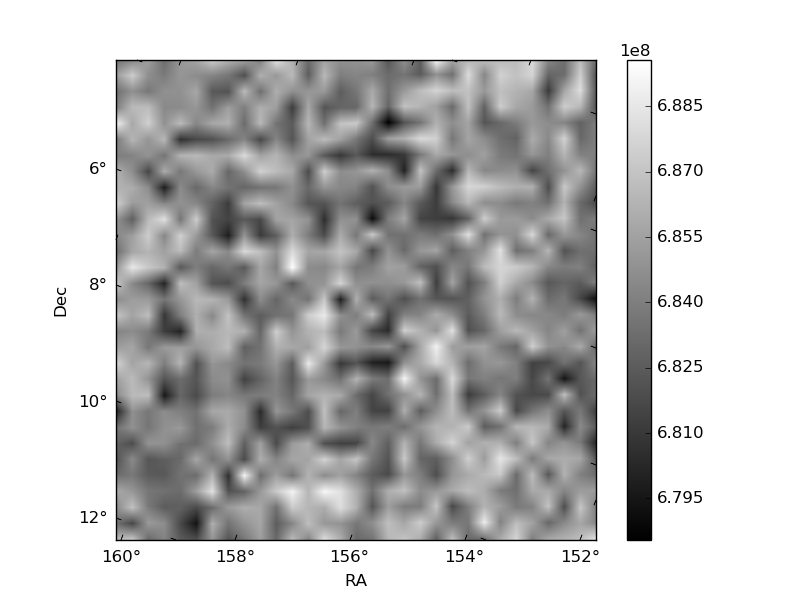
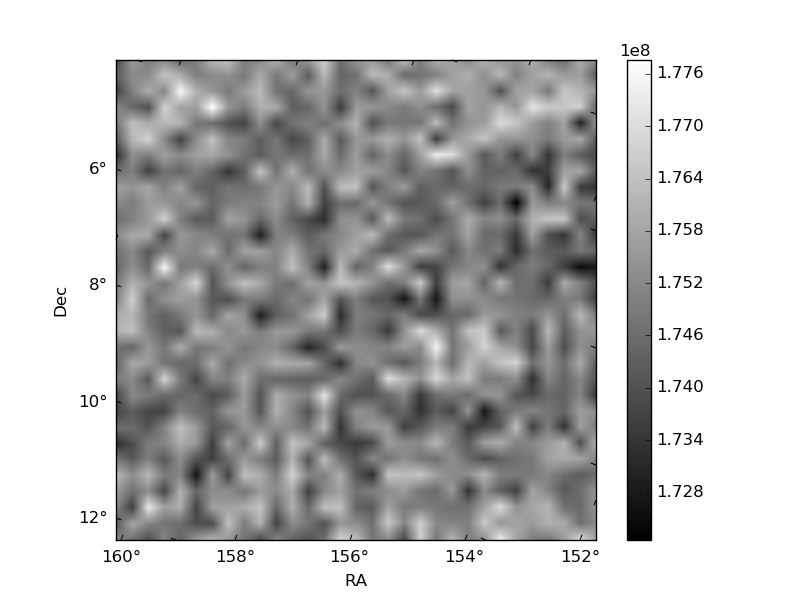
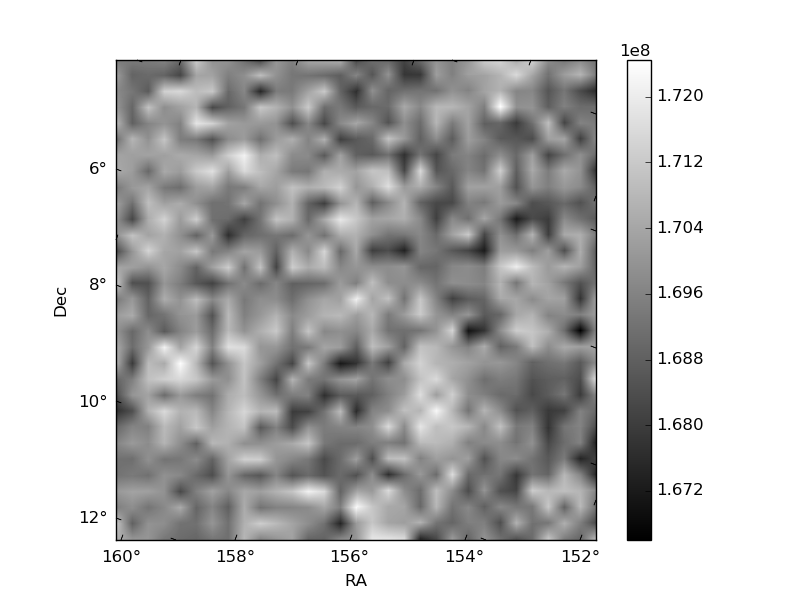
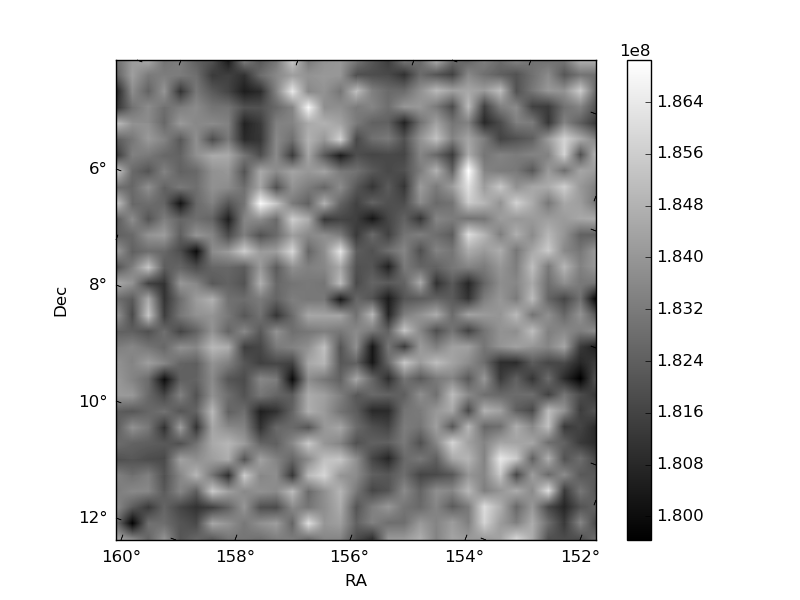
Histogram calculated using DETX and DETY for each event in the final _common_clean file
| Quadrant A | 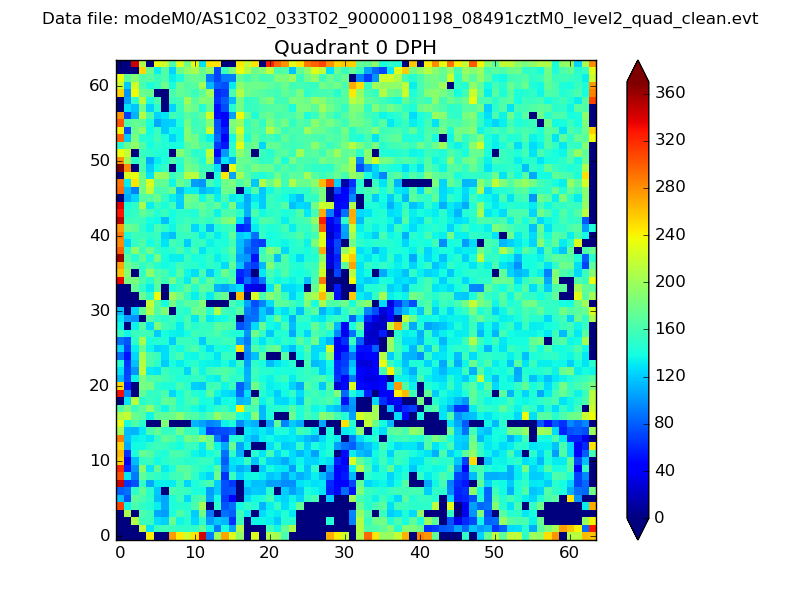 |
 |
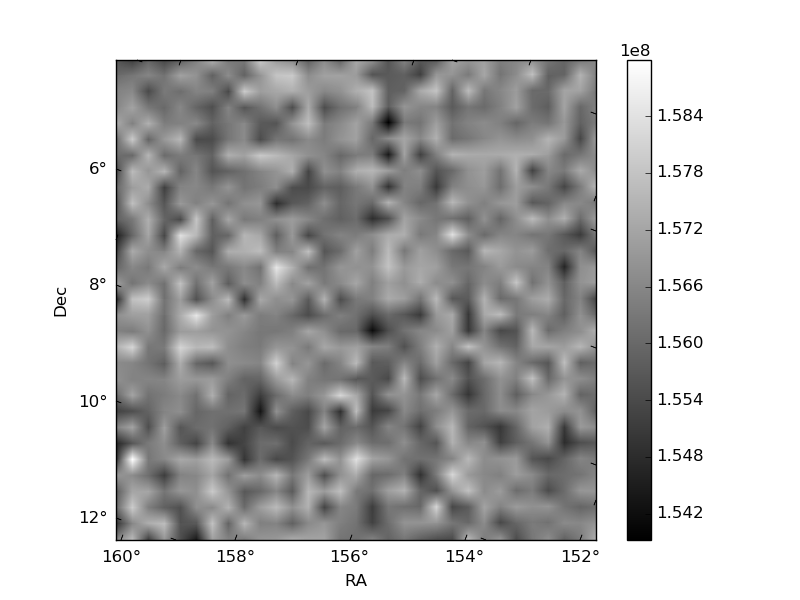
Quadrant B |
|---|---|---|---|
| Quadrant D | 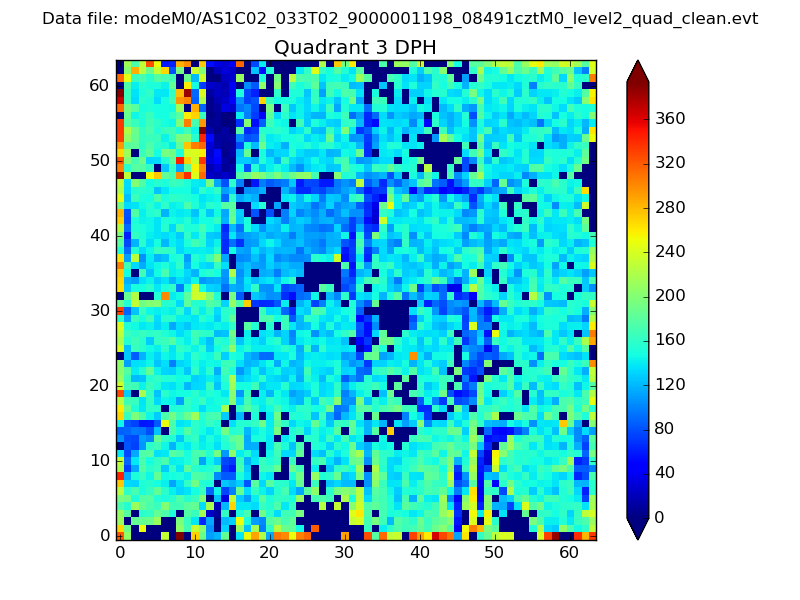 |
 |
Quadrant C |
| Plot type | Count rate plots | Images |
|---|---|---|
| Comparison with Poisson distribution Blue bars denote a histogram of data divided into 1 sec bins. Red curve is a Poisson curve with rate = median count rate of data. |
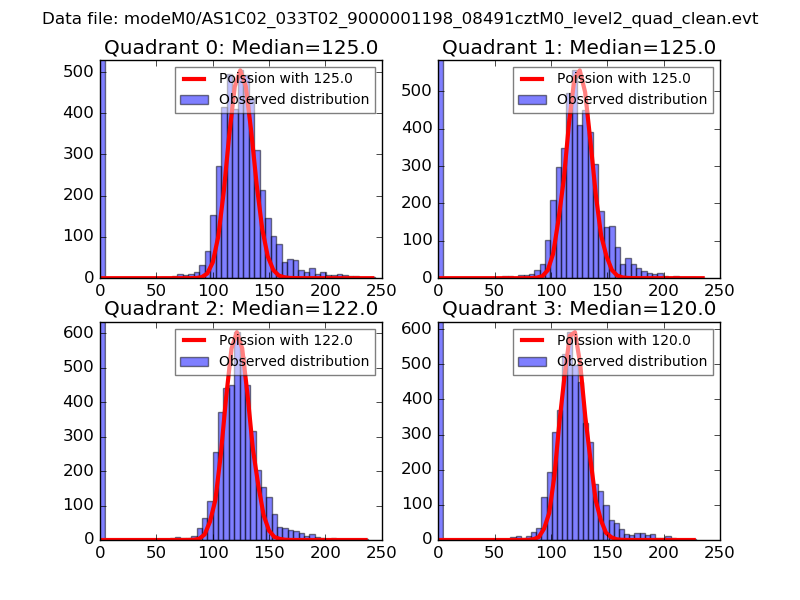 |
 |
| Quadrant-wise count rates Data is divided into 100 sec bins |
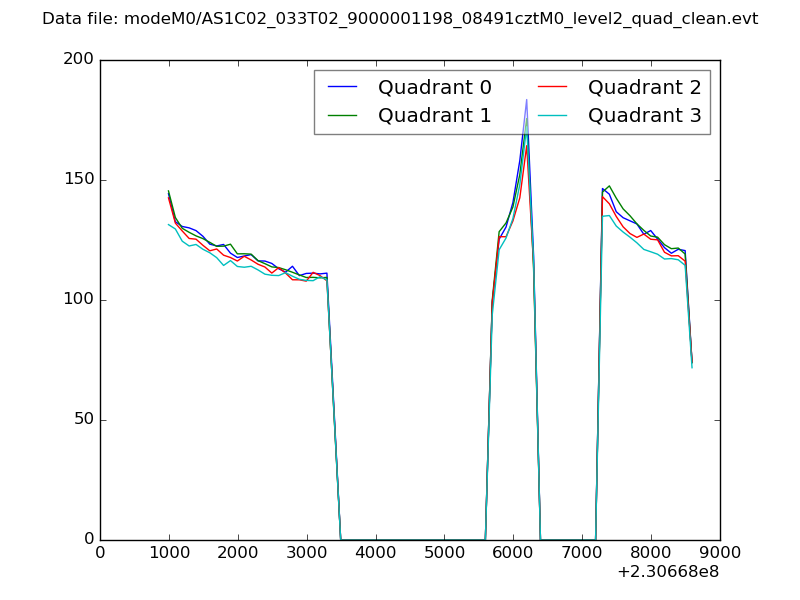 |
|
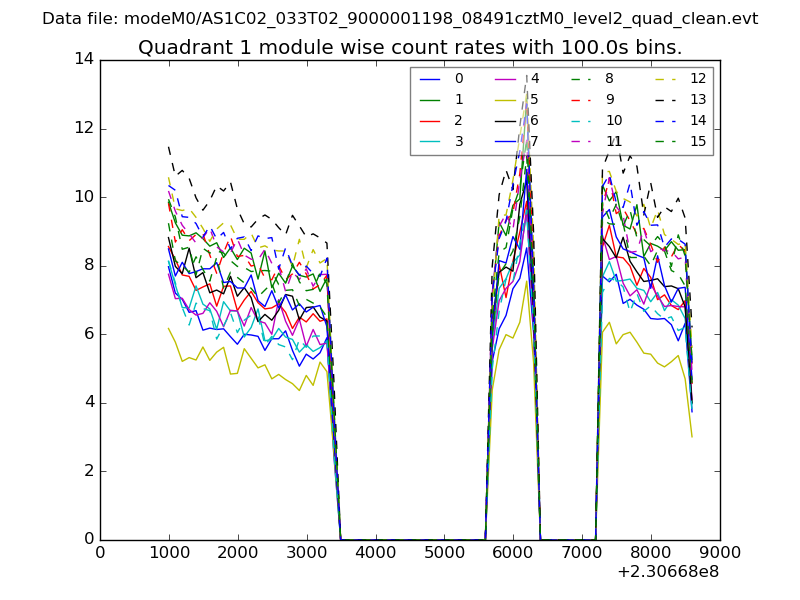
| Module-wise count rates for Quadrant A Data is divided into 100 sec bins |
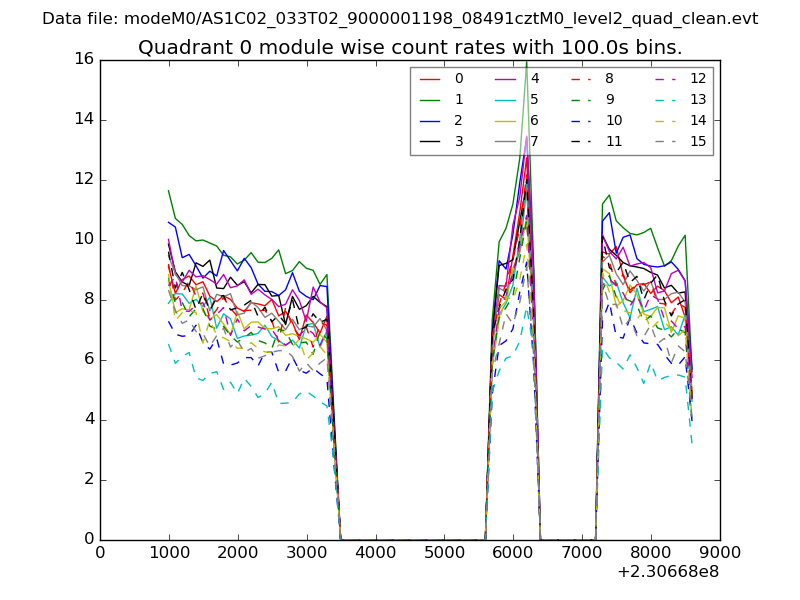 |
 |
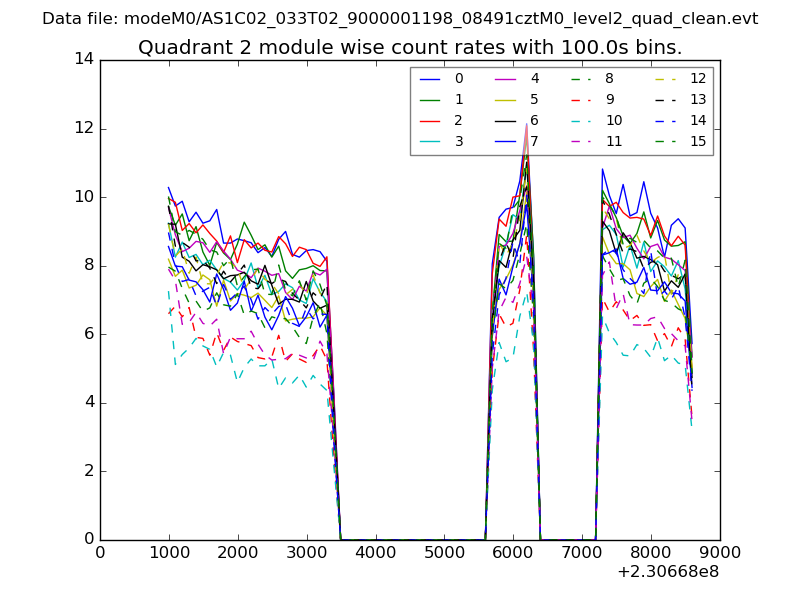
| Module-wise count rates for Quadrant B Data is divided into 100 sec bins |
 |
 |
| Module-wise count rates for Quadrant C Data is divided into 100 sec bins |
 |
 |
| Module-wise count rates for Quadrant D Data is divided into 100 sec bins |
 |
 |
| Parameter | Plot |
|---|---|
| CZT HV Monitor | 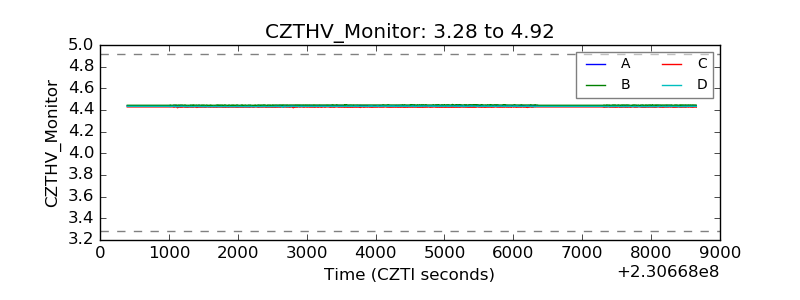 |
| D_VDD | 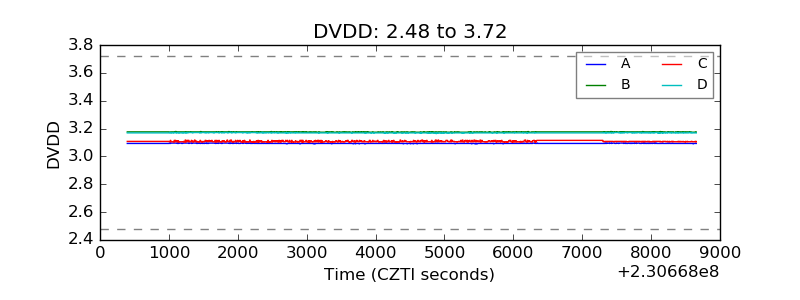 |
| Temperature 1 | 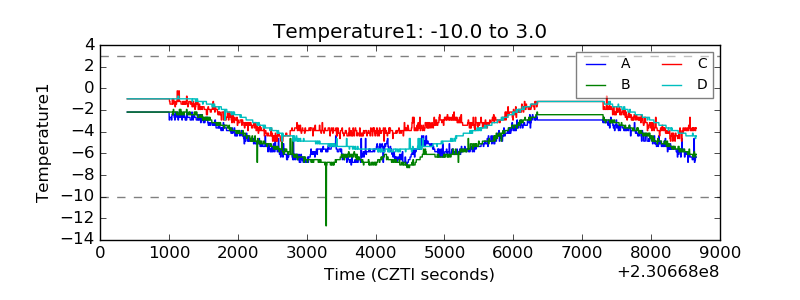 |
| Veto HV Monitor | 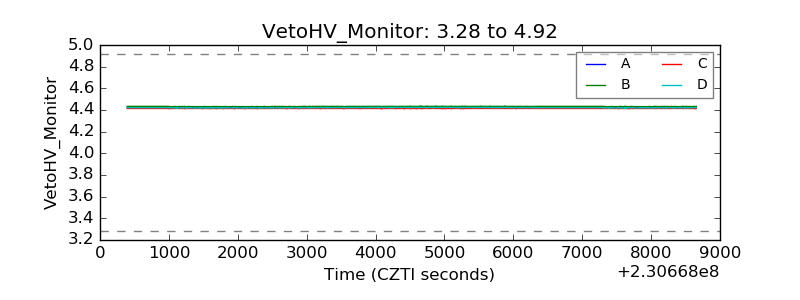 |
| Veto LLD | 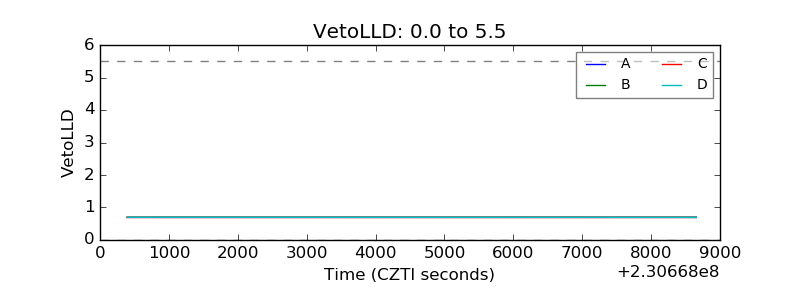 |
| Alpha Counter | 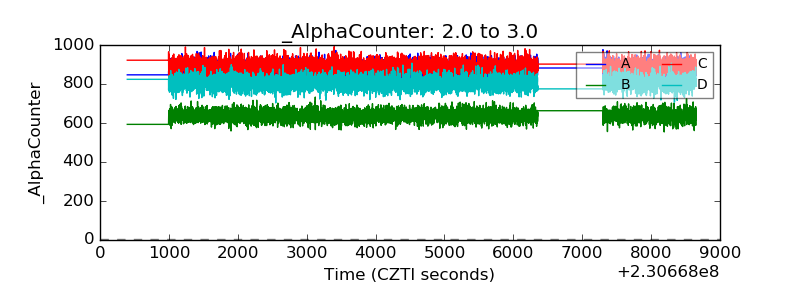 |
| _CPM_Rate | 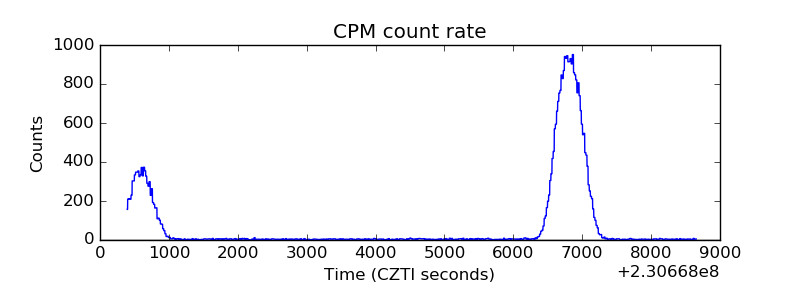 |
| CZT Counter | 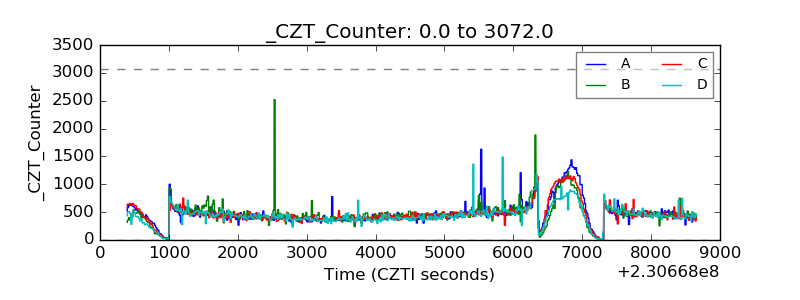 |
| +2.5 Volts monitor |  |
| +5 Volts monitor |  |
| _ROLL_ROT | 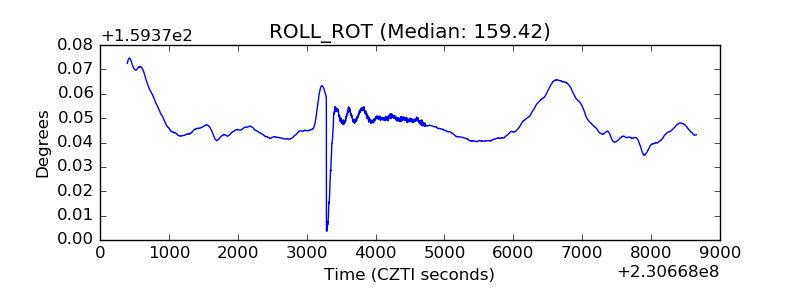 |
| _Roll_DEC | 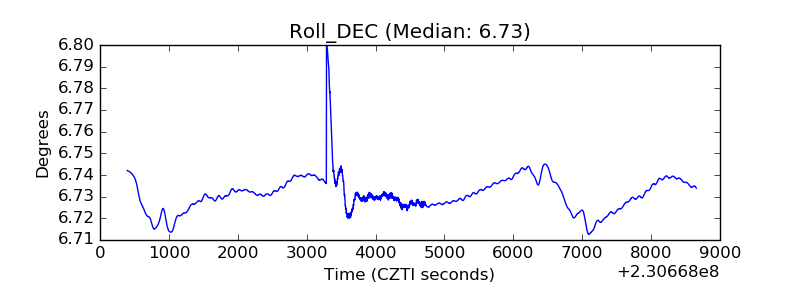 |
| _Roll_RA | 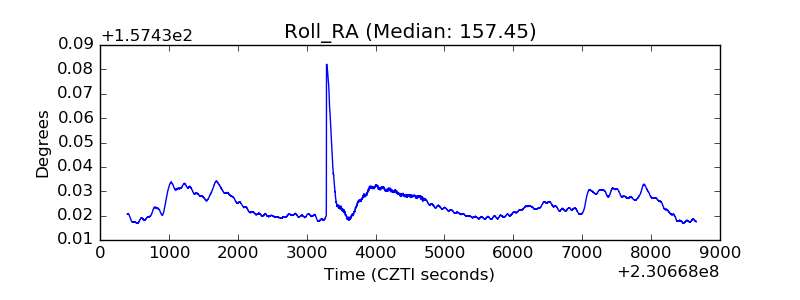 |
| Veto Counter | 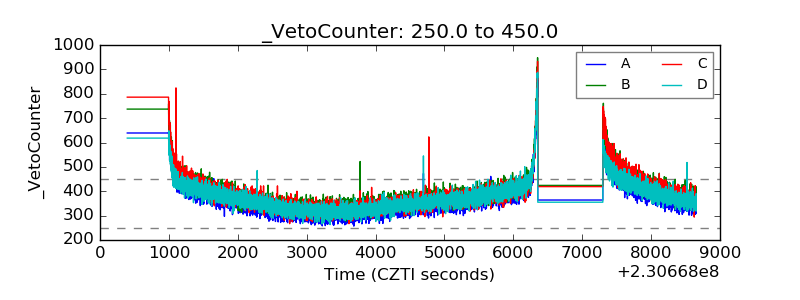 |