| Param | Original file | Final file |
|---|---|---|
| Filename | modeM0/AS1C02_033T02_9000001198_08494cztM0_level2.evt | modeM0/AS1C02_033T02_9000001198_08494cztM0_level2_quad_clean.evt |
| Size (bytes) | 254,784,960 | 41,578,560 |
| Size | 243.0 MB | 39.7 MB |
| Events in quadrant A | 1,827,432 | 244,771 |
| Events in quadrant B | 1,924,235 | 249,215 |
| Events in quadrant C | 1,791,655 | 241,920 |
| Events in quadrant D | 1,890,252 | 231,556 |
| Mode M9 | |||
|---|---|---|---|
| Quadrant | BADHDUFLAG | Total packets | Discarded packets |
| A | 0 | 9 | 0 |
| B | 0 | 9 | 0 |
| C | 0 | 9 | 0 |
| D | 0 | 10 | 0 |
| Mode M0 | |||
|---|---|---|---|
| Quadrant | BADHDUFLAG | Total packets | Discarded packets |
| A | 0 | 8327 | 1 |
| B | 0 | 8499 | 1 |
| C | 0 | 8298 | 1 |
| D | 0 | 8536 | 3 |
| Mode SS | |||
|---|---|---|---|
| Quadrant | BADHDUFLAG | Total packets | Discarded packets |
| A | 0 | 84 | 0 |
| B | 0 | 84 | 0 |
| C | 0 | 84 | 0 |
| D | 0 | 84 | 0 |
| Quadrant | Total seconds | Saturated seconds | Saturation percentage |
|---|---|---|---|
| A | 4125 | 6 | 0.145455% |
| B | 4125 | 8 | 0.193939% |
| C | 4125 | 2 | 0.048485% |
| D | 4124 | 2 | 0.048497% |
Noise dominated data is calculated using 1-second bins in cleaned event files. If a bin has >2000 counts, and if more than 50% of those come from <1% of pixels, then it is considered to be noise-dominated and hence unusable.
| Quadrant | # 1 sec bins | Bins with >0 counts | Bins with >2000 counts | High rate bins dominated by noise | Noise dominated (total time) | Noise dominated (detector-on time) | Marked lightcurve |
|---|---|---|---|---|---|---|---|
| A | 4125 | 4125 | 0 | 0 | 0.00% | 0.00% | 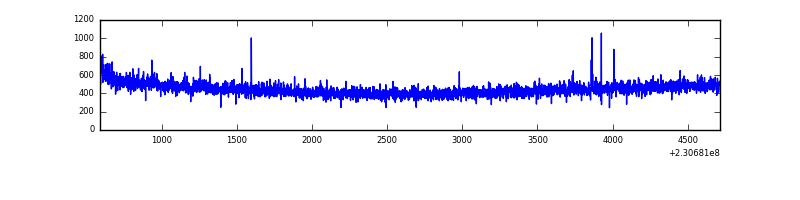 |
| B | 4125 | 4125 | 1 | 1 | 0.02% | 0.02% | 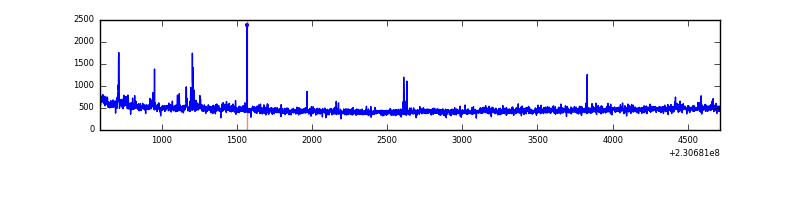 |
| C | 4125 | 4125 | 0 | 0 | 0.00% | 0.00% |  |
| D | 4125 | 4125 | 0 | 0 | 0.00% | 0.00% | 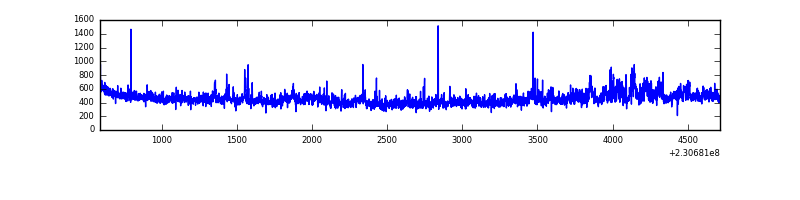 |
Top three noisy pixels from each quadrant. If the there are fewer than three noisy pixels in the level2.evt file, extra rows are filled as -1
| Pixel properties | Quadrant properties | ||||||
|---|---|---|---|---|---|---|---|
| Quadrant | DetID | PixID | Counts | Sigma | Mean | Median | Sigma |
| A | 13 | 251 | 6833 | 65.78 | 471 | 461 | 96.9 |
| A | 0 | 226 | 4352 | 40.17 | 471 | 461 | 96.9 |
| A | 12 | 194 | 4232 | 38.93 | 471 | 461 | 96.9 |
| B | 0 | 214 | 27959 | 300.37 | 477 | 467 | 91.5 |
| B | 0 | 230 | 11280 | 118.14 | 477 | 467 | 91.5 |
| B | 0 | 213 | 11139 | 116.6 | 477 | 467 | 91.5 |
| C | 13 | 61 | 3516 | 28.28 | 459 | 460 | 108.1 |
| C | 8 | 222 | 1775 | 12.17 | 459 | 460 | 108.1 |
| C | 3 | 202 | 1142 | 6.31 | 459 | 460 | 108.1 |
| D | 1 | 52 | 144948 | 1238.01 | 451 | 440 | 116.7 |
| D | 2 | 234 | 12855 | 106.36 | 451 | 440 | 116.7 |
| D | 5 | 97 | 11514 | 94.87 | 451 | 440 | 116.7 |
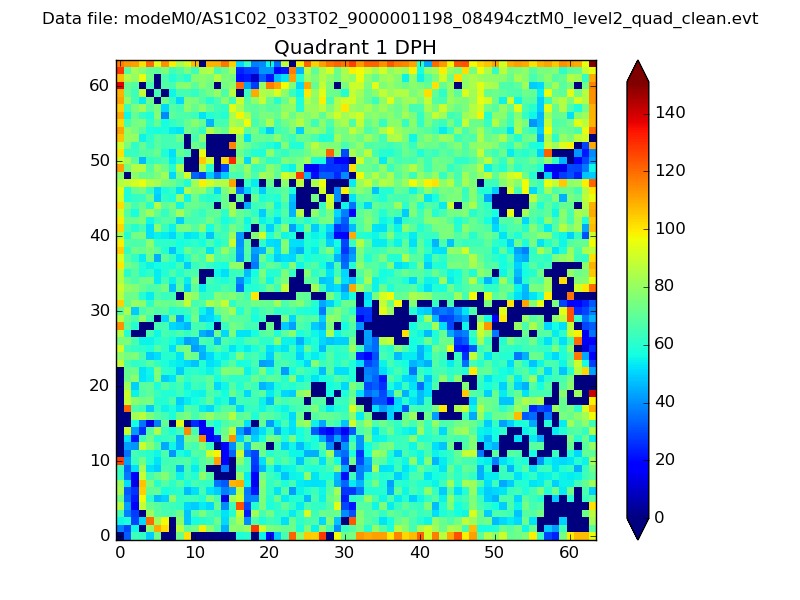
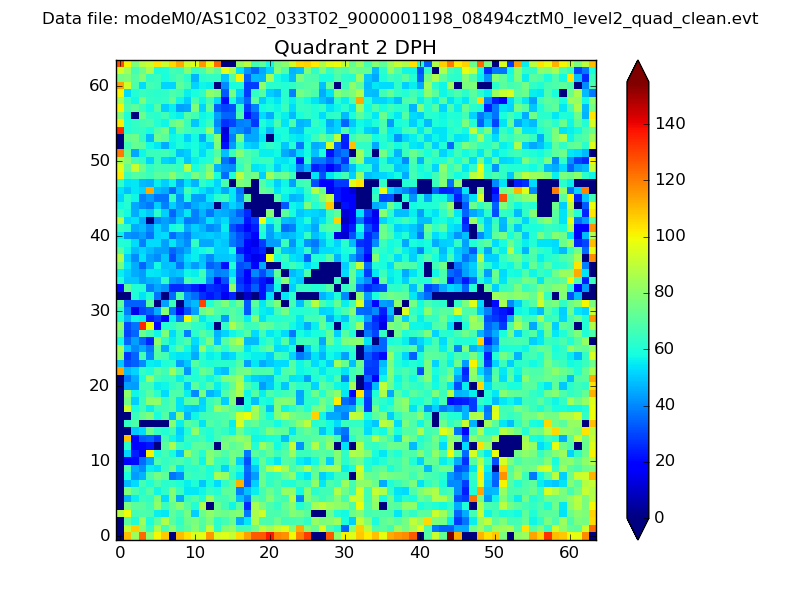
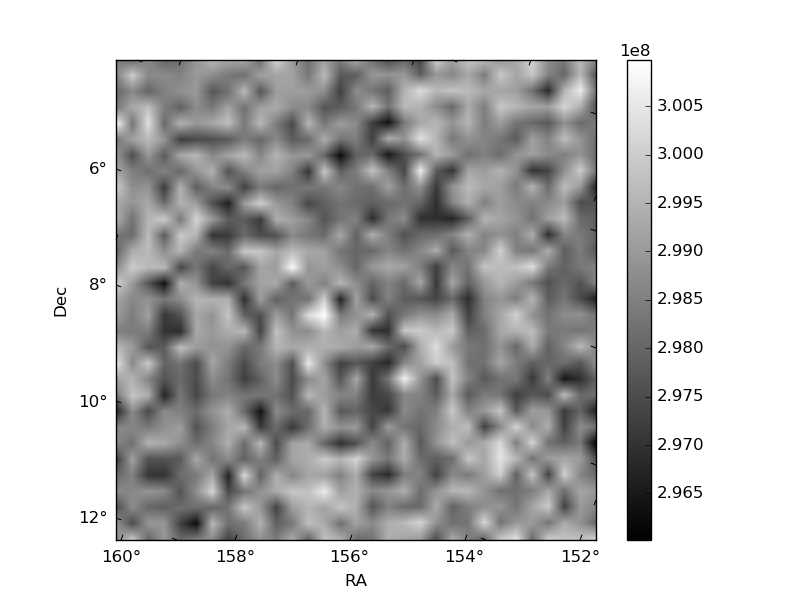
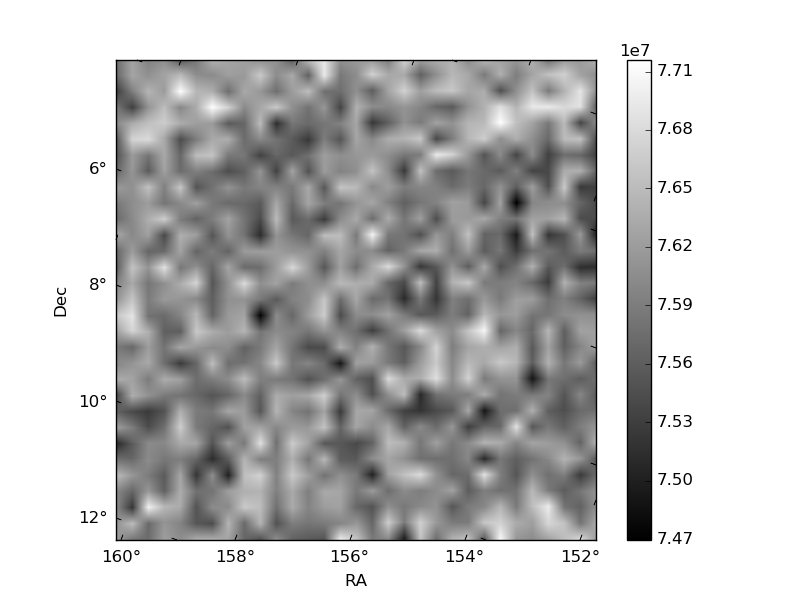
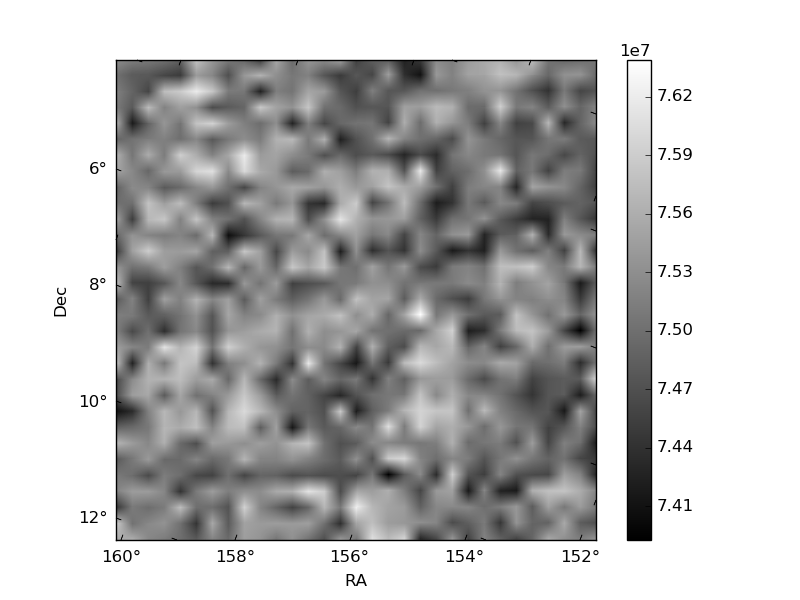
Histogram calculated using DETX and DETY for each event in the final _common_clean file
| Quadrant A | 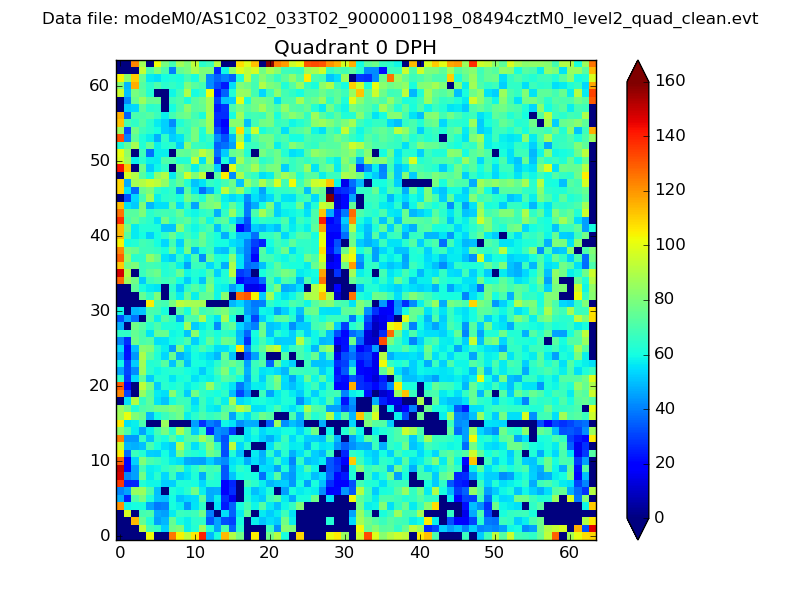 |
 |
Quadrant B |
|---|---|---|---|
| Quadrant D | 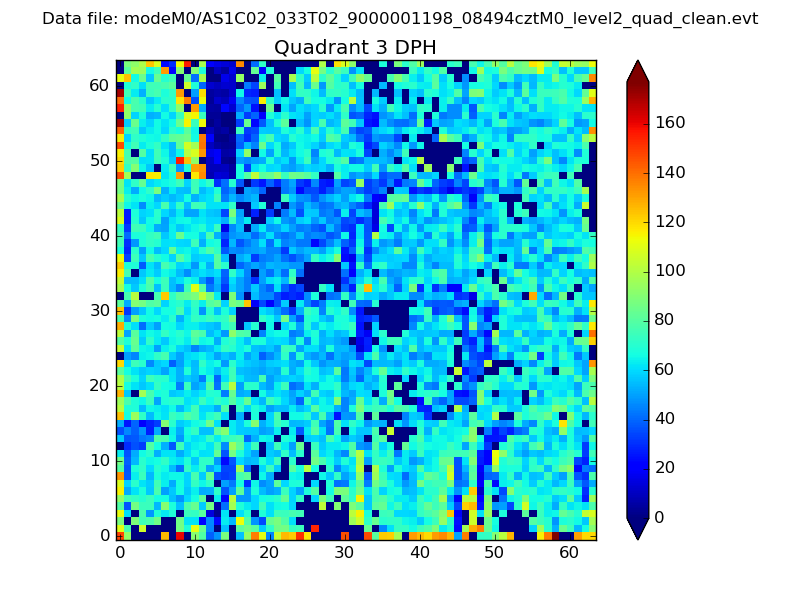 |
 |
Quadrant C |
| Plot type | Count rate plots | Images |
|---|---|---|
| Comparison with Poisson distribution Blue bars denote a histogram of data divided into 1 sec bins. Red curve is a Poisson curve with rate = median count rate of data. |
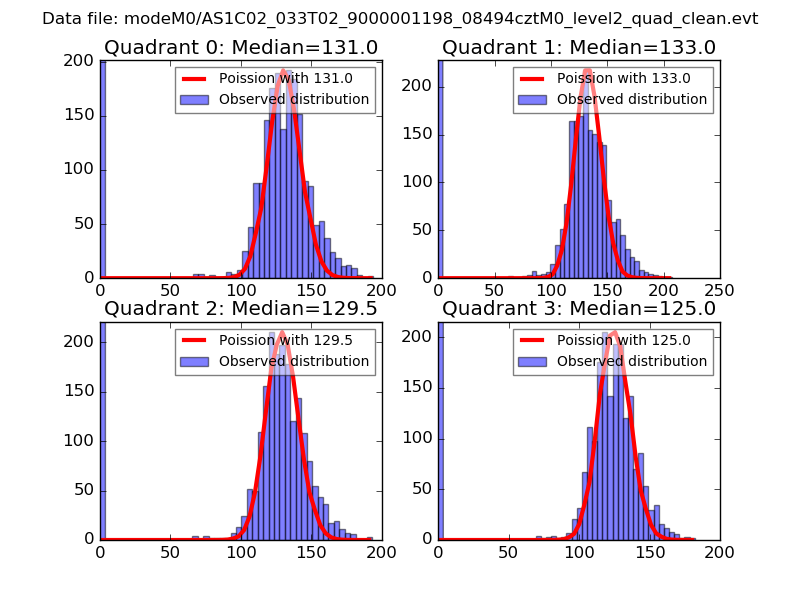 |
 |
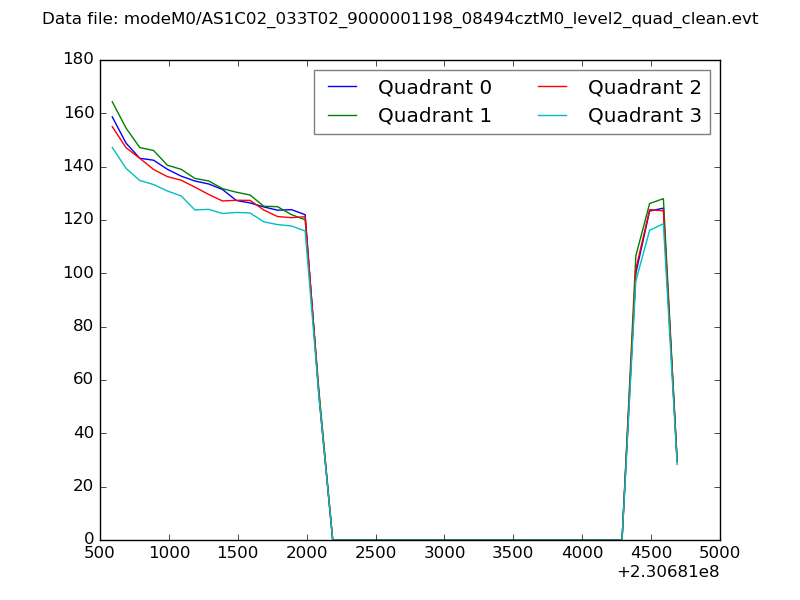
| Quadrant-wise count rates Data is divided into 100 sec bins |
 |
|
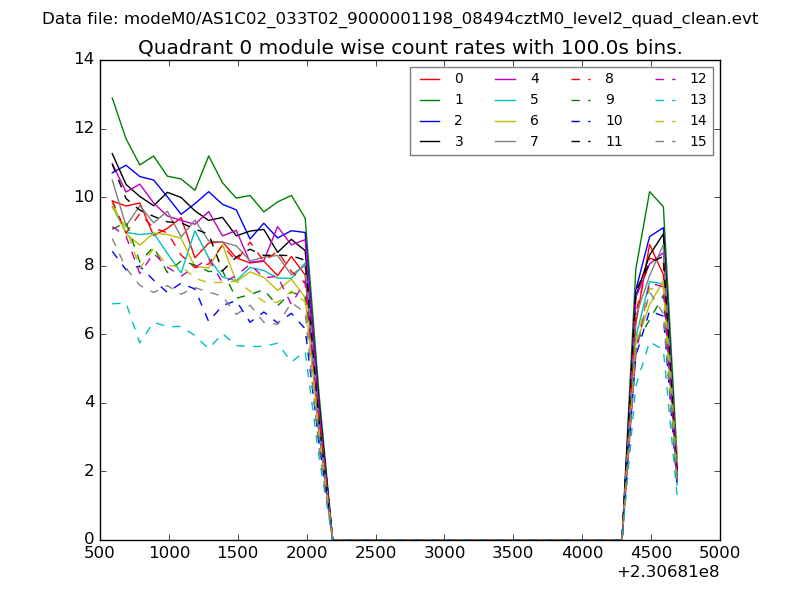
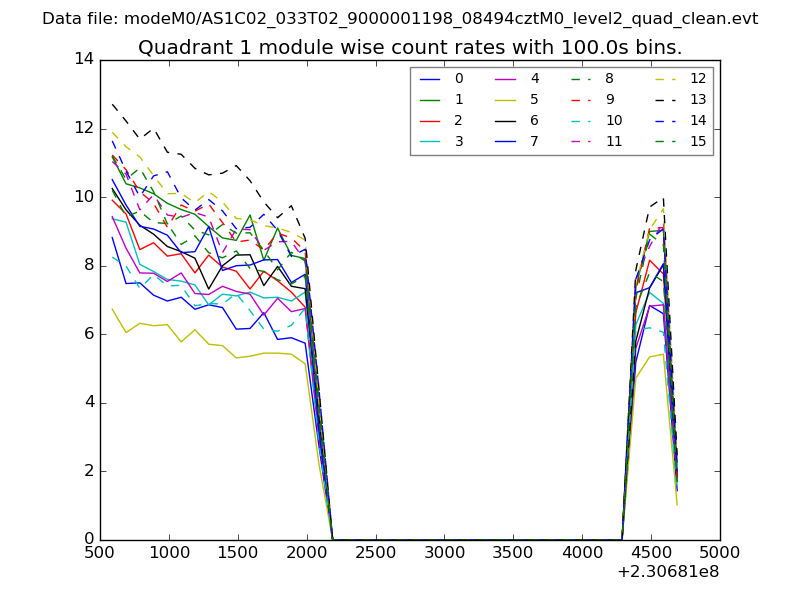
| Module-wise count rates for Quadrant A Data is divided into 100 sec bins |
 |
 |
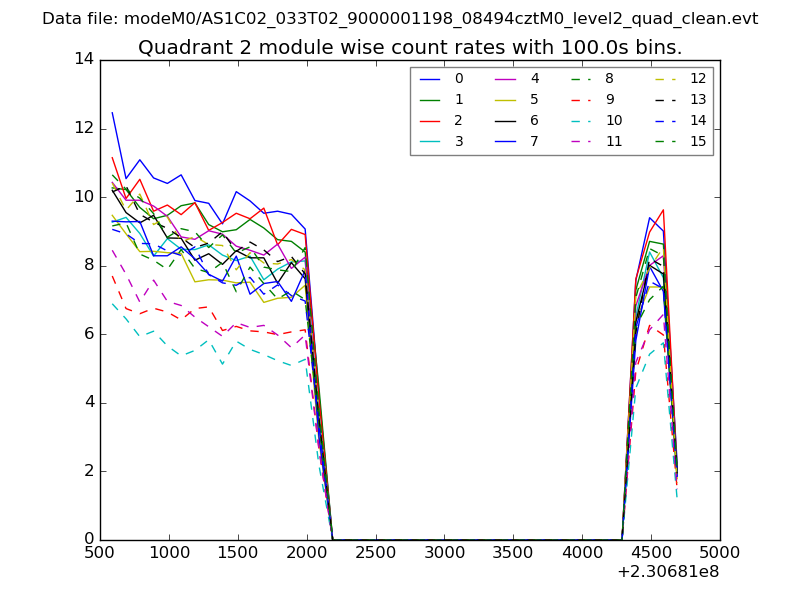
| Module-wise count rates for Quadrant B Data is divided into 100 sec bins |
 |
 |
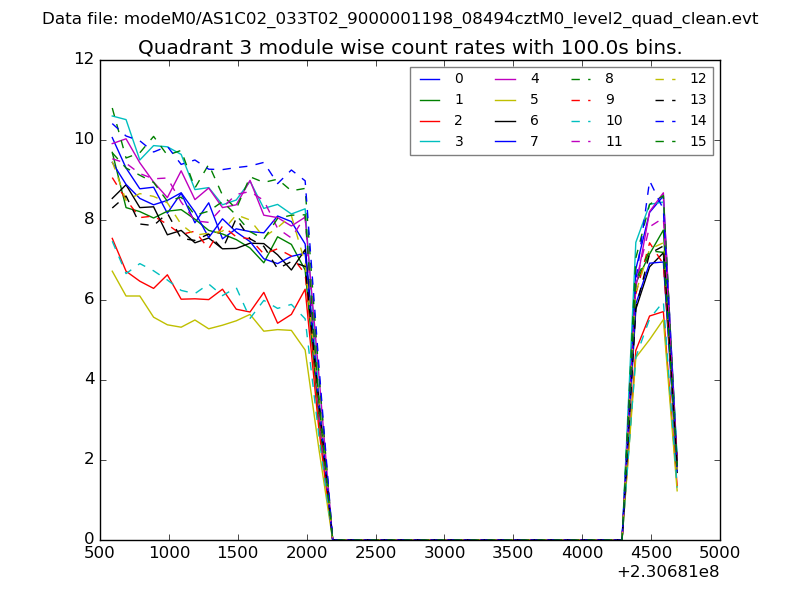
| Module-wise count rates for Quadrant C Data is divided into 100 sec bins |
 |
 |
| Module-wise count rates for Quadrant D Data is divided into 100 sec bins |
 |
 |
| Parameter | Plot |
|---|---|
| CZT HV Monitor | 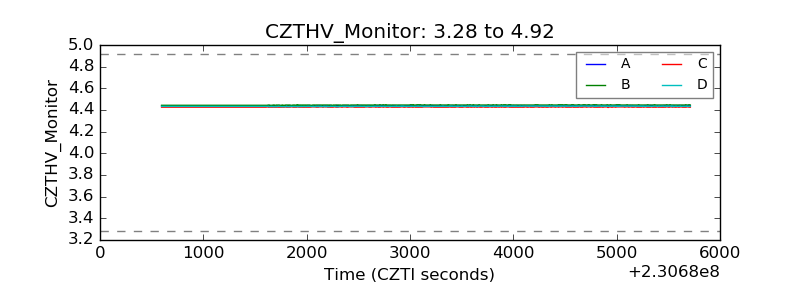 |
| D_VDD | 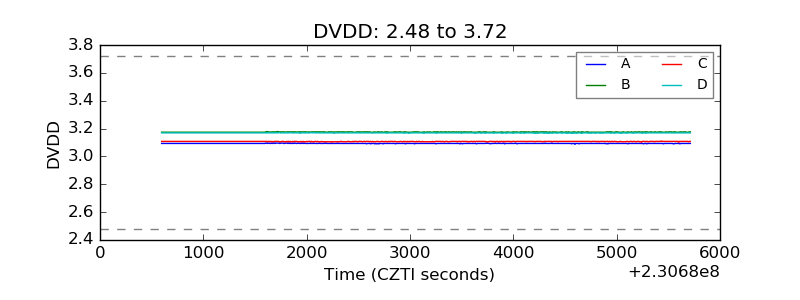 |
| Temperature 1 | 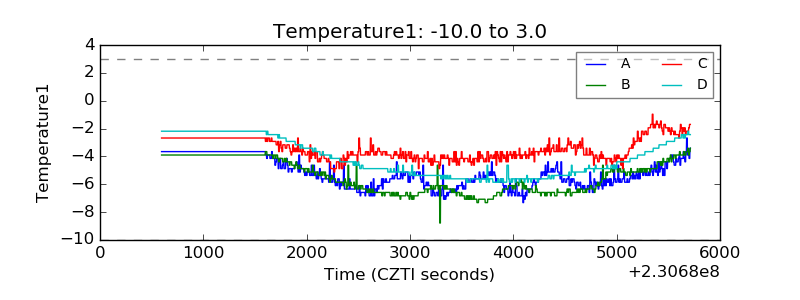 |
| Veto HV Monitor | 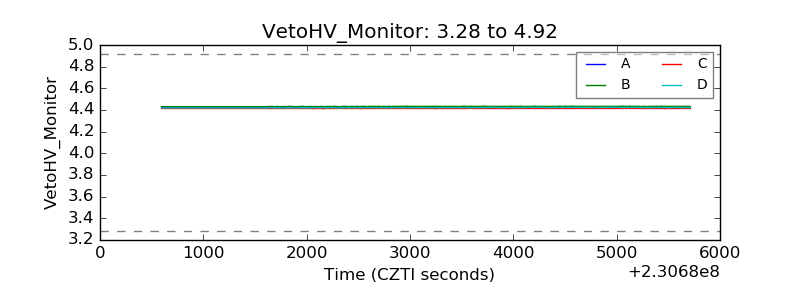 |
| Veto LLD | 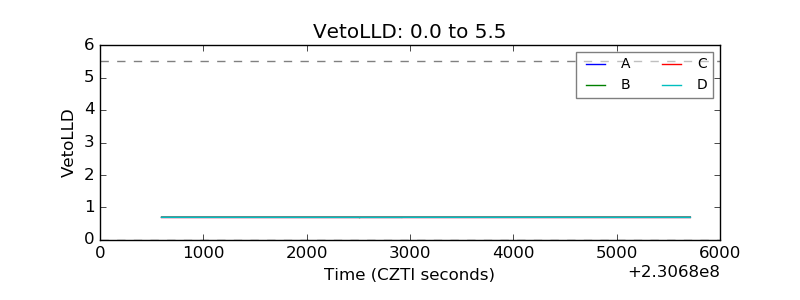 |
| Alpha Counter | 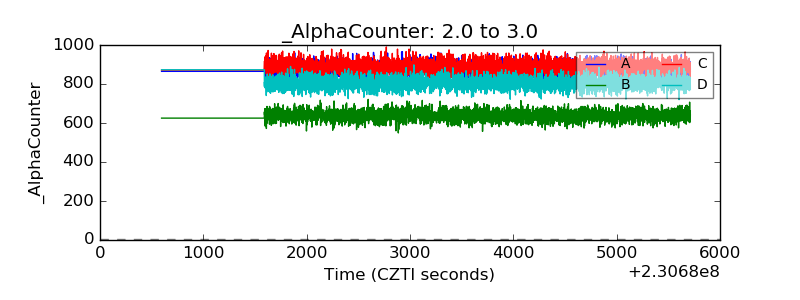 |
| _CPM_Rate | 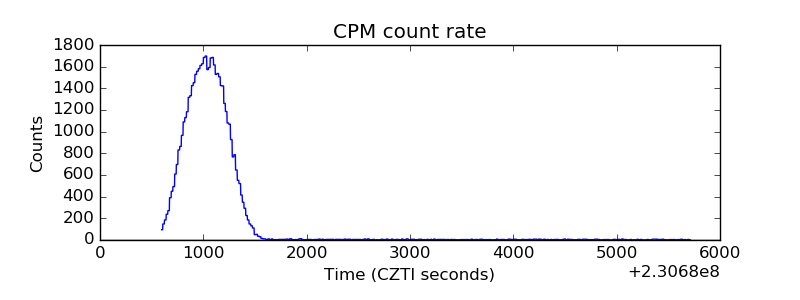 |
| CZT Counter | 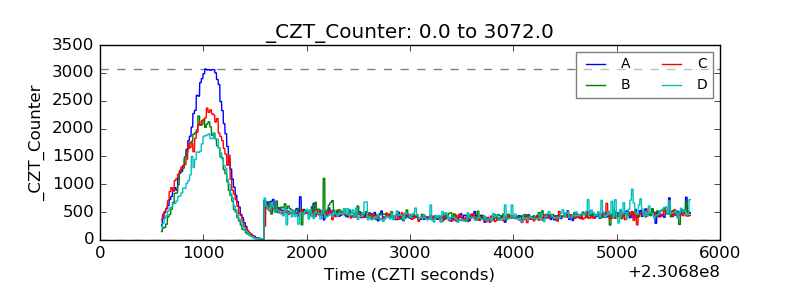 |
| +2.5 Volts monitor |  |
| +5 Volts monitor | 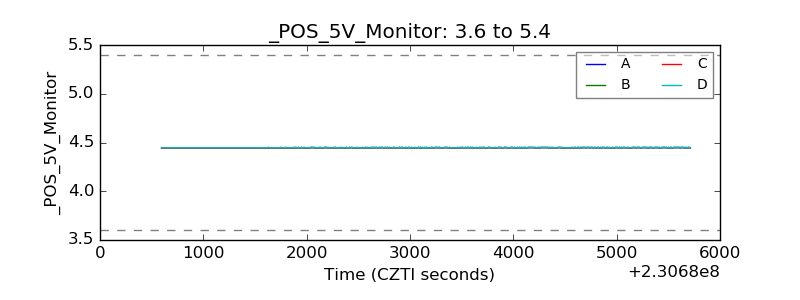 |
| _ROLL_ROT | 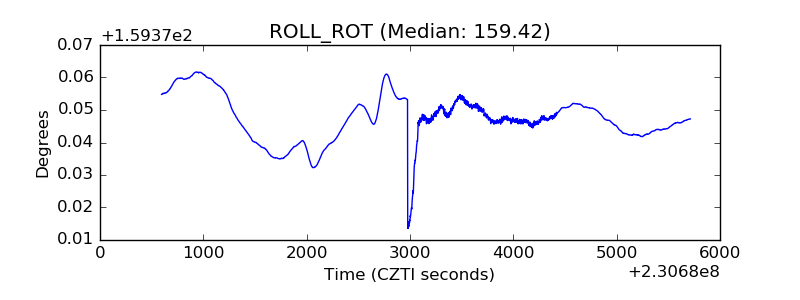 |
| _Roll_DEC | 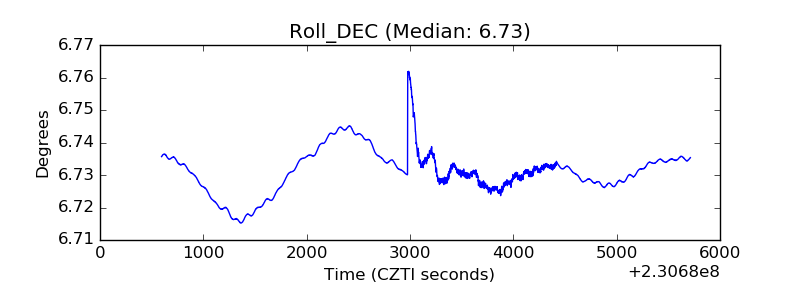 |
| _Roll_RA | 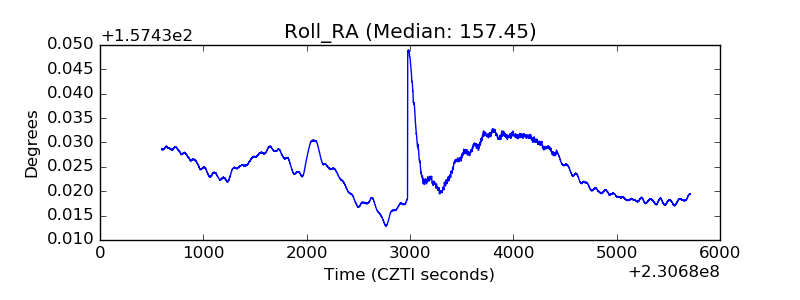 |
| Veto Counter | 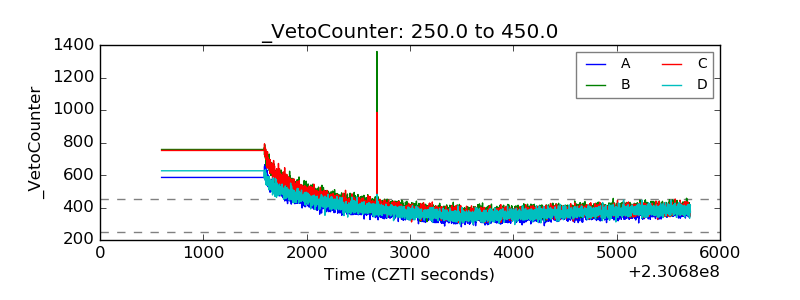 |