| Param | Original file | Final file |
|---|---|---|
| Filename | modeM0/AS1G07_060T01_9000001200cztM0_level2.fits | modeM0/AS1G07_060T01_9000001200cztM0_level2_quad_clean.evt |
| Size (bytes) | 4,799,105,280 | 3,258,982,080 |
| Size | 4.5 GB | 3.0 GB |
| Events in quadrant A | 32,746,996 | 20,256,639 |
| Events in quadrant B | 32,735,404 | 19,860,682 |
| Events in quadrant C | 31,002,727 | 19,362,163 |
| Events in quadrant D | 26,954,754 | 17,302,458 |
| Mode SS | |||
|---|---|---|---|
| Quadrant | BADHDUFLAG | Total packets | Discarded packets |
| A | 0 | 6514 | 0 |
| B | 0 | 6512 | 0 |
| C | 0 | 6510 | 0 |
| D | 0 | 6518 | 0 |
| Mode M0 | |||
|---|---|---|---|
| Quadrant | BADHDUFLAG | Total packets | Discarded packets |
| A | 0 | 678151 | 0 |
| B | 0 | 695087 | 0 |
| C | 0 | 655186 | 0 |
| D | 0 | 739612 | 0 |
| Mode M9 | |||
|---|---|---|---|
| Quadrant | BADHDUFLAG | Total packets | Discarded packets |
| A | 0 | 512 | 0 |
| B | 0 | 512 | 0 |
| C | 0 | 513 | 0 |
| D | 0 | 513 | 0 |
| Quadrant | Total seconds | Saturated seconds | Saturation percentage |
|---|---|---|---|
| A | 320104 | 6148 | 1.920626% |
| B | 320534 | 7158 | 2.233148% |
| C | 320188 | 3041 | 0.949755% |
| D | 320078 | 11353 | 3.546948% |
Noise dominated data is calculated using 1-second bins in cleaned event files. If a bin has >2000 counts, and if more than 50% of those come from <1% of pixels, then it is considered to be noise-dominated and hence unusable.
| Quadrant | # 1 sec bins | Bins with >0 counts | Bins with >2000 counts | High rate bins dominated by noise | Noise dominated (total time) | Noise dominated (detector-on time) | Marked lightcurve |
|---|---|---|---|---|---|---|---|
| A | 372747 | 318429 | 0 | 0 | 0.00% | 0.00% | 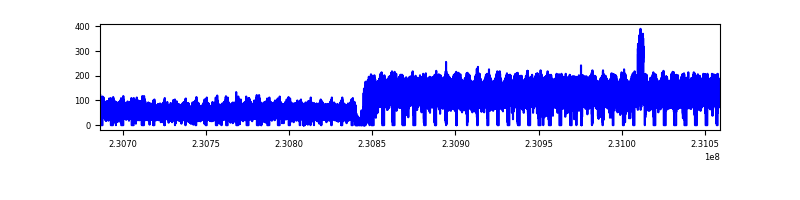 |
| B | 372747 | 318819 | 0 | 0 | 0.00% | 0.00% | 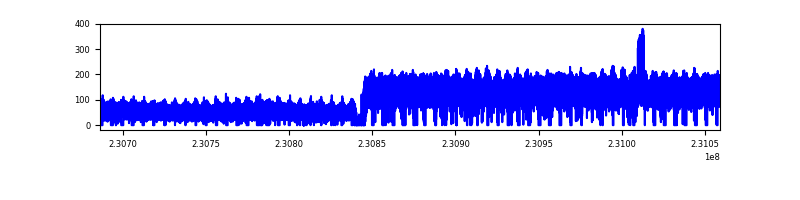 |
| C | 372747 | 318546 | 0 | 0 | 0.00% | 0.00% | 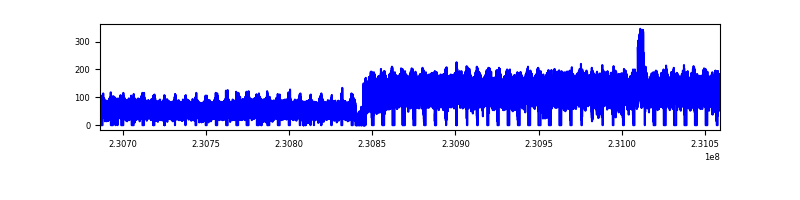 |
| D | 372747 | 318401 | 0 | 0 | 0.00% | 0.00% | 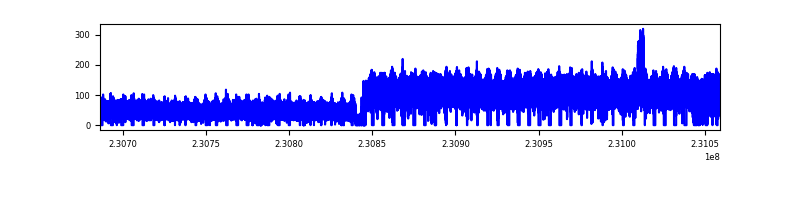 |
Top three noisy pixels from each quadrant. If the there are fewer than three noisy pixels in the level2.evt file, extra rows are filled as -1
| Pixel properties | Quadrant properties | ||||||
|---|---|---|---|---|---|---|---|
| Quadrant | DetID | PixID | Counts | Sigma | Mean | Median | Sigma |
| A | 0 | 29 | 20120 | 6.35 | 8608 | 8206 | 1875.3 |
| A | 14 | 235 | 18726 | 5.61 | 8608 | 8206 | 1875.3 |
| A | -1 | -1 | -1 | -1.0 | 8608 | 8206 | 1875.3 |
| B | 5 | 232 | 18777 | 5.89 | 8743 | 8392 | 1761.9 |
| B | 2 | 9 | 18041 | 5.48 | 8743 | 8392 | 1761.9 |
| B | 15 | 3 | 17607 | 5.23 | 8743 | 8392 | 1761.9 |
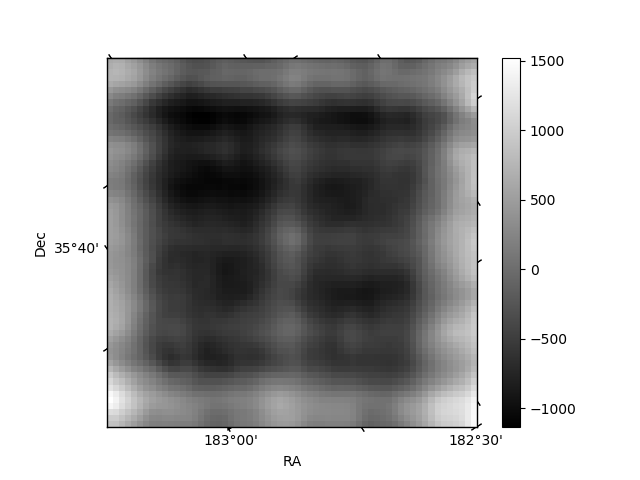
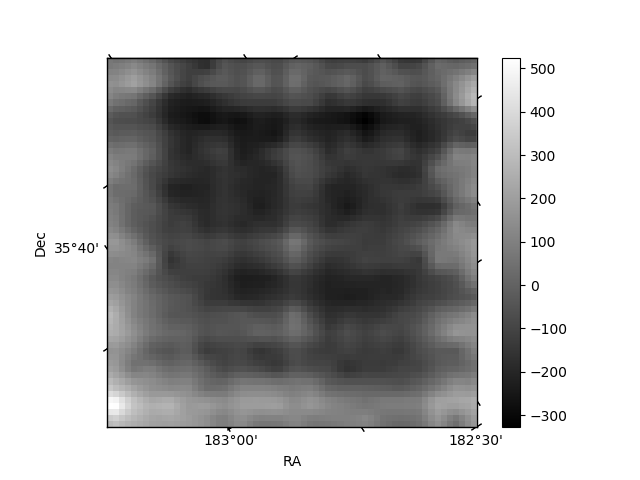
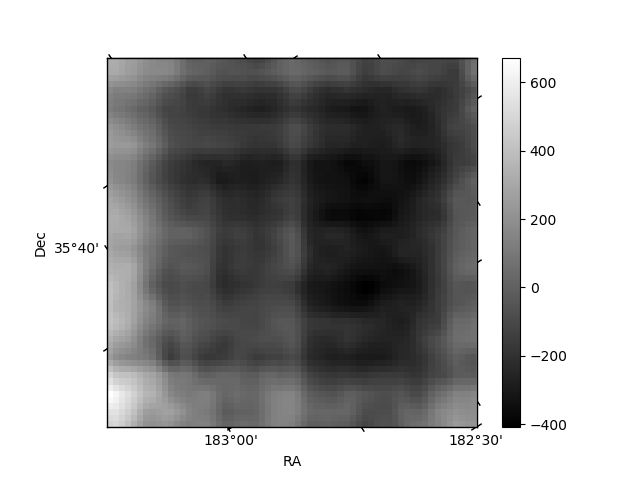
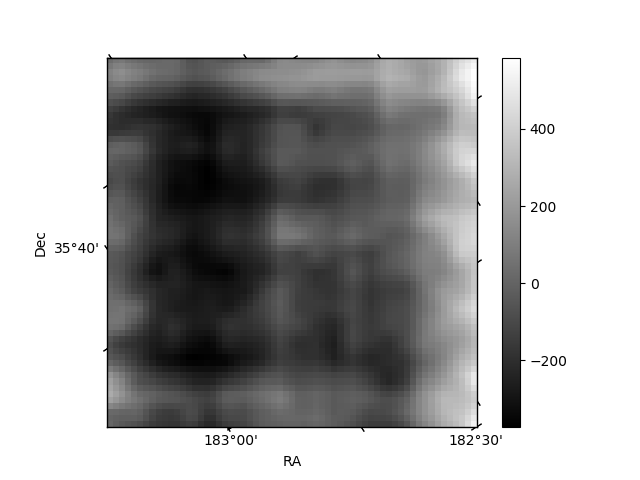
Histogram calculated using DETX and DETY for each event in the final _common_clean file
| Quadrant A | 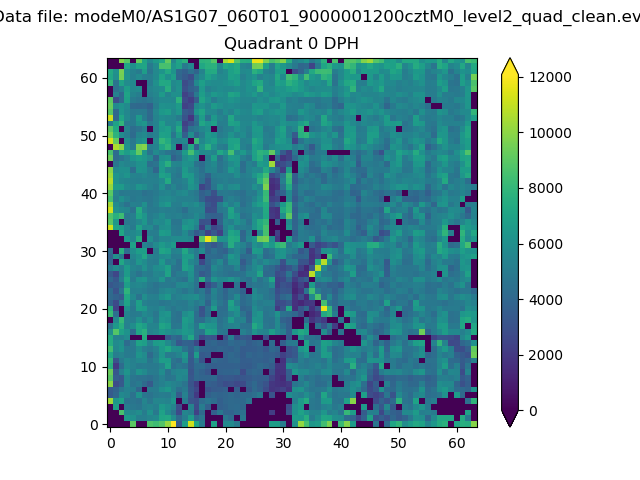 |
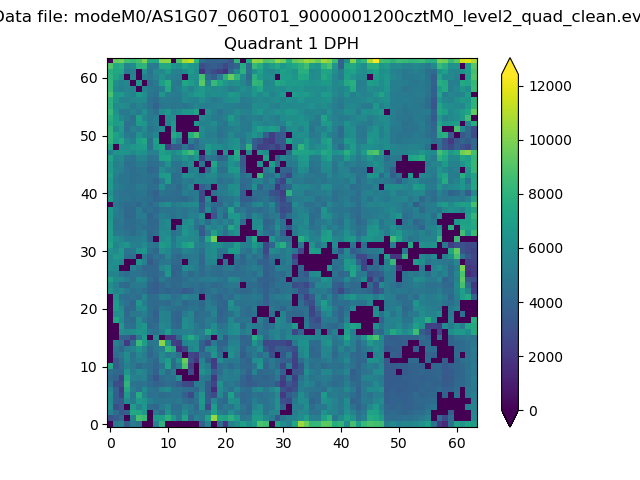 |
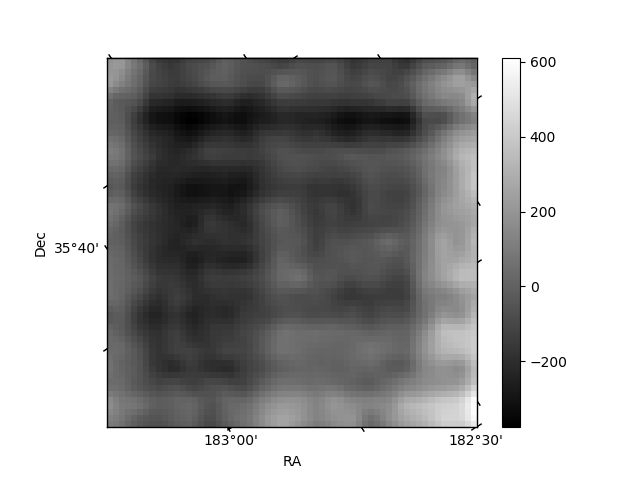
Quadrant B |
|---|---|---|---|
| Quadrant D | 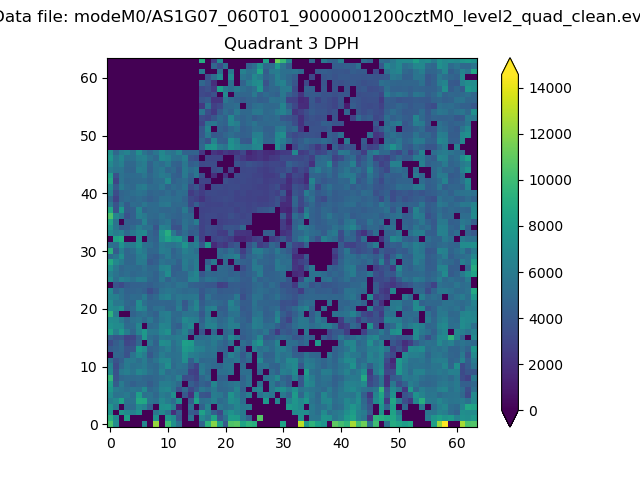 |
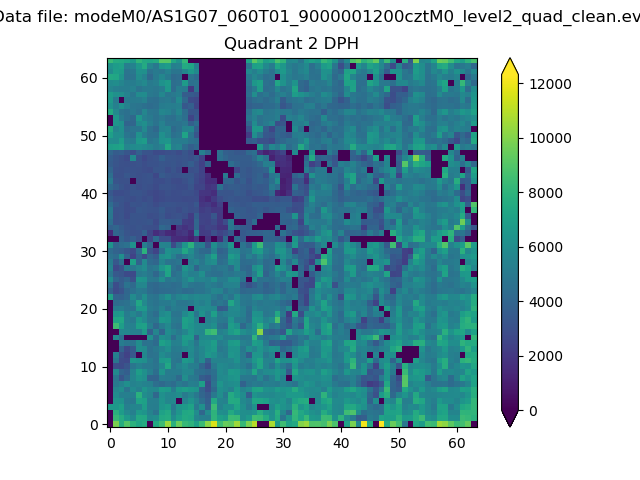 |
Quadrant C |
| Plot type | Count rate plots | Images |
|---|---|---|
| Comparison with Poisson distribution Blue bars denote a histogram of data divided into 1 sec bins. Red curve is a Poisson curve with rate = median count rate of data. |
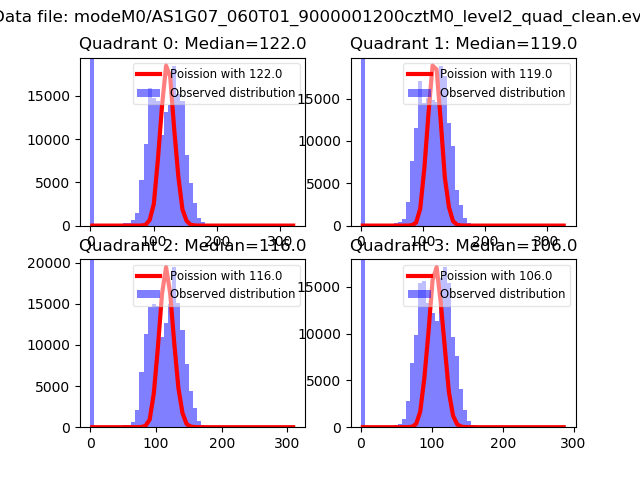 |
 |
| Quadrant-wise count rates Data is divided into 100 sec bins |
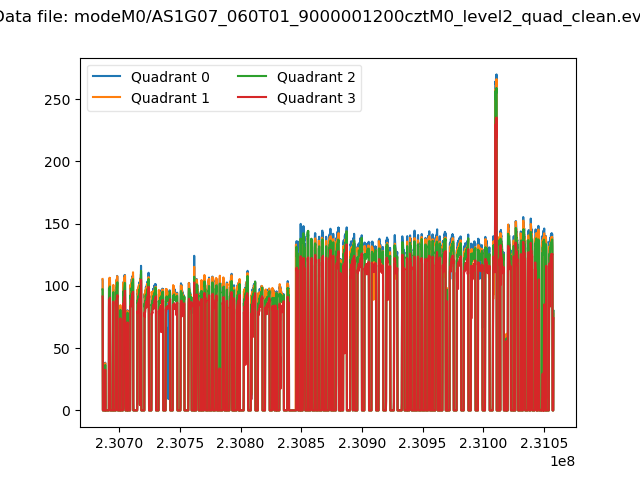 |
|
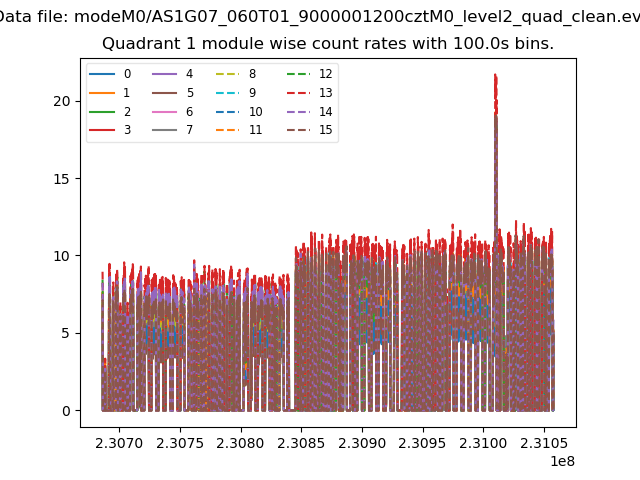
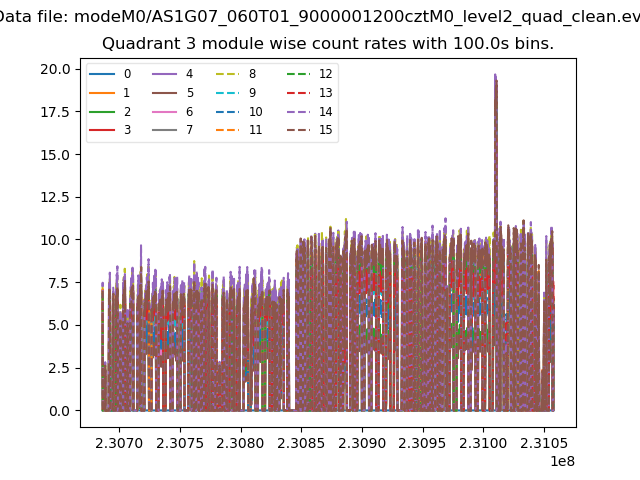
| Module-wise count rates for Quadrant A Data is divided into 100 sec bins |
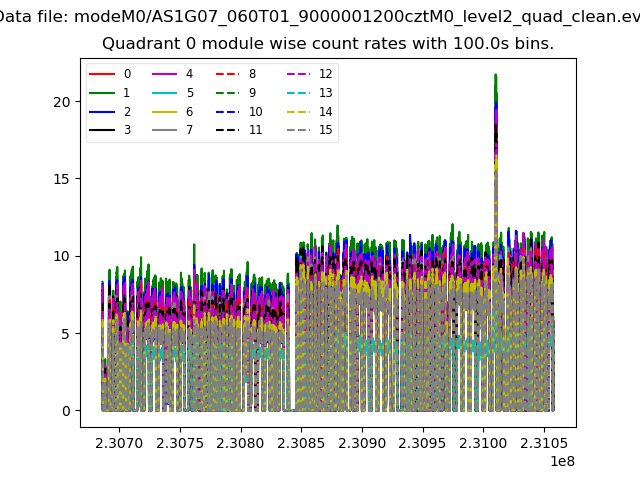 |
 |
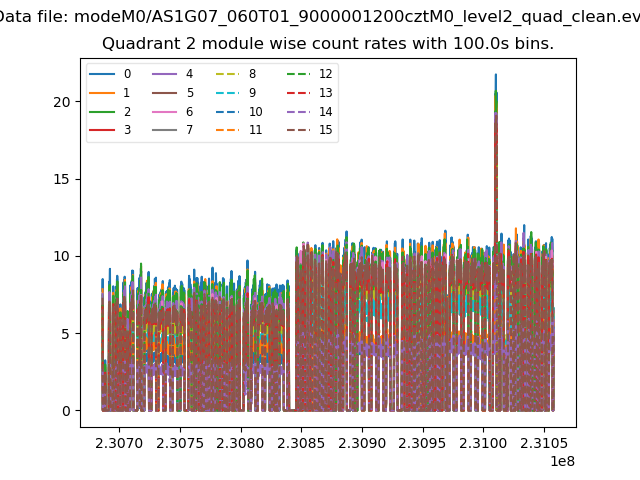
| Module-wise count rates for Quadrant B Data is divided into 100 sec bins |
 |
 |
| Module-wise count rates for Quadrant C Data is divided into 100 sec bins |
 |
 |
| Module-wise count rates for Quadrant D Data is divided into 100 sec bins |
 |
 |
| Parameter | Plot |
|---|---|
| CZT HV Monitor | 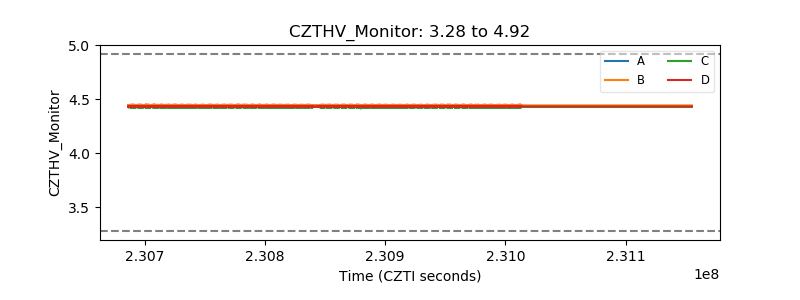 |
| D_VDD | 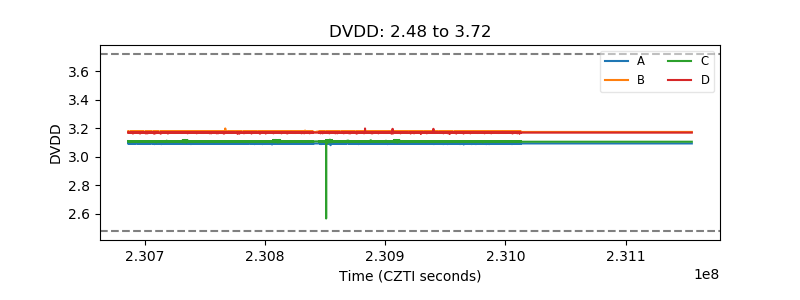 |
| Temperature 1 | 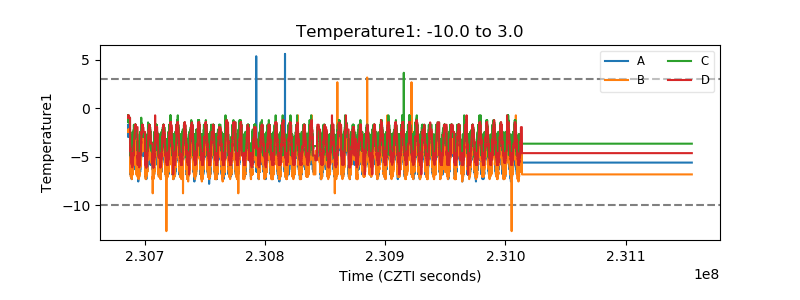 |
| Veto HV Monitor | 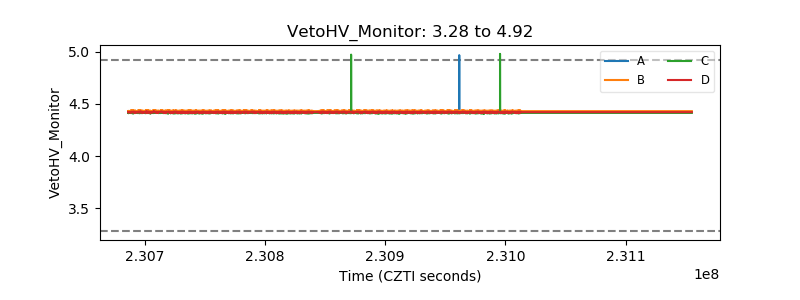 |
| Veto LLD | 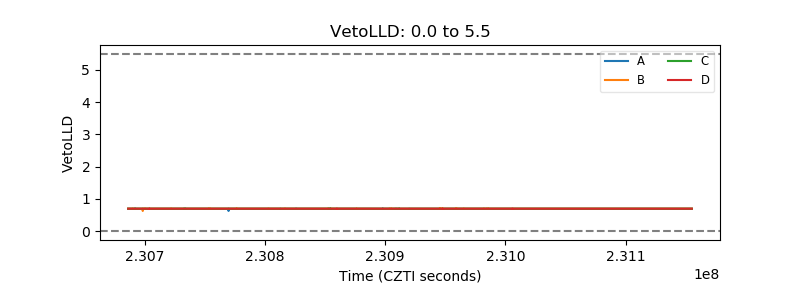 |
| Alpha Counter | 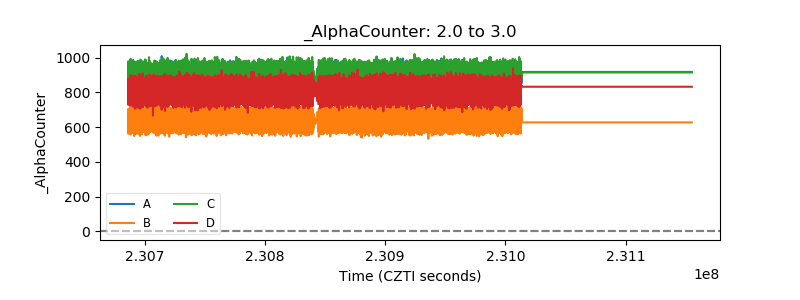 |
| _CPM_Rate | 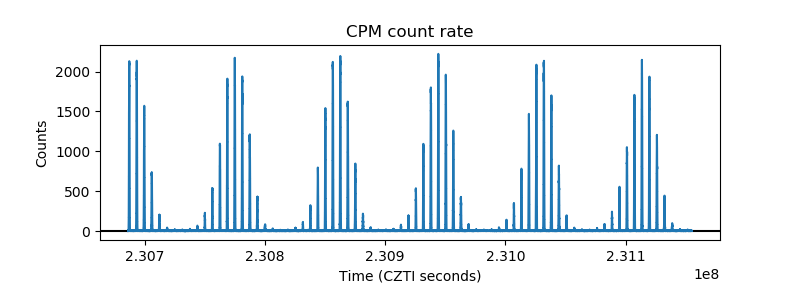 |
| CZT Counter | 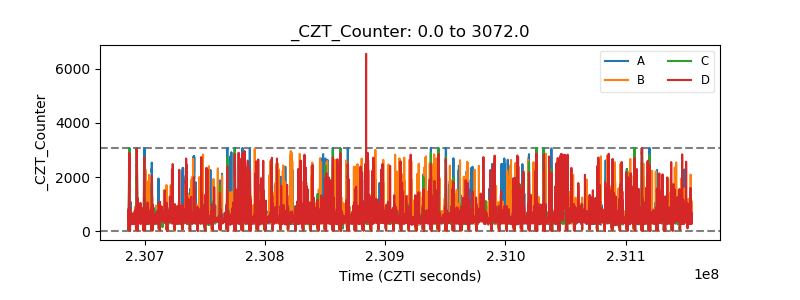 |
| +2.5 Volts monitor | 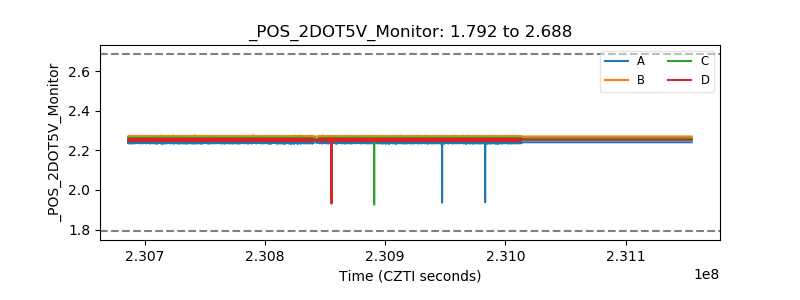 |
| +5 Volts monitor | 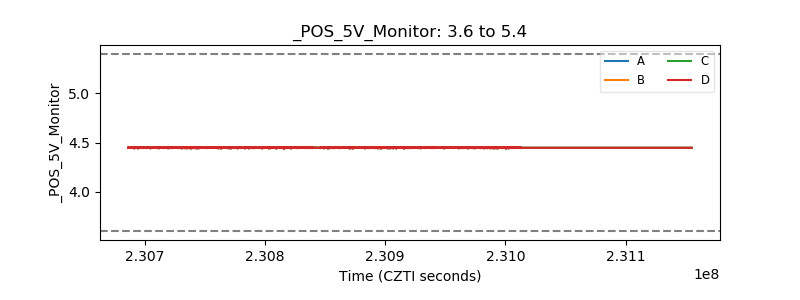 |
| _ROLL_ROT | 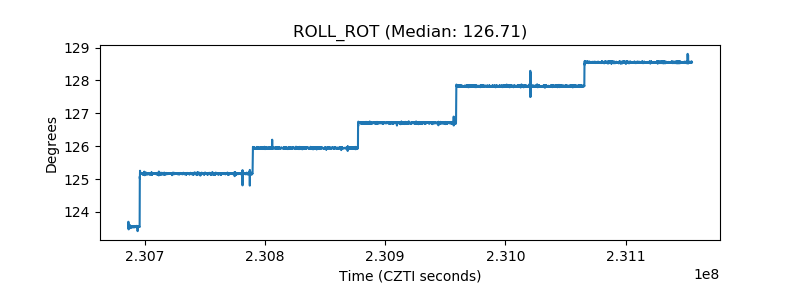 |
| _Roll_DEC | 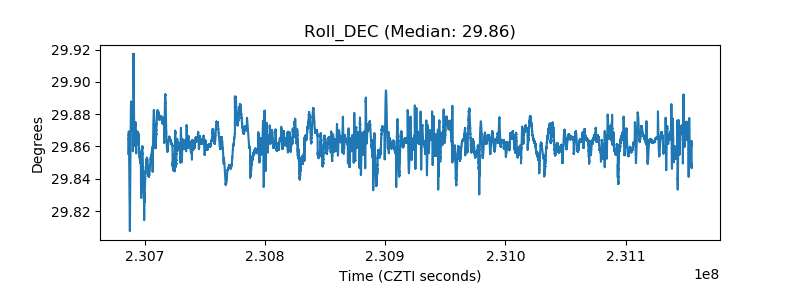 |
| _Roll_RA | 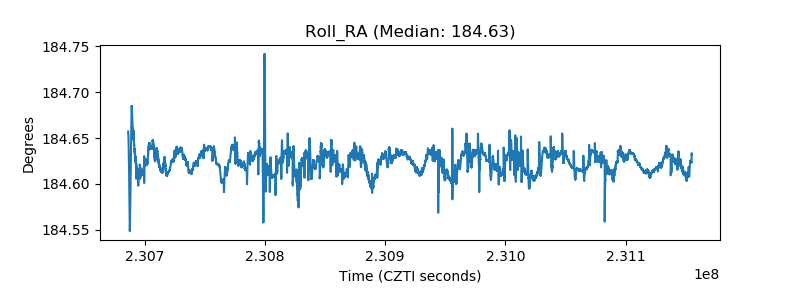 |
| Veto Counter | 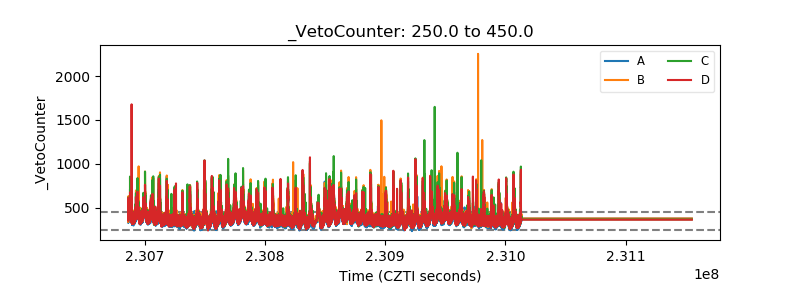 |