| Param | Original file | Final file |
|---|---|---|
| Filename | modeM0/AS1G07_060T01_9000001200_08495cztM0_level2.evt | modeM0/AS1G07_060T01_9000001200_08495cztM0_level2_quad_clean.evt |
| Size (bytes) | 399,012,480 | 87,451,200 |
| Size | 380.5 MB | 83.4 MB |
| Events in quadrant A | 2,877,824 | 557,794 |
| Events in quadrant B | 3,020,914 | 572,741 |
| Events in quadrant C | 2,831,464 | 554,203 |
| Events in quadrant D | 2,931,442 | 530,221 |
| Mode SS | |||
|---|---|---|---|
| Quadrant | BADHDUFLAG | Total packets | Discarded packets |
| A | 0 | 126 | 0 |
| B | 0 | 126 | 0 |
| C | 0 | 126 | 4 |
| D | 0 | 126 | 0 |
| Mode M0 | |||
|---|---|---|---|
| Quadrant | BADHDUFLAG | Total packets | Discarded packets |
| A | 0 | 12689 | 27 |
| B | 0 | 12980 | 32 |
| C | 0 | 12665 | 17 |
| D | 0 | 12946 | 23 |
| Mode M9 | |||
|---|---|---|---|
| Quadrant | BADHDUFLAG | Total packets | Discarded packets |
| A | 0 | 19 | 0 |
| B | 0 | 19 | 0 |
| C | 0 | 19 | 0 |
| D | 0 | 20 | 0 |
| Quadrant | Total seconds | Saturated seconds | Saturation percentage |
|---|---|---|---|
| A | 6211 | 14 | 0.225407% |
| B | 6208 | 16 | 0.257732% |
| C | 6216 | 7 | 0.112613% |
| D | 6213 | 10 | 0.160953% |
Noise dominated data is calculated using 1-second bins in cleaned event files. If a bin has >2000 counts, and if more than 50% of those come from <1% of pixels, then it is considered to be noise-dominated and hence unusable.
| Quadrant | # 1 sec bins | Bins with >0 counts | Bins with >2000 counts | High rate bins dominated by noise | Noise dominated (total time) | Noise dominated (detector-on time) | Marked lightcurve |
|---|---|---|---|---|---|---|---|
| A | 7533 | 6224 | 0 | 0 | 0.00% | 0.00% | 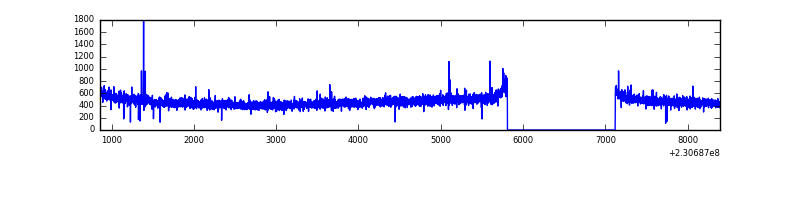 |
| B | 7533 | 6224 | 1 | 1 | 0.01% | 0.02% | 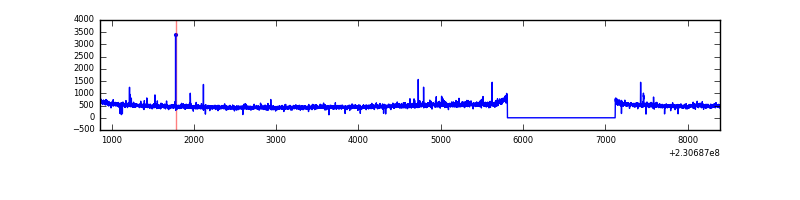 |
| C | 7533 | 6224 | 0 | 0 | 0.00% | 0.00% | 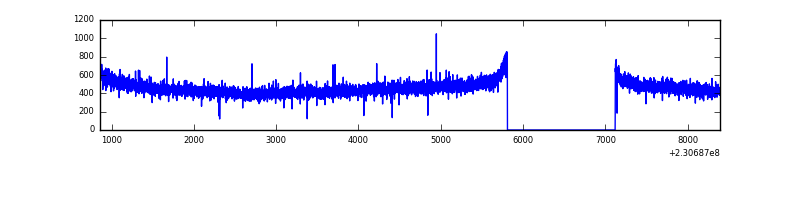 |
| D | 7533 | 6224 | 2 | 2 | 0.03% | 0.03% | 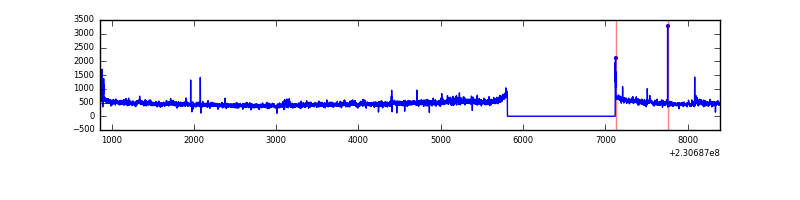 |
Top three noisy pixels from each quadrant. If the there are fewer than three noisy pixels in the level2.evt file, extra rows are filled as -1
| Pixel properties | Quadrant properties | ||||||
|---|---|---|---|---|---|---|---|
| Quadrant | DetID | PixID | Counts | Sigma | Mean | Median | Sigma |
| A | 13 | 251 | 10671 | 65.95 | 743 | 728 | 150.8 |
| A | 5 | 16 | 10143 | 62.45 | 743 | 728 | 150.8 |
| A | 0 | 226 | 6939 | 41.2 | 743 | 728 | 150.8 |
| B | 0 | 214 | 75405 | 523.42 | 752 | 735 | 142.7 |
| B | 12 | 111 | 15584 | 104.09 | 752 | 735 | 142.7 |
| B | 5 | 255 | 14204 | 94.41 | 752 | 735 | 142.7 |
| C | 13 | 61 | 5587 | 29.02 | 724 | 729 | 167.4 |
| C | 12 | 4 | 3467 | 16.35 | 724 | 729 | 167.4 |
| C | 8 | 222 | 2895 | 12.94 | 724 | 729 | 167.4 |
| D | 1 | 52 | 126064 | 724.83 | 710 | 693 | 173.0 |
| D | 8 | 195 | 70341 | 402.67 | 710 | 693 | 173.0 |
| D | 2 | 234 | 18148 | 100.92 | 710 | 693 | 173.0 |
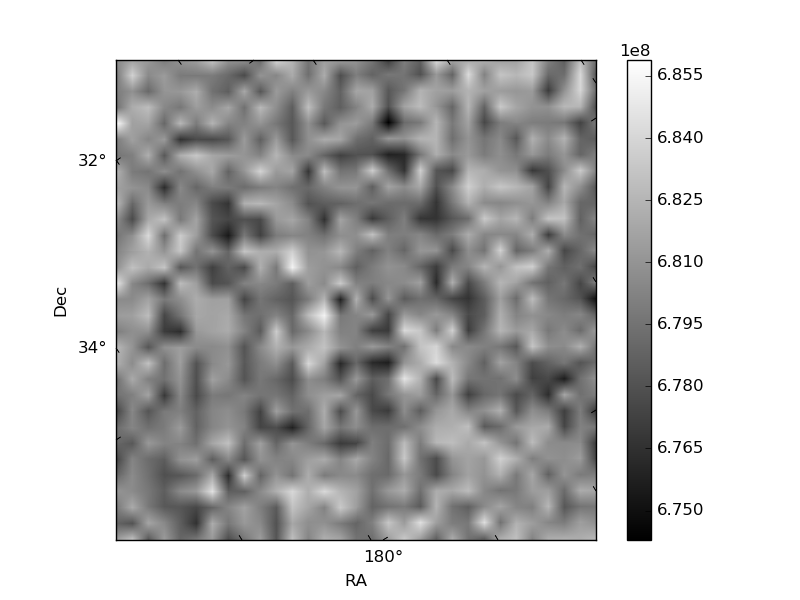
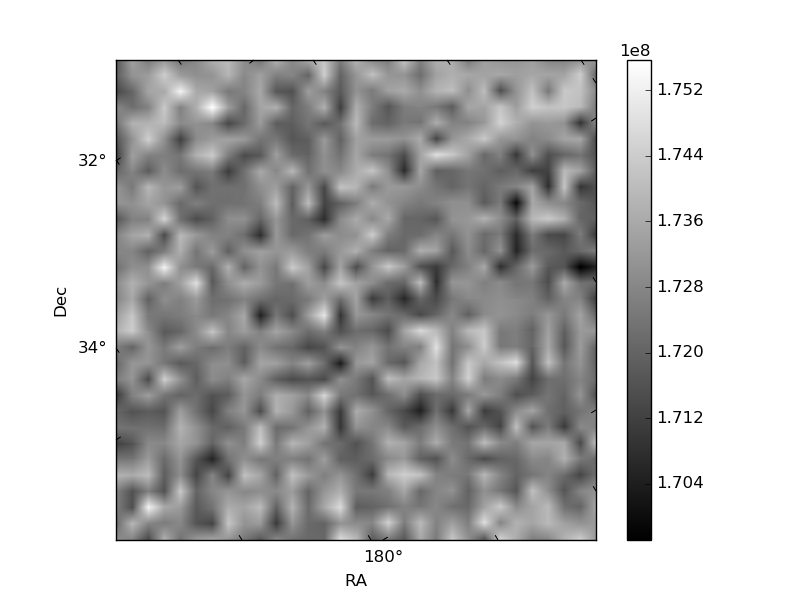
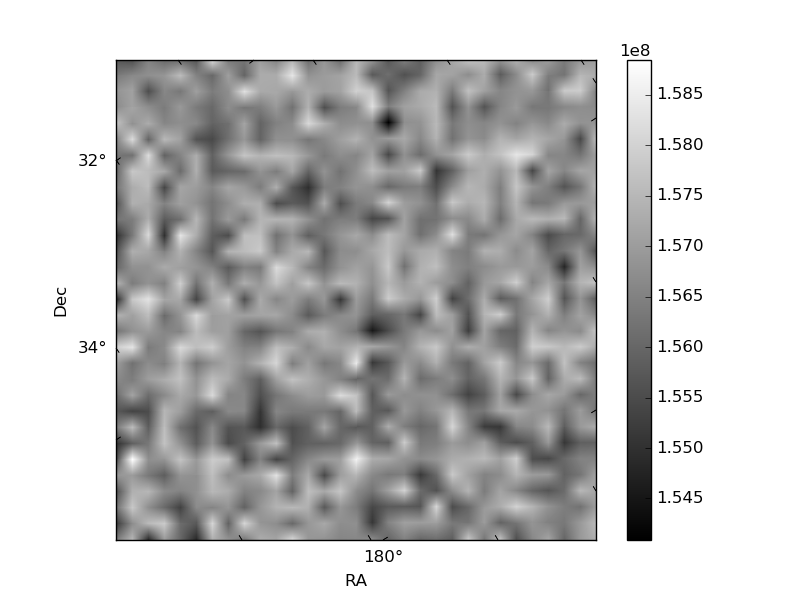
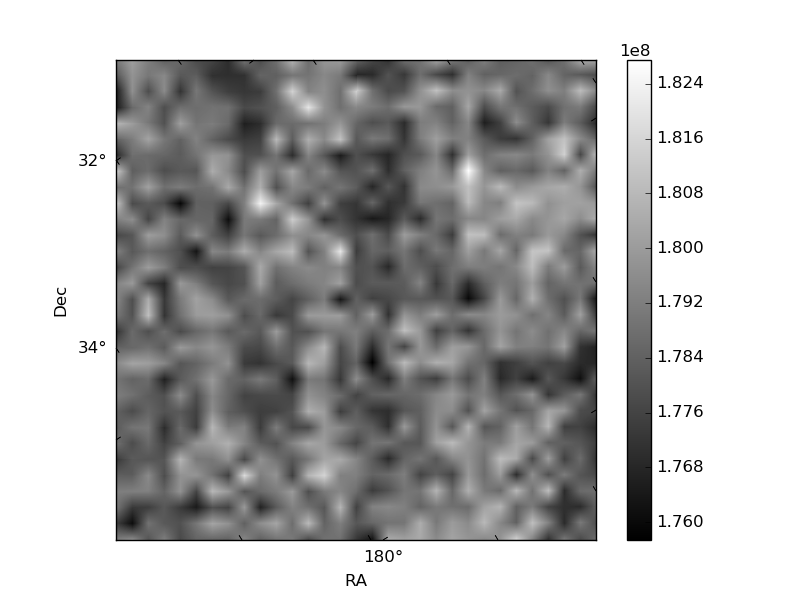
Histogram calculated using DETX and DETY for each event in the final _common_clean file
| Quadrant A | 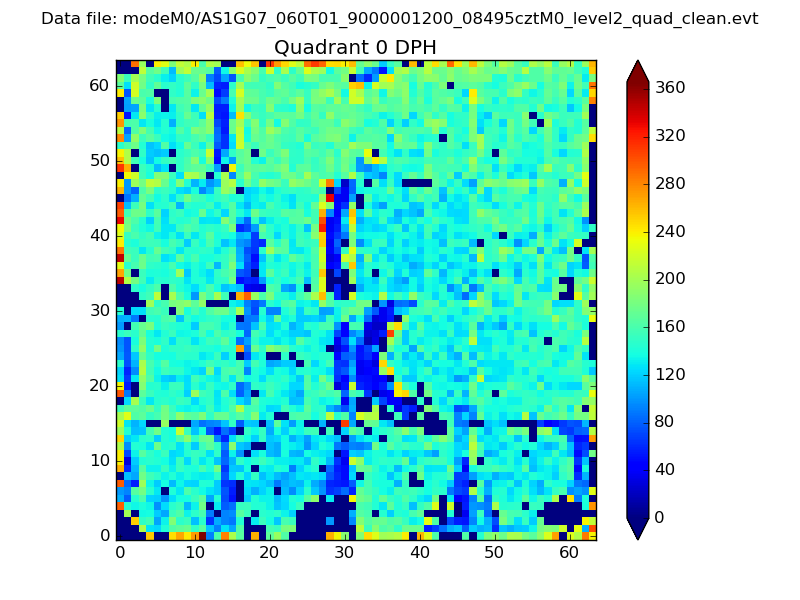 |
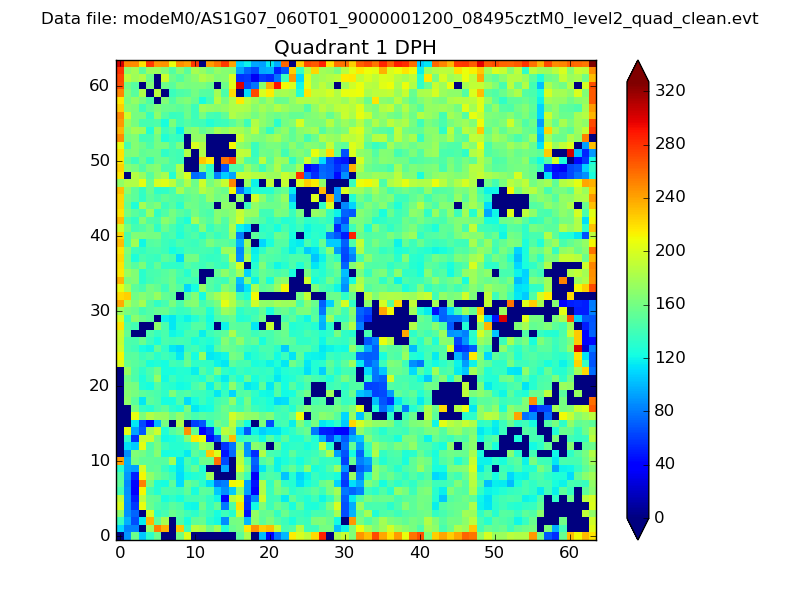 |
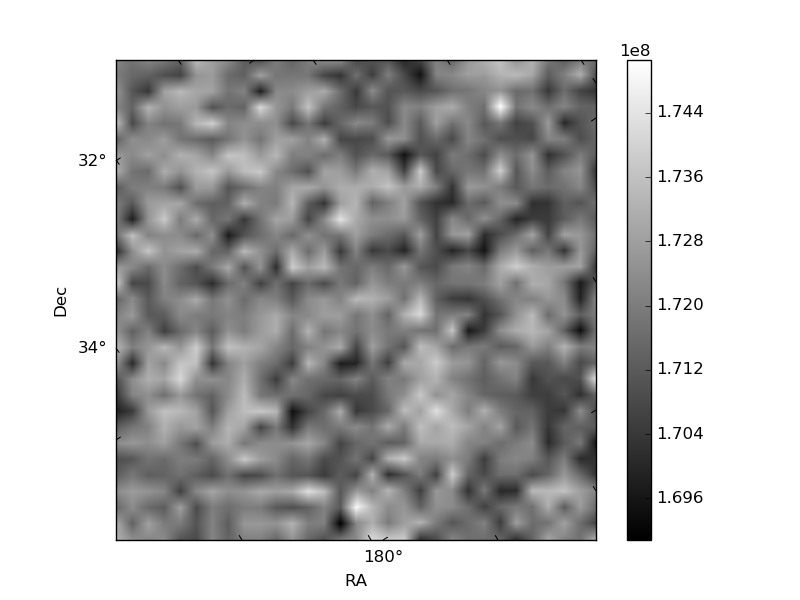
Quadrant B |
|---|---|---|---|
| Quadrant D | 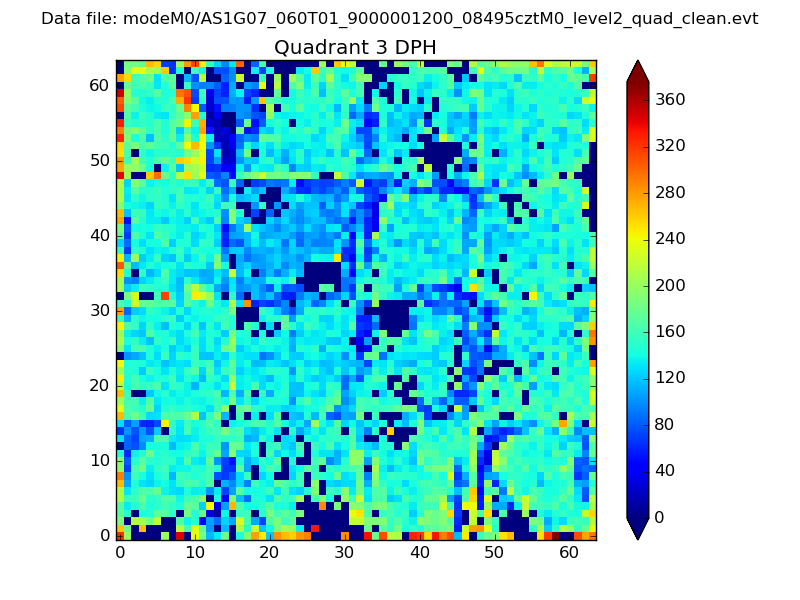 |
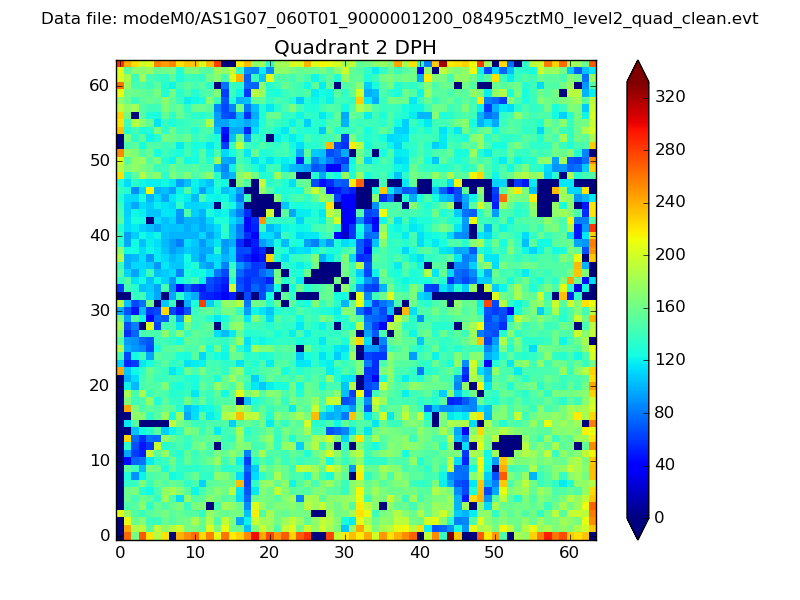 |
Quadrant C |
| Plot type | Count rate plots | Images |
|---|---|---|
| Comparison with Poisson distribution Blue bars denote a histogram of data divided into 1 sec bins. Red curve is a Poisson curve with rate = median count rate of data. |
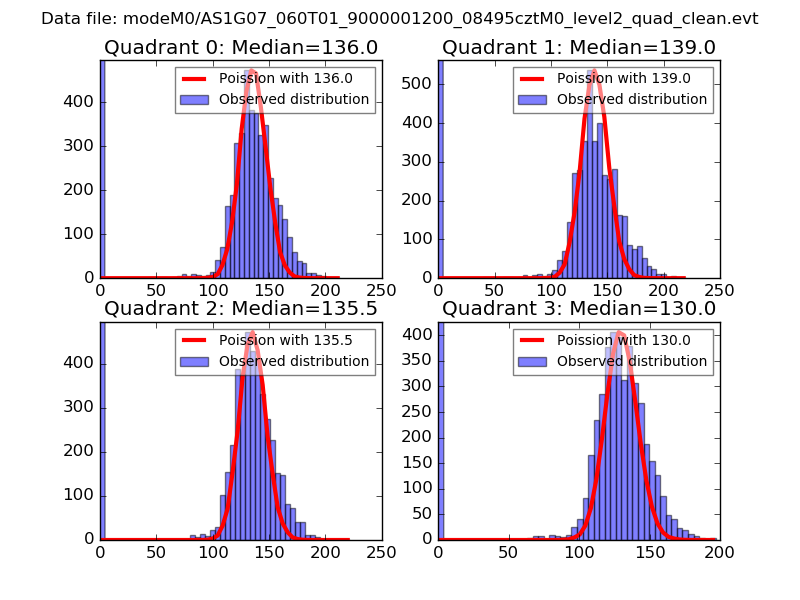 |
 |
| Quadrant-wise count rates Data is divided into 100 sec bins |
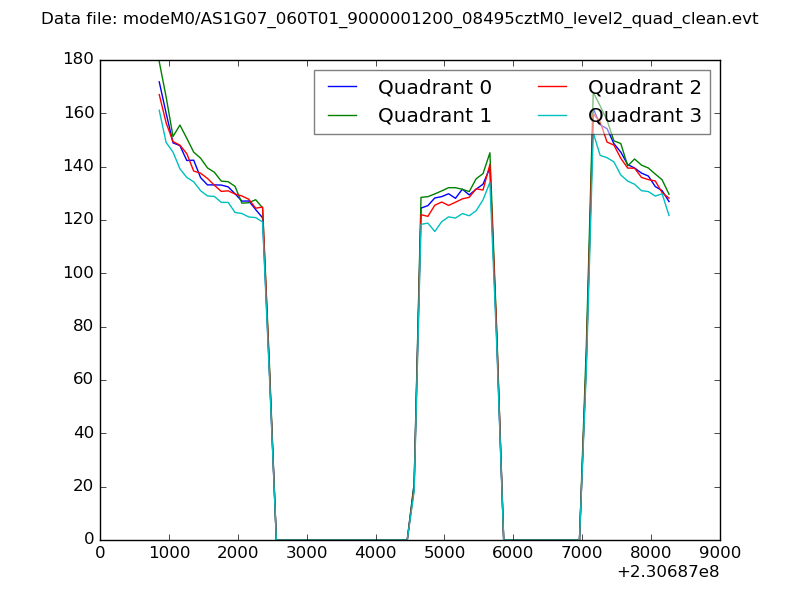 |
|
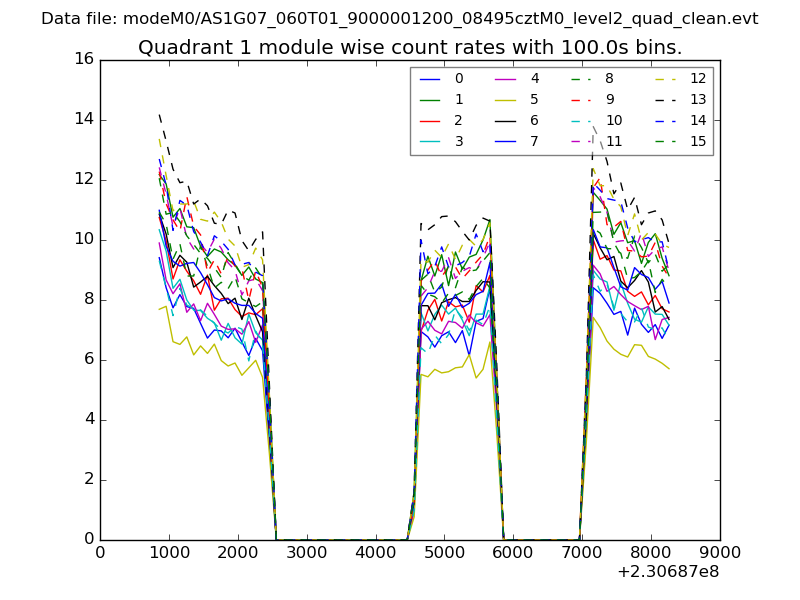
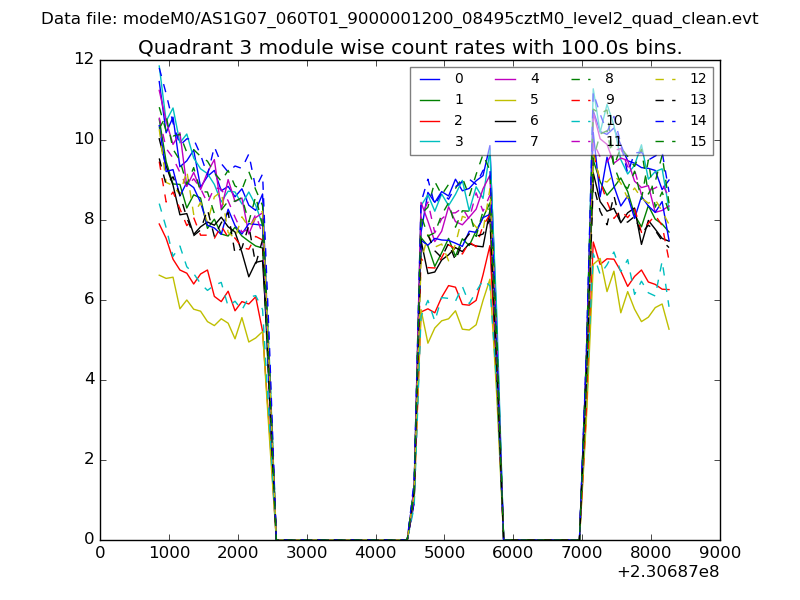
| Module-wise count rates for Quadrant A Data is divided into 100 sec bins |
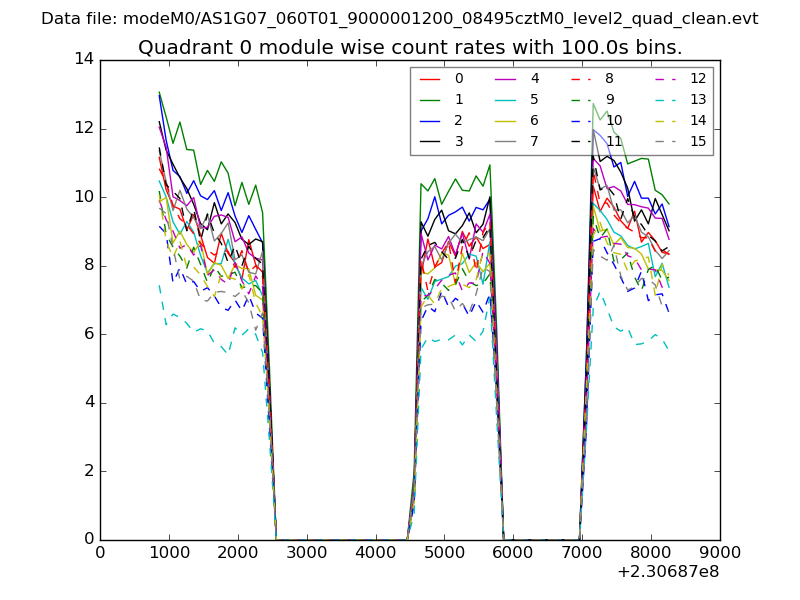 |
 |
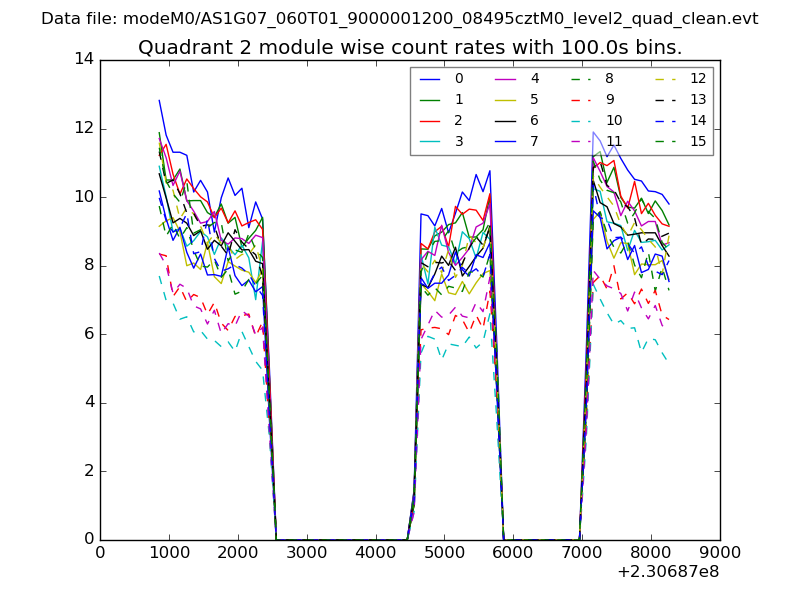
| Module-wise count rates for Quadrant B Data is divided into 100 sec bins |
 |
 |
| Module-wise count rates for Quadrant C Data is divided into 100 sec bins |
 |
 |
| Module-wise count rates for Quadrant D Data is divided into 100 sec bins |
 |
 |
| Parameter | Plot |
|---|---|
| CZT HV Monitor | 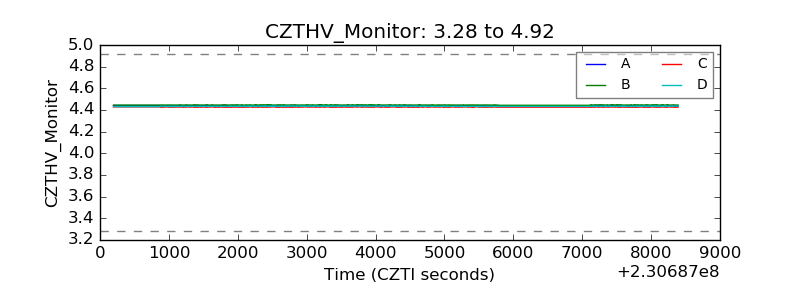 |
| D_VDD | 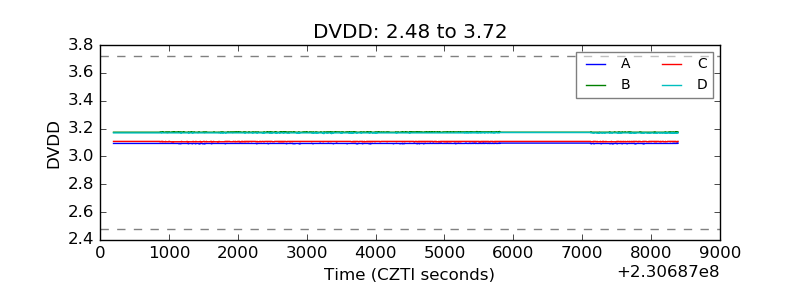 |
| Temperature 1 | 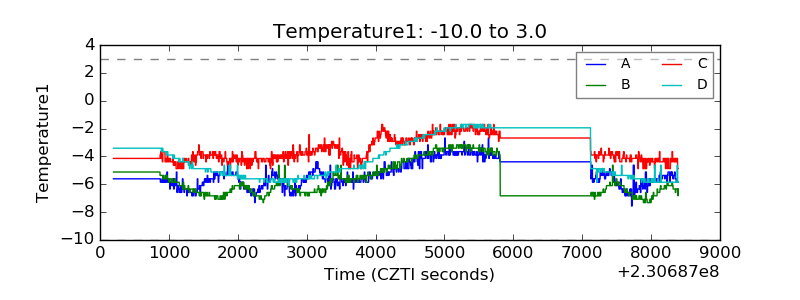 |
| Veto HV Monitor | 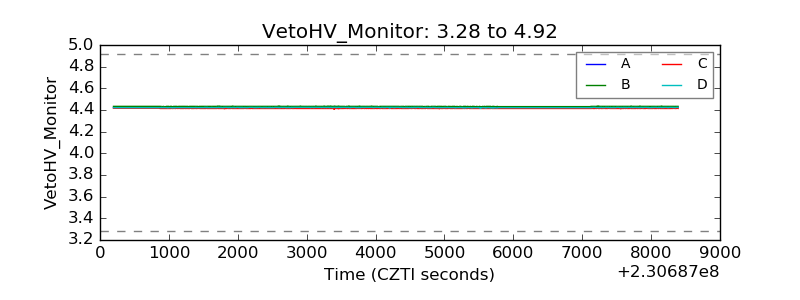 |
| Veto LLD | 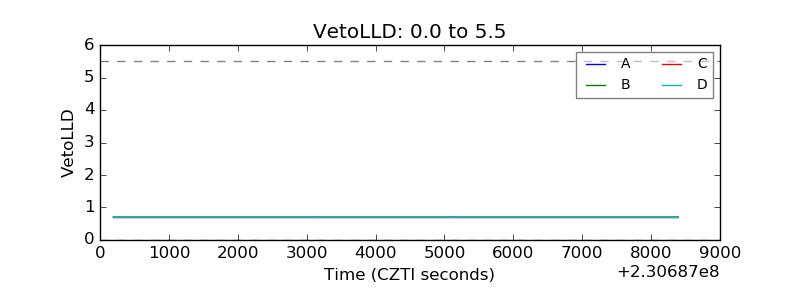 |
| Alpha Counter | 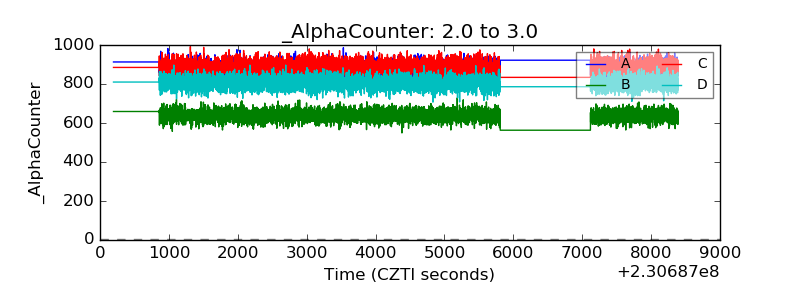 |
| _CPM_Rate | 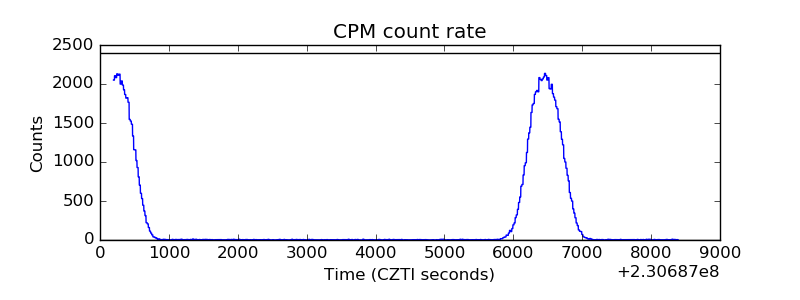 |
| CZT Counter | 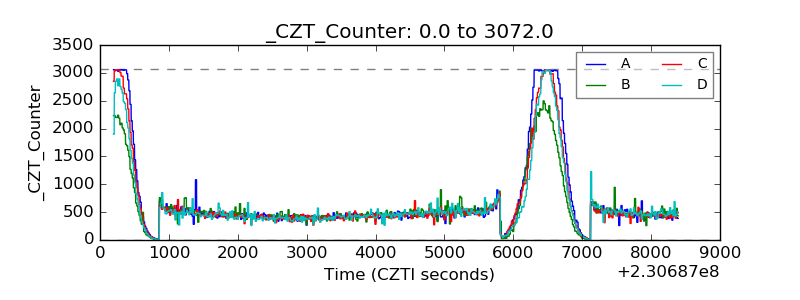 |
| +2.5 Volts monitor |  |
| +5 Volts monitor | 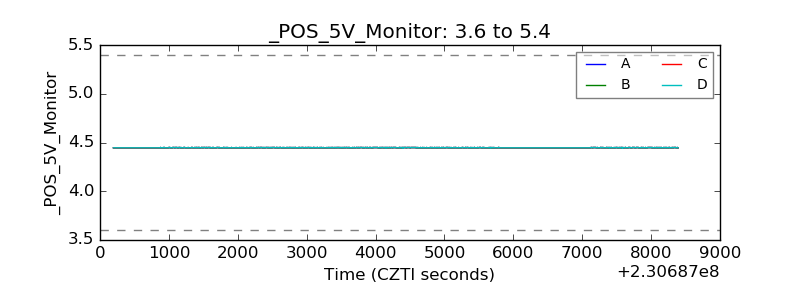 |
| _ROLL_ROT | 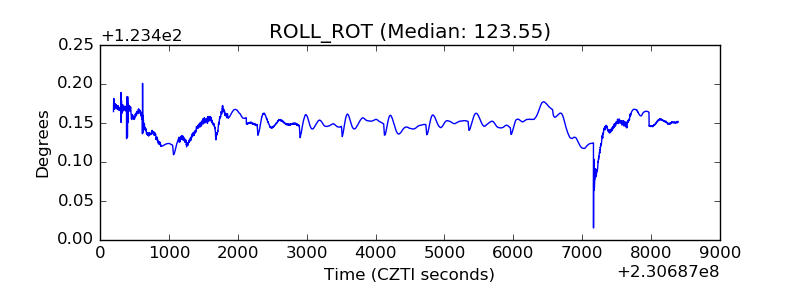 |
| _Roll_DEC | 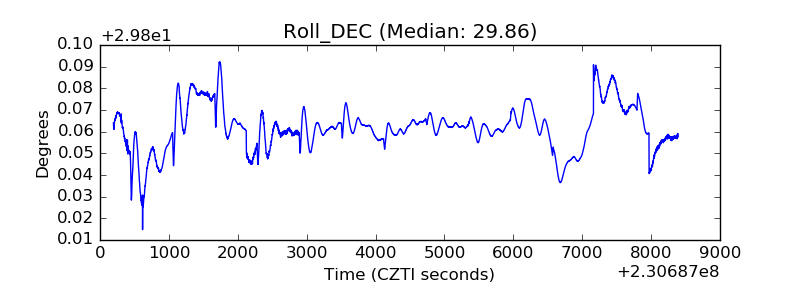 |
| _Roll_RA | 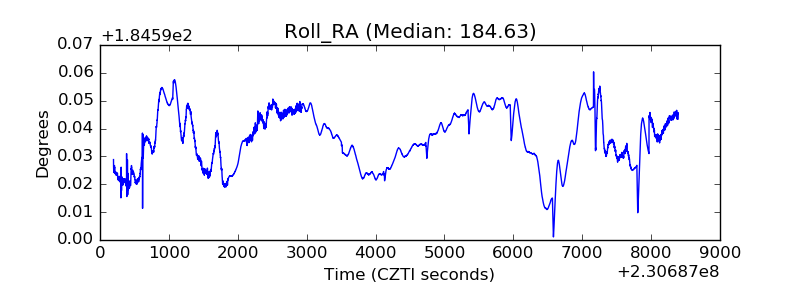 |
| Veto Counter | 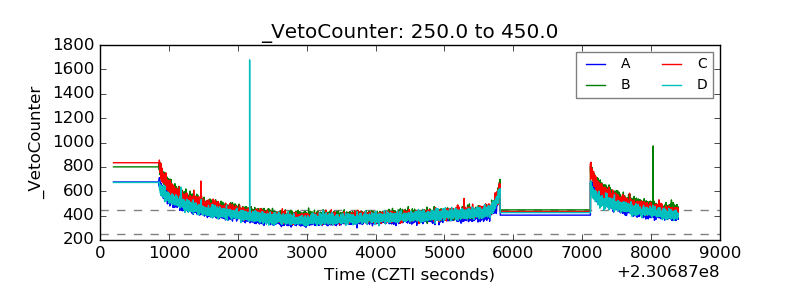 |