| Param | Original file | Final file |
|---|---|---|
| Filename | modeM0/AS1G07_060T01_9000001200_08496cztM0_level2.evt | modeM0/AS1G07_060T01_9000001200_08496cztM0_level2_quad_clean.evt |
| Size (bytes) | 409,455,360 | 82,673,280 |
| Size | 390.5 MB | 78.8 MB |
| Events in quadrant A | 2,915,448 | 526,038 |
| Events in quadrant B | 3,139,376 | 532,513 |
| Events in quadrant C | 2,864,140 | 518,852 |
| Events in quadrant D | 3,062,822 | 496,689 |
| Mode SS | |||
|---|---|---|---|
| Quadrant | BADHDUFLAG | Total packets | Discarded packets |
| A | 0 | 128 | 2 |
| B | 0 | 128 | 2 |
| C | 0 | 128 | 2 |
| D | 0 | 128 | 0 |
| Mode M0 | |||
|---|---|---|---|
| Quadrant | BADHDUFLAG | Total packets | Discarded packets |
| A | 0 | 12816 | 137 |
| B | 0 | 13365 | 175 |
| C | 0 | 12816 | 133 |
| D | 0 | 13129 | 178 |
| Mode M9 | |||
|---|---|---|---|
| Quadrant | BADHDUFLAG | Total packets | Discarded packets |
| A | 0 | 26 | 0 |
| B | 0 | 26 | 0 |
| C | 0 | 26 | 0 |
| D | 0 | 26 | 0 |
| Quadrant | Total seconds | Saturated seconds | Saturation percentage |
|---|---|---|---|
| A | 6162 | 18 | 0.292113% |
| B | 6145 | 56 | 0.911310% |
| C | 6161 | 11 | 0.178542% |
| D | 6143 | 15 | 0.244180% |
Noise dominated data is calculated using 1-second bins in cleaned event files. If a bin has >2000 counts, and if more than 50% of those come from <1% of pixels, then it is considered to be noise-dominated and hence unusable.
| Quadrant | # 1 sec bins | Bins with >0 counts | Bins with >2000 counts | High rate bins dominated by noise | Noise dominated (total time) | Noise dominated (detector-on time) | Marked lightcurve |
|---|---|---|---|---|---|---|---|
| A | 8857 | 6224 | 0 | 0 | 0.00% | 0.00% | 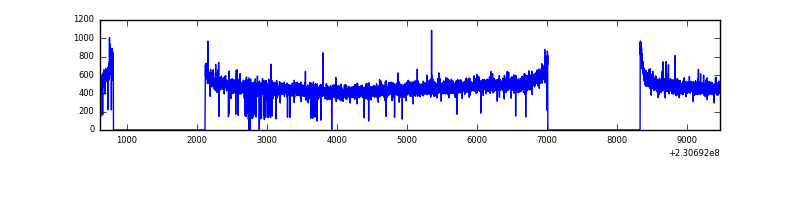 |
| B | 8857 | 6223 | 24 | 24 | 0.27% | 0.39% | 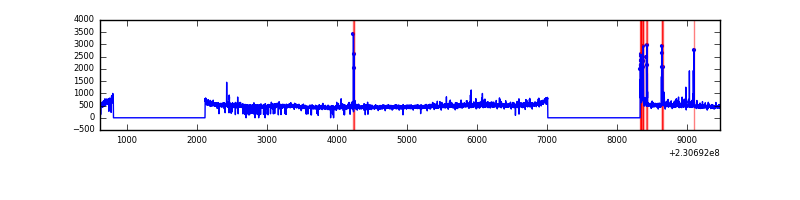 |
| C | 8857 | 6223 | 0 | 0 | 0.00% | 0.00% | 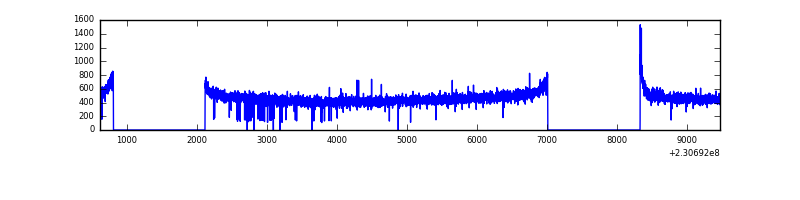 |
| D | 8856 | 6222 | 3 | 3 | 0.03% | 0.05% | 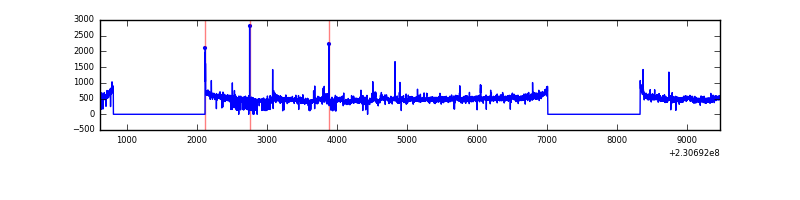 |
Top three noisy pixels from each quadrant. If the there are fewer than three noisy pixels in the level2.evt file, extra rows are filled as -1
| Pixel properties | Quadrant properties | ||||||
|---|---|---|---|---|---|---|---|
| Quadrant | DetID | PixID | Counts | Sigma | Mean | Median | Sigma |
| A | 0 | 226 | 7042 | 41.27 | 756 | 740 | 152.7 |
| A | 12 | 194 | 6589 | 38.31 | 756 | 740 | 152.7 |
| A | 13 | 251 | 5208 | 29.26 | 756 | 740 | 152.7 |
| B | 4 | 173 | 124610 | 863.67 | 757 | 741 | 143.4 |
| B | 0 | 214 | 69557 | 479.81 | 757 | 741 | 143.4 |
| B | 12 | 111 | 15742 | 104.59 | 757 | 741 | 143.4 |
| C | 12 | 4 | 6250 | 32.5 | 732 | 737 | 169.6 |
| C | 13 | 61 | 5647 | 28.94 | 732 | 737 | 169.6 |
| C | 8 | 222 | 2870 | 12.57 | 732 | 737 | 169.6 |
| D | 1 | 52 | 252087 | 1463.09 | 719 | 703 | 171.8 |
| D | 8 | 195 | 30081 | 170.98 | 719 | 703 | 171.8 |
| D | 2 | 234 | 17398 | 97.17 | 719 | 703 | 171.8 |
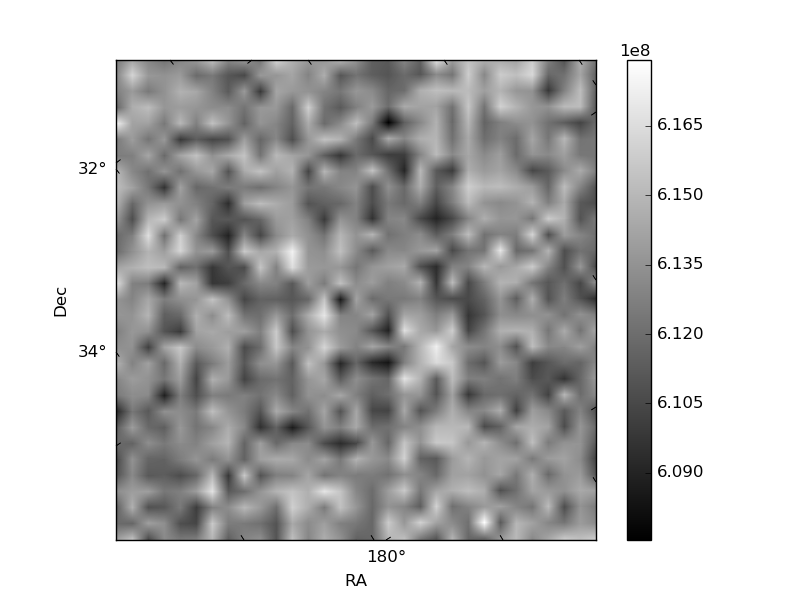
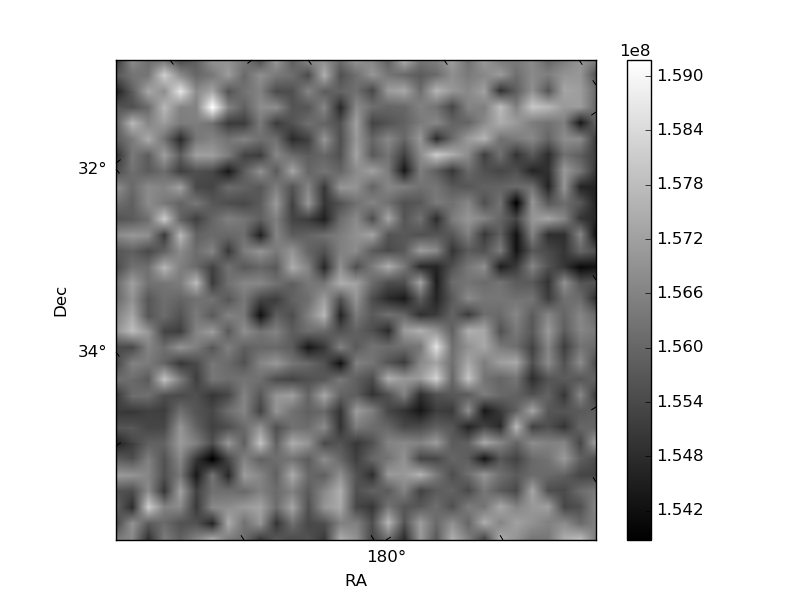
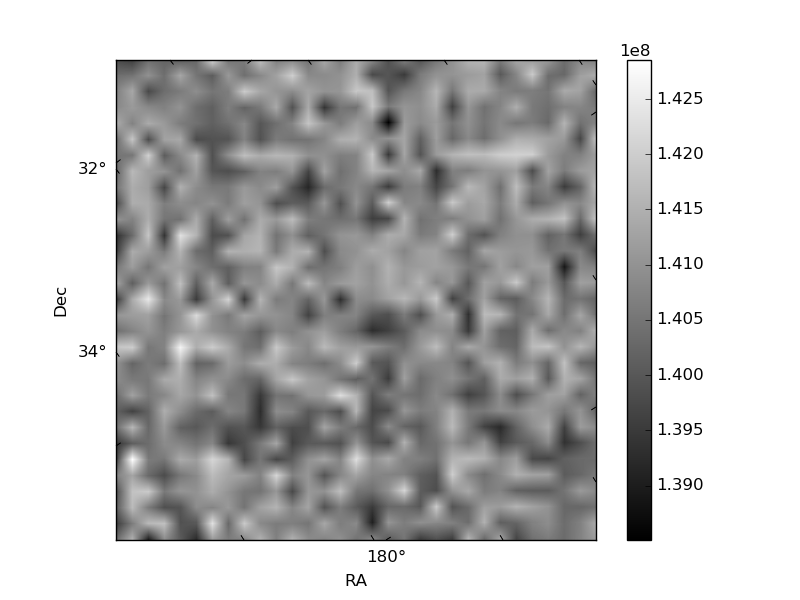
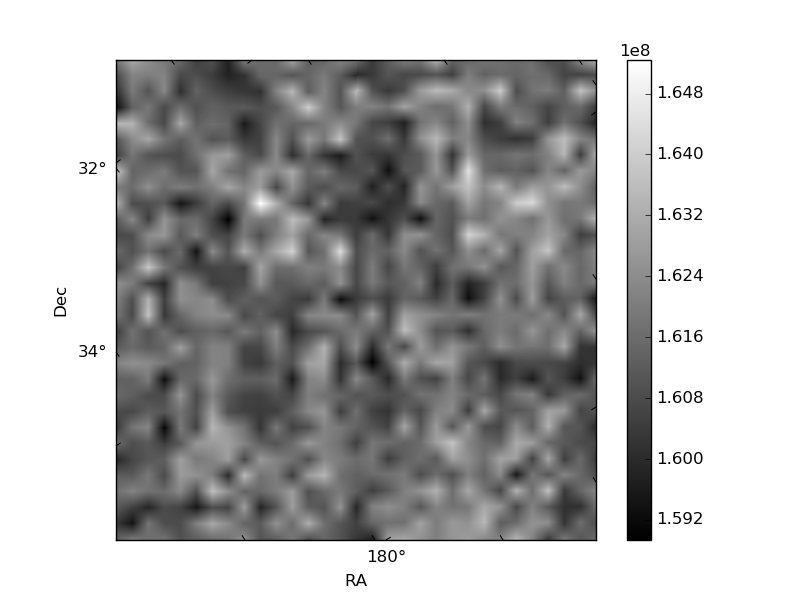
Histogram calculated using DETX and DETY for each event in the final _common_clean file
| Quadrant A | 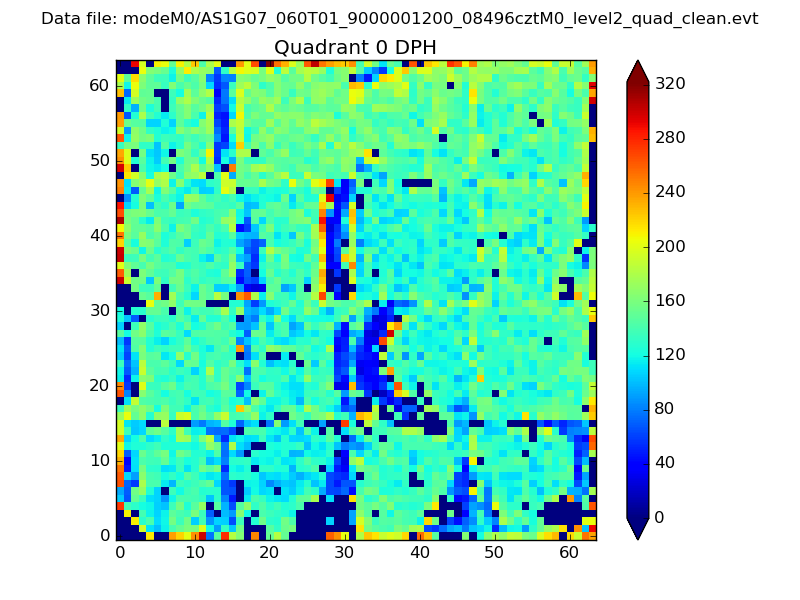 |
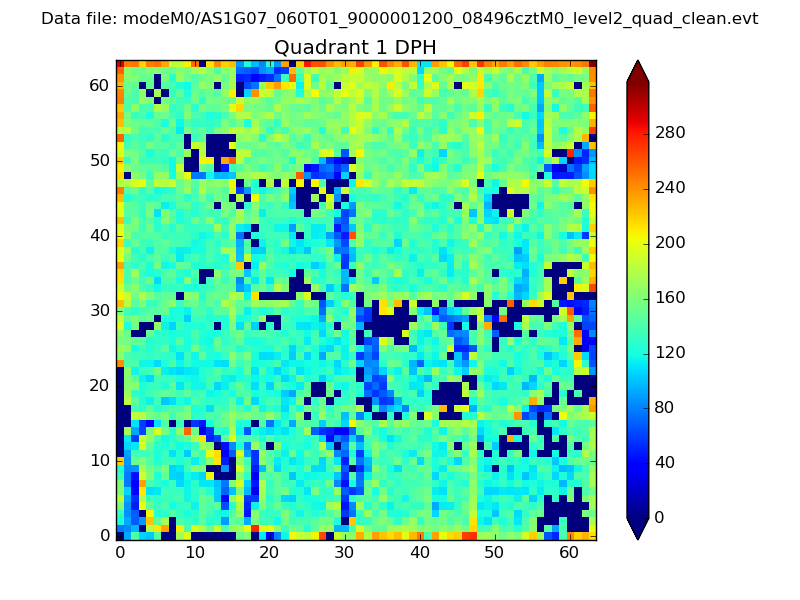 |
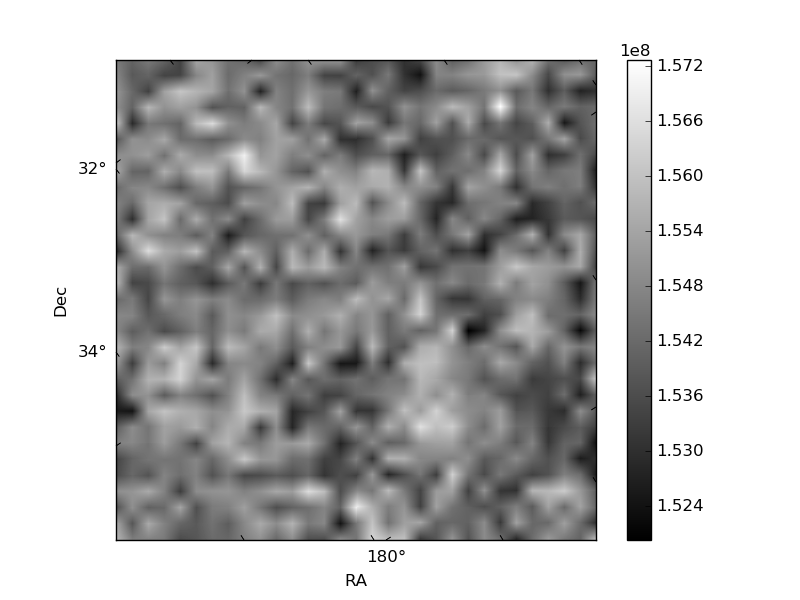
Quadrant B |
|---|---|---|---|
| Quadrant D | 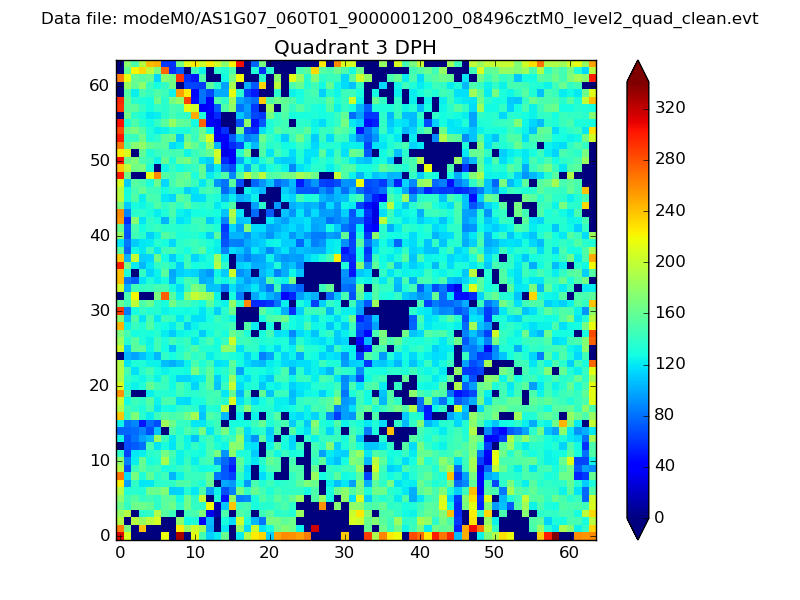 |
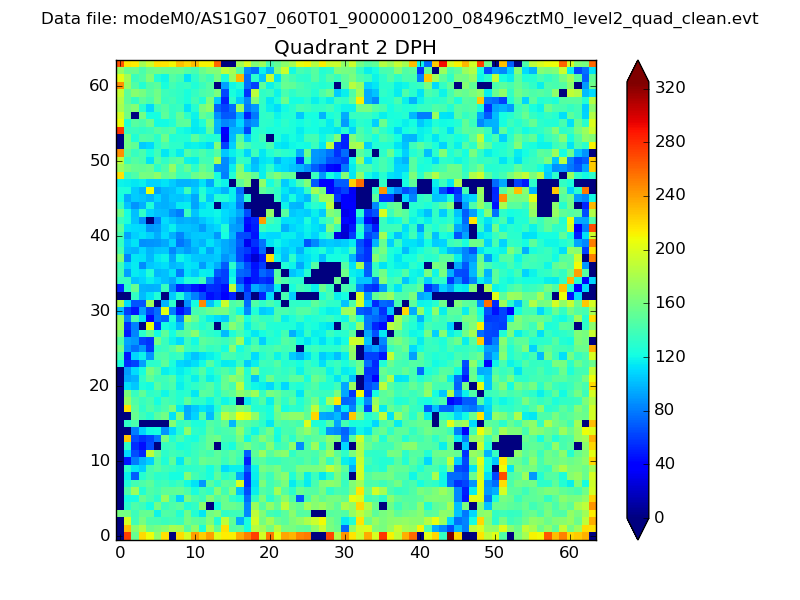 |
Quadrant C |
| Plot type | Count rate plots | Images |
|---|---|---|
| Comparison with Poisson distribution Blue bars denote a histogram of data divided into 1 sec bins. Red curve is a Poisson curve with rate = median count rate of data. |
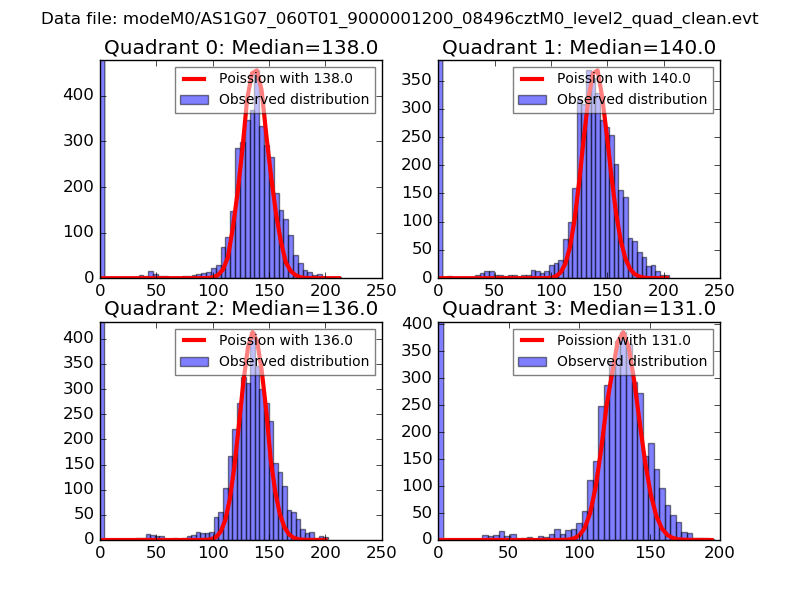 |
 |
| Quadrant-wise count rates Data is divided into 100 sec bins |
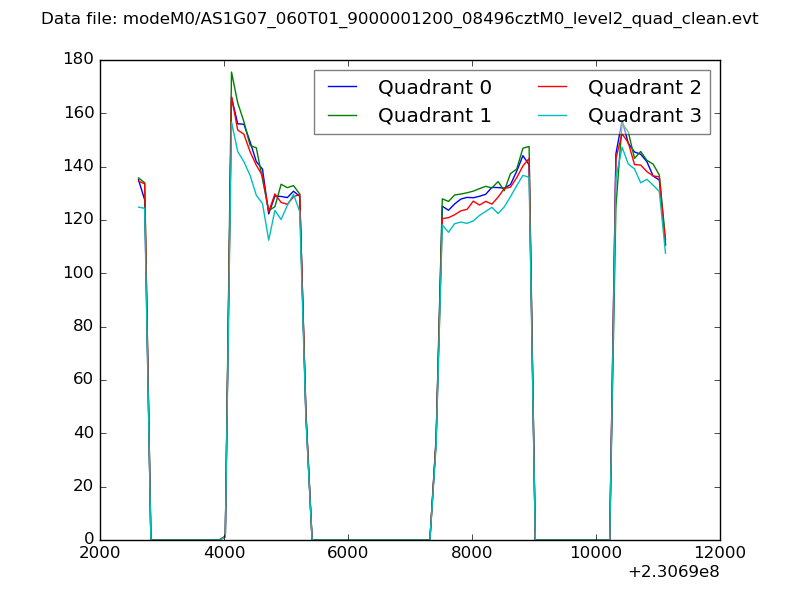 |
|
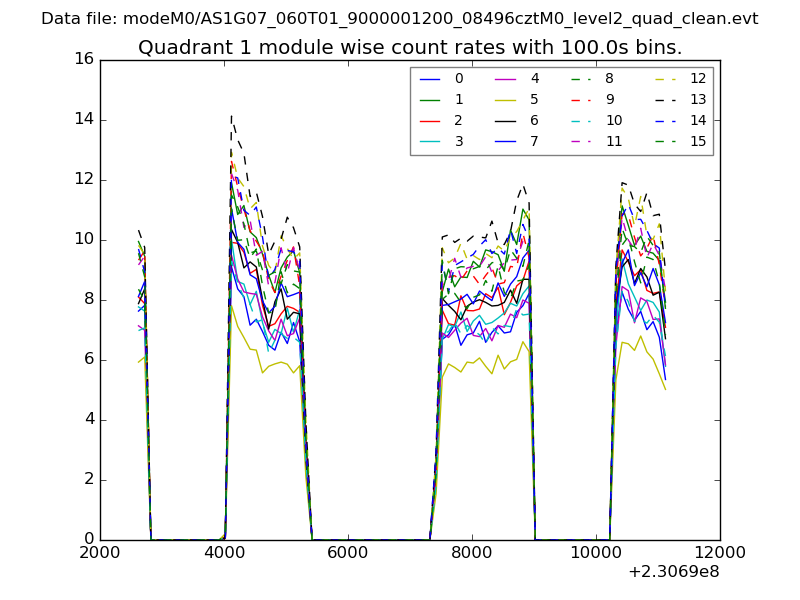
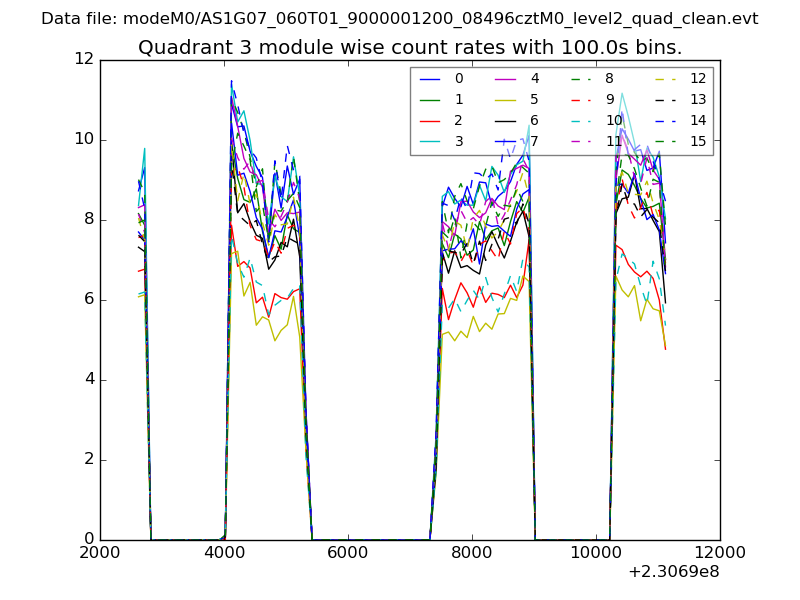
| Module-wise count rates for Quadrant A Data is divided into 100 sec bins |
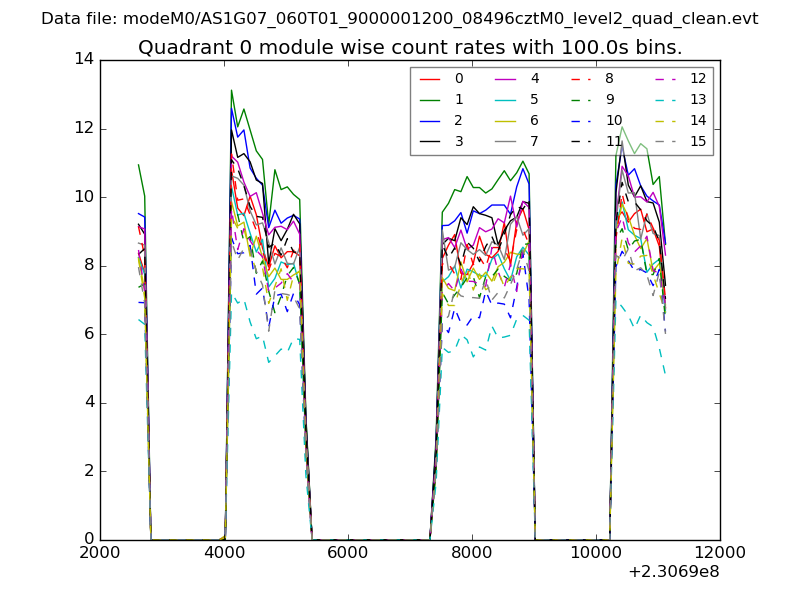 |
 |
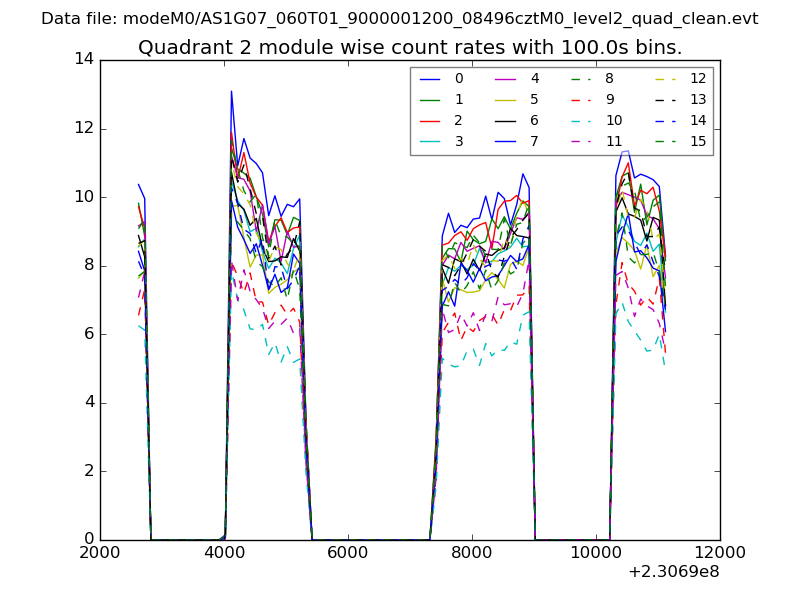
| Module-wise count rates for Quadrant B Data is divided into 100 sec bins |
 |
 |
| Module-wise count rates for Quadrant C Data is divided into 100 sec bins |
 |
 |
| Module-wise count rates for Quadrant D Data is divided into 100 sec bins |
 |
 |
| Parameter | Plot |
|---|---|
| CZT HV Monitor | 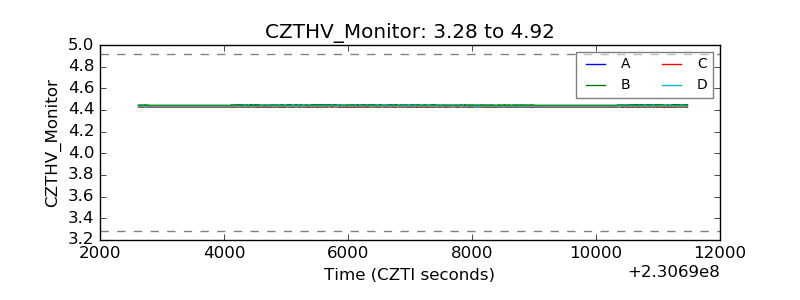 |
| D_VDD | 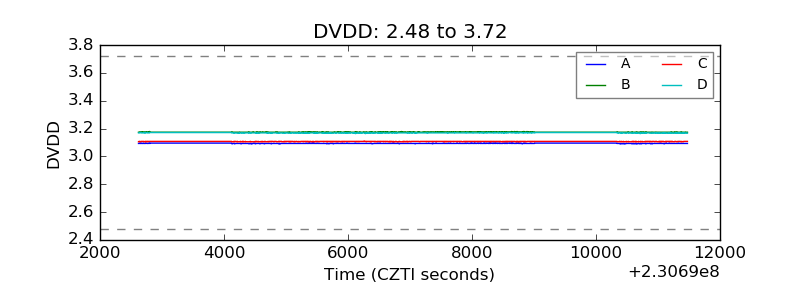 |
| Temperature 1 | 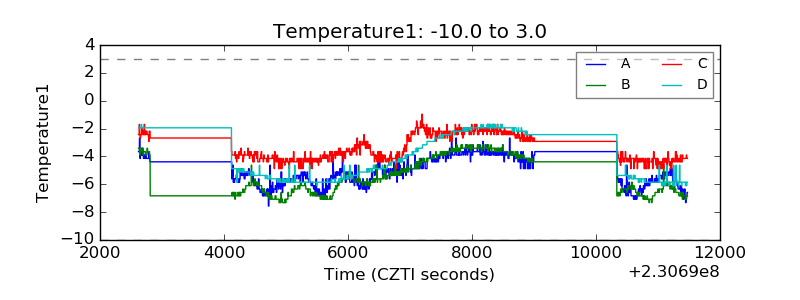 |
| Veto HV Monitor | 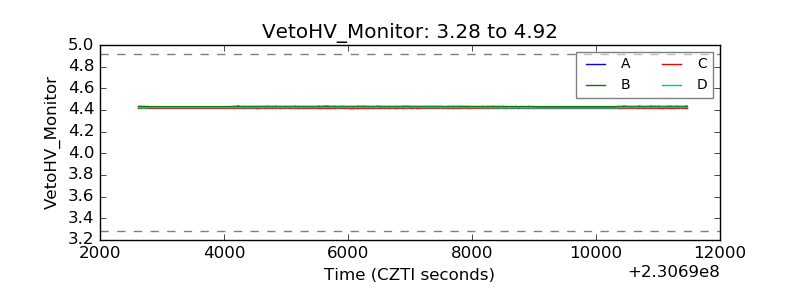 |
| Veto LLD | 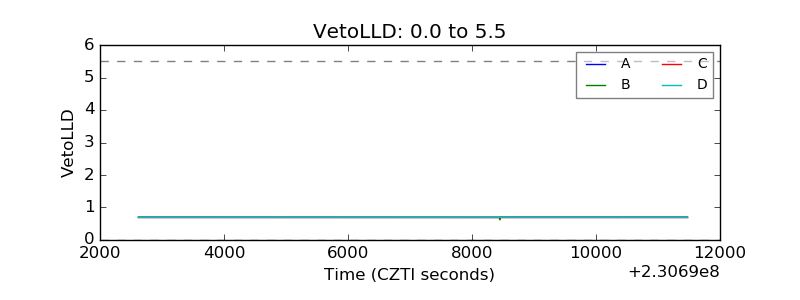 |
| Alpha Counter | 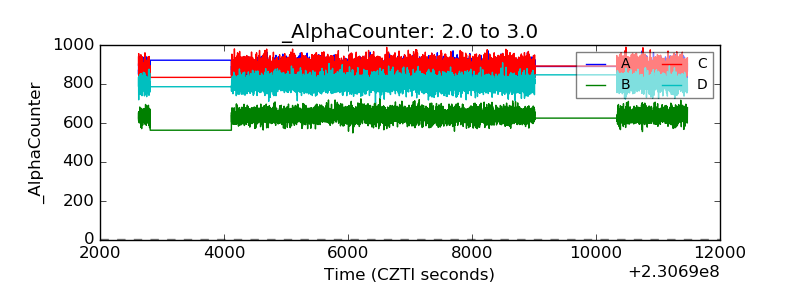 |
| _CPM_Rate | 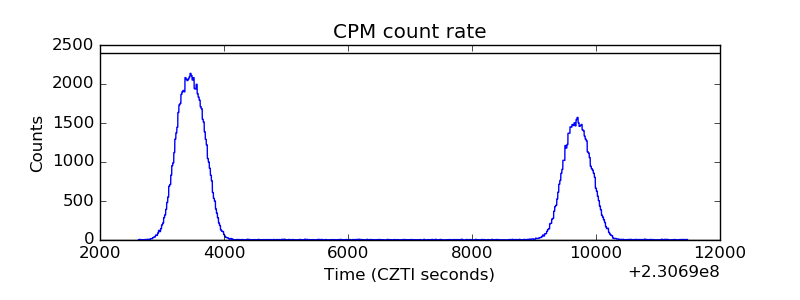 |
| CZT Counter | 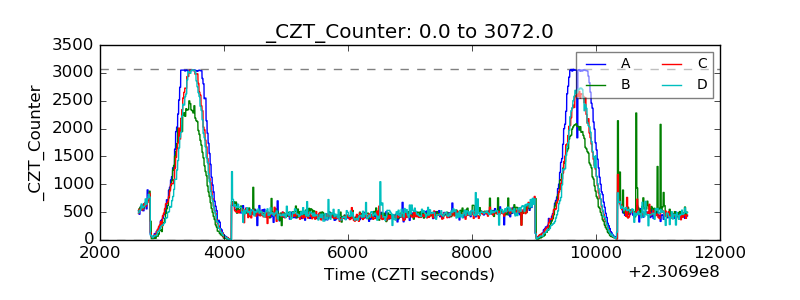 |
| +2.5 Volts monitor |  |
| +5 Volts monitor |  |
| _ROLL_ROT | 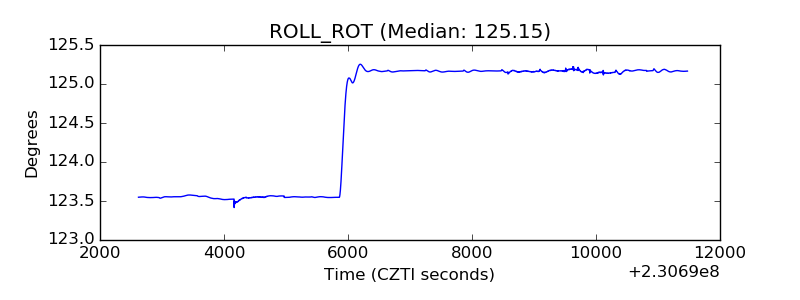 |
| _Roll_DEC | 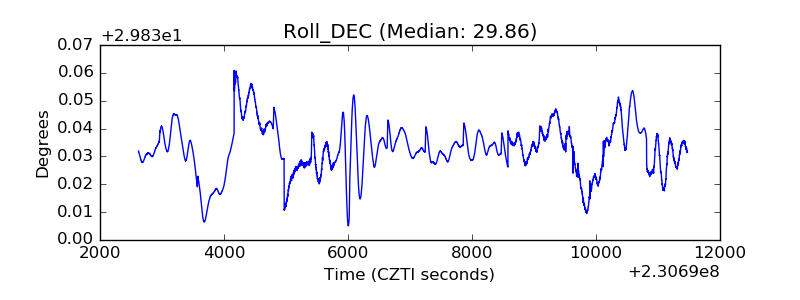 |
| _Roll_RA | 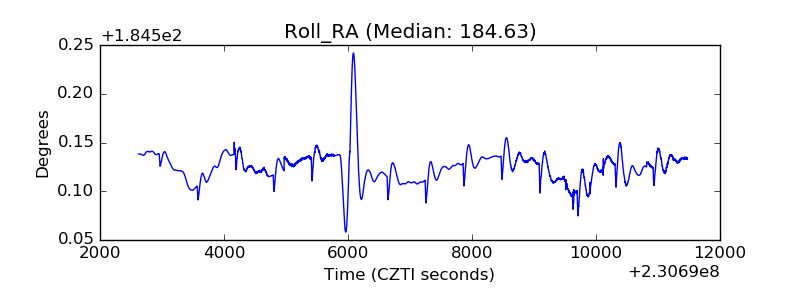 |
| Veto Counter | 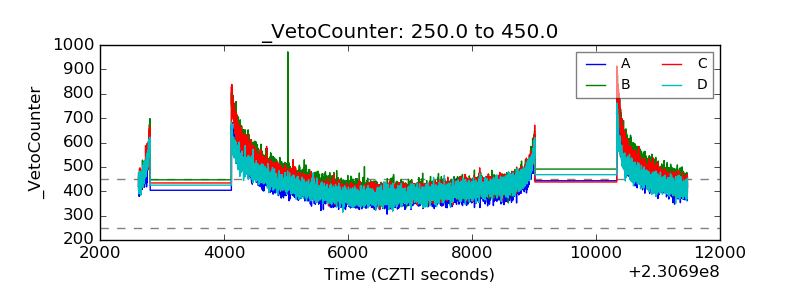 |