| Param | Original file | Final file |
|---|---|---|
| Filename | modeM0/AS1G07_060T01_9000001200_08497cztM0_level2.evt | modeM0/AS1G07_060T01_9000001200_08497cztM0_level2_quad_clean.evt |
| Size (bytes) | 413,072,640 | 72,702,720 |
| Size | 393.9 MB | 69.3 MB |
| Events in quadrant A | 2,915,007 | 449,211 |
| Events in quadrant B | 3,132,940 | 451,763 |
| Events in quadrant C | 2,840,632 | 441,274 |
| Events in quadrant D | 3,199,109 | 425,718 |
| Mode SS | |||
|---|---|---|---|
| Quadrant | BADHDUFLAG | Total packets | Discarded packets |
| A | 0 | 128 | 0 |
| B | 0 | 128 | 0 |
| C | 0 | 128 | 0 |
| D | 0 | 128 | 0 |
| Mode M0 | |||
|---|---|---|---|
| Quadrant | BADHDUFLAG | Total packets | Discarded packets |
| A | 0 | 12738 | 5 |
| B | 0 | 13224 | 2 |
| C | 0 | 12686 | 4 |
| D | 0 | 13397 | 2 |
| Mode M9 | |||
|---|---|---|---|
| Quadrant | BADHDUFLAG | Total packets | Discarded packets |
| A | 0 | 16 | 0 |
| B | 0 | 16 | 0 |
| C | 0 | 16 | 0 |
| D | 0 | 17 | 0 |
| Quadrant | Total seconds | Saturated seconds | Saturation percentage |
|---|---|---|---|
| A | 6200 | 21 | 0.338710% |
| B | 6201 | 83 | 1.338494% |
| C | 6200 | 12 | 0.193548% |
| D | 6201 | 9 | 0.145138% |
Noise dominated data is calculated using 1-second bins in cleaned event files. If a bin has >2000 counts, and if more than 50% of those come from <1% of pixels, then it is considered to be noise-dominated and hence unusable.
| Quadrant | # 1 sec bins | Bins with >0 counts | Bins with >2000 counts | High rate bins dominated by noise | Noise dominated (total time) | Noise dominated (detector-on time) | Marked lightcurve |
|---|---|---|---|---|---|---|---|
| A | 7481 | 6202 | 2 | 2 | 0.03% | 0.03% | 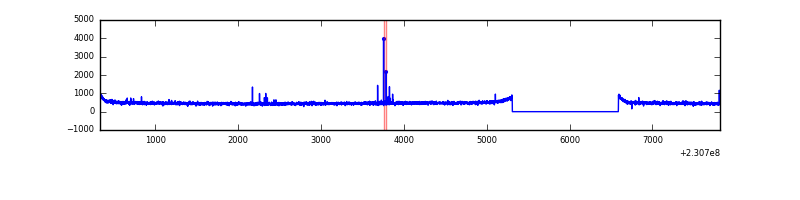 |
| B | 7481 | 6202 | 25 | 25 | 0.33% | 0.40% | 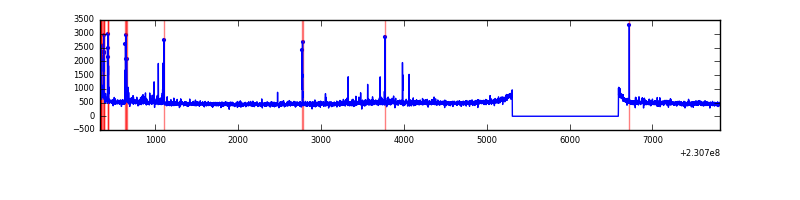 |
| C | 7481 | 6202 | 0 | 0 | 0.00% | 0.00% | 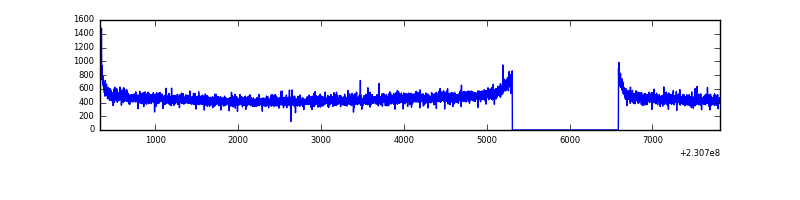 |
| D | 7481 | 6202 | 1 | 1 | 0.01% | 0.02% | 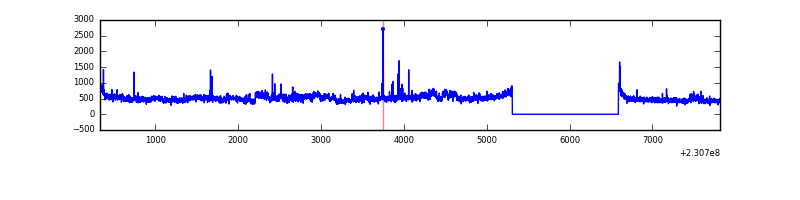 |
Top three noisy pixels from each quadrant. If the there are fewer than three noisy pixels in the level2.evt file, extra rows are filled as -1
| Pixel properties | Quadrant properties | ||||||
|---|---|---|---|---|---|---|---|
| Quadrant | DetID | PixID | Counts | Sigma | Mean | Median | Sigma |
| A | 5 | 16 | 18684 | 116.73 | 752 | 737 | 153.7 |
| A | 0 | 226 | 7006 | 40.78 | 752 | 737 | 153.7 |
| A | 12 | 194 | 6587 | 38.05 | 752 | 737 | 153.7 |
| B | 4 | 173 | 129818 | 904.34 | 753 | 737 | 142.7 |
| B | 0 | 214 | 60439 | 418.27 | 753 | 737 | 142.7 |
| B | 12 | 111 | 16031 | 107.15 | 753 | 737 | 142.7 |
| C | 13 | 61 | 5536 | 28.79 | 726 | 731 | 166.9 |
| C | 12 | 4 | 4892 | 24.93 | 726 | 731 | 166.9 |
| C | 8 | 222 | 3348 | 15.68 | 726 | 731 | 166.9 |
| D | 1 | 52 | 385613 | 2246.75 | 718 | 702 | 171.3 |
| D | 8 | 195 | 38986 | 223.47 | 718 | 702 | 171.3 |
| D | 2 | 234 | 17914 | 100.47 | 718 | 702 | 171.3 |
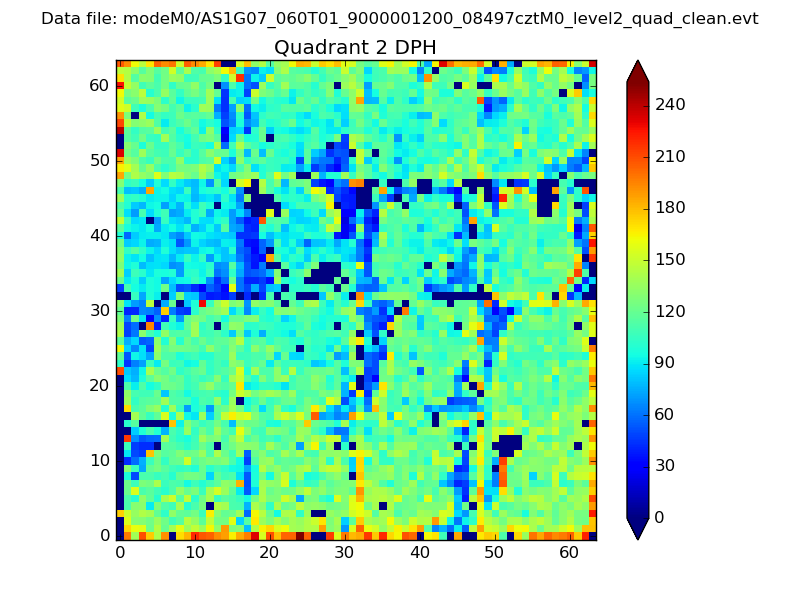
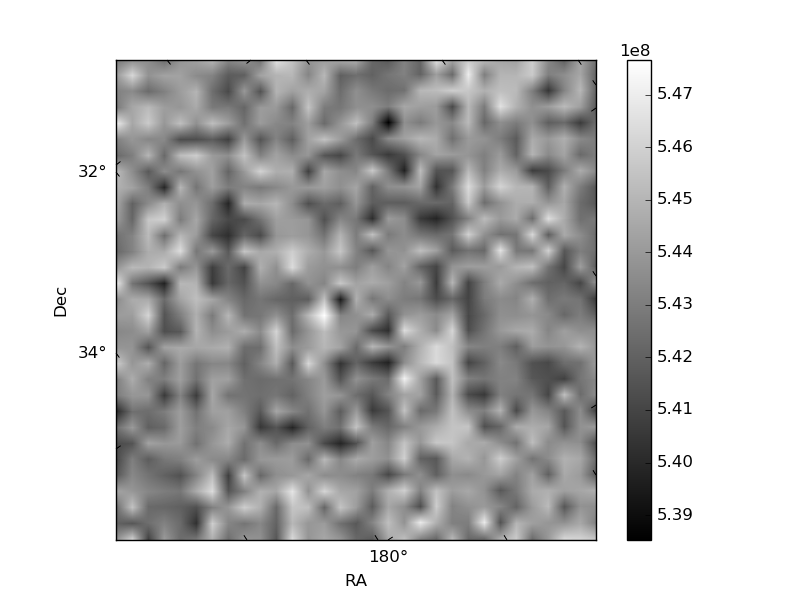
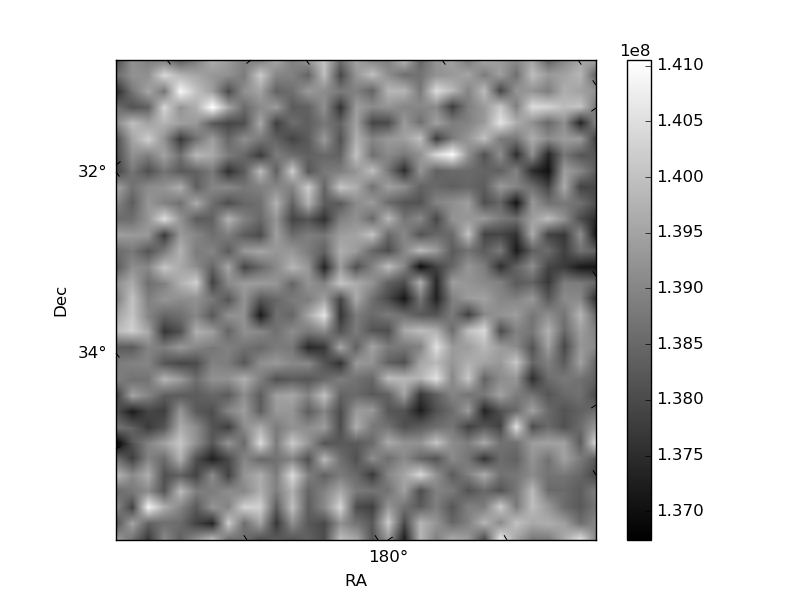
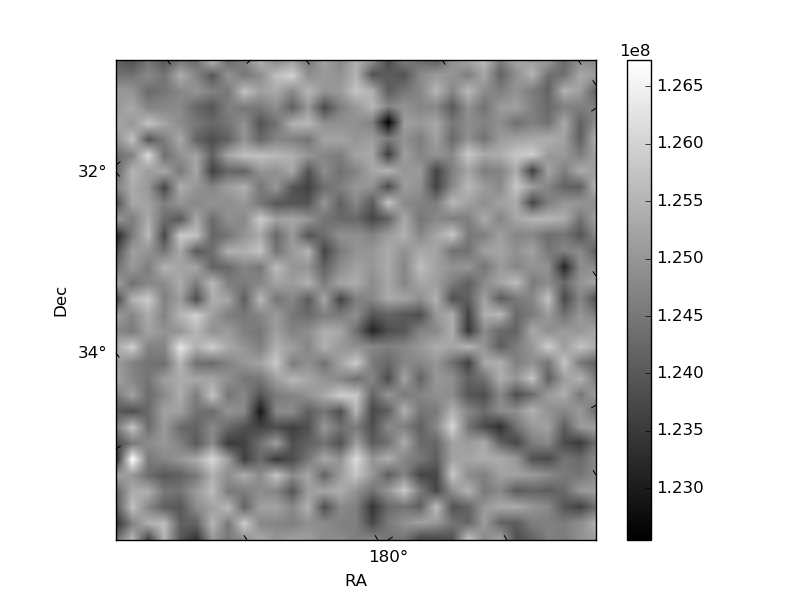
Histogram calculated using DETX and DETY for each event in the final _common_clean file
| Quadrant A | 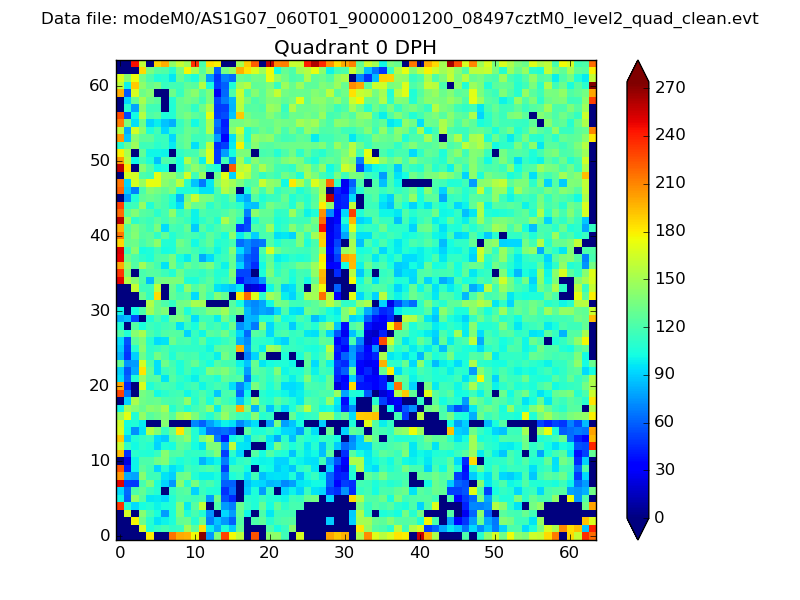 |
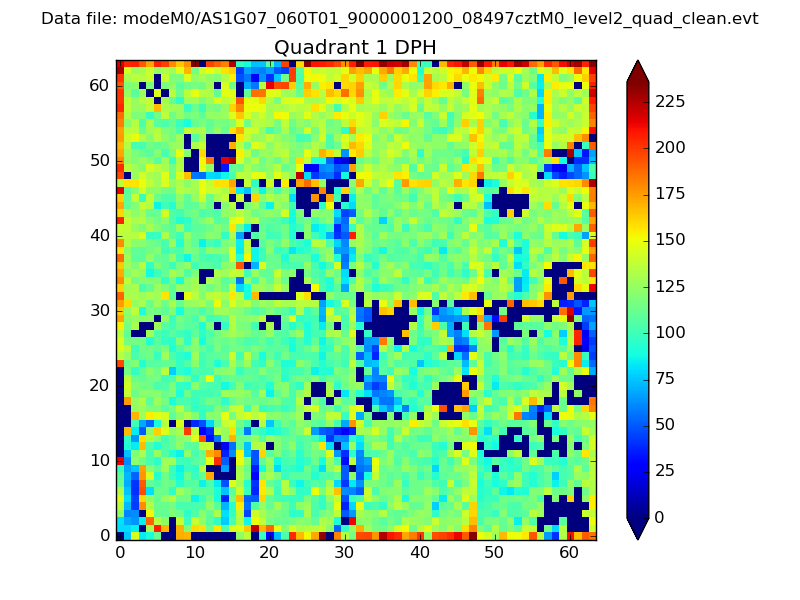 |
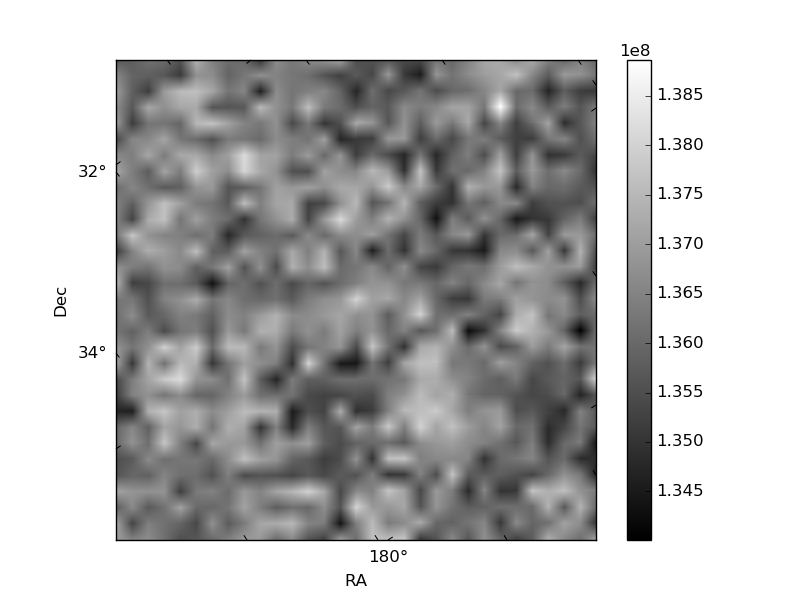
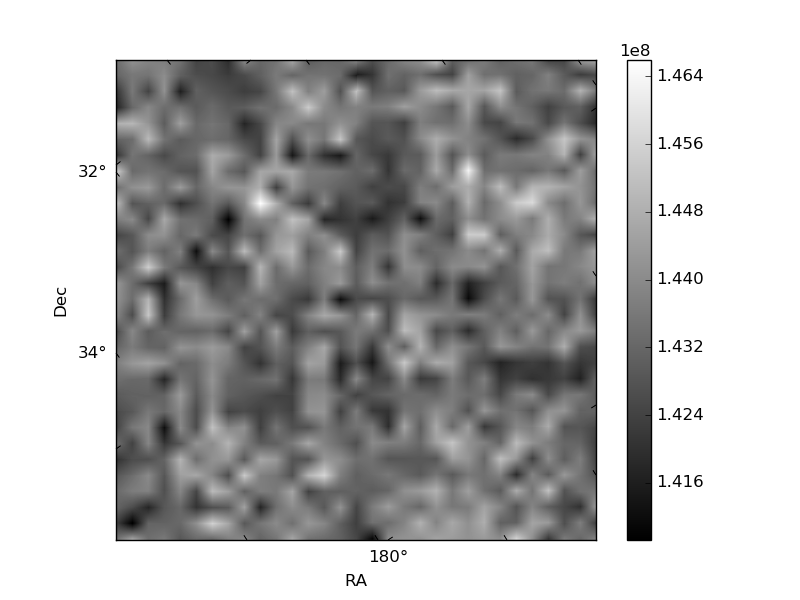
Quadrant B |
|---|---|---|---|
| Quadrant D | 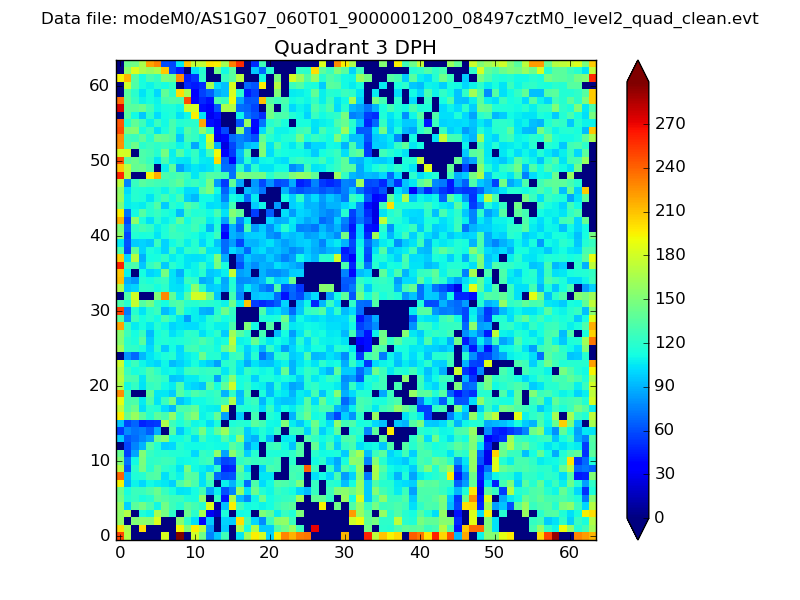 |
 |
Quadrant C |
| Plot type | Count rate plots | Images |
|---|---|---|
| Comparison with Poisson distribution Blue bars denote a histogram of data divided into 1 sec bins. Red curve is a Poisson curve with rate = median count rate of data. |
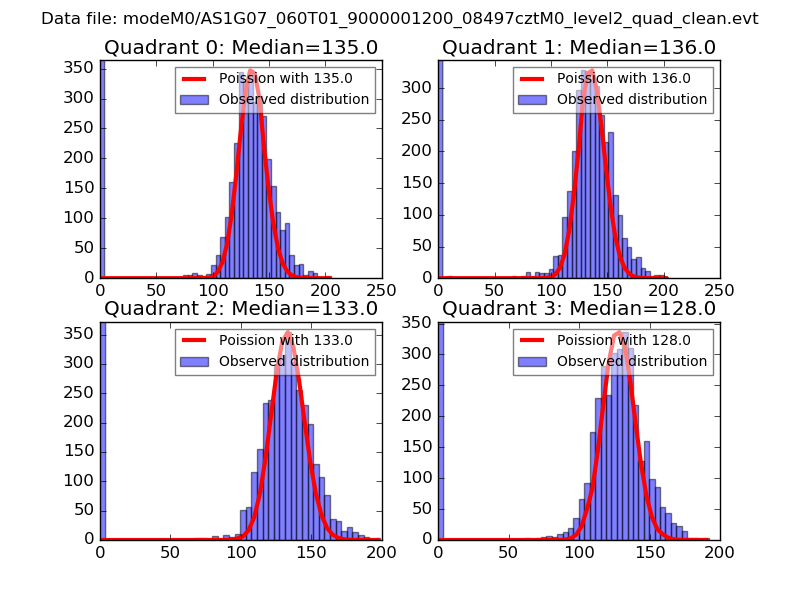 |
 |
| Quadrant-wise count rates Data is divided into 100 sec bins |
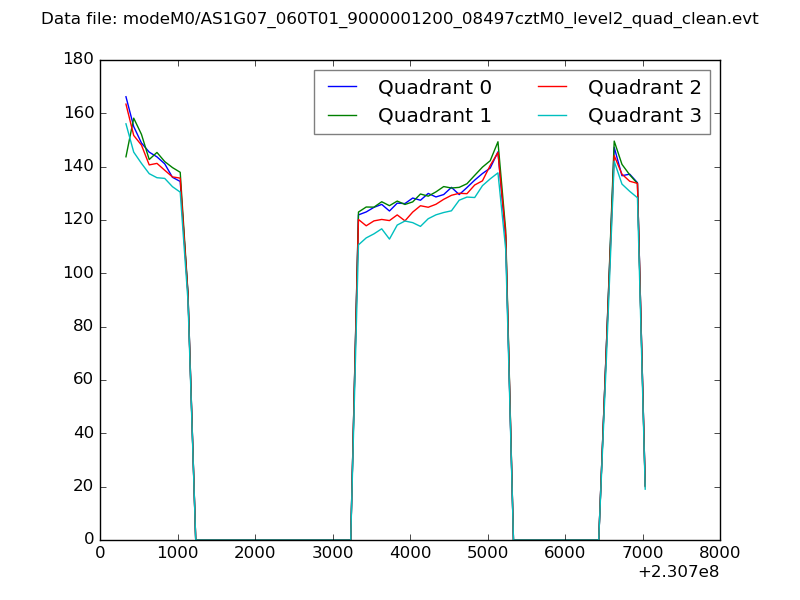 |
|
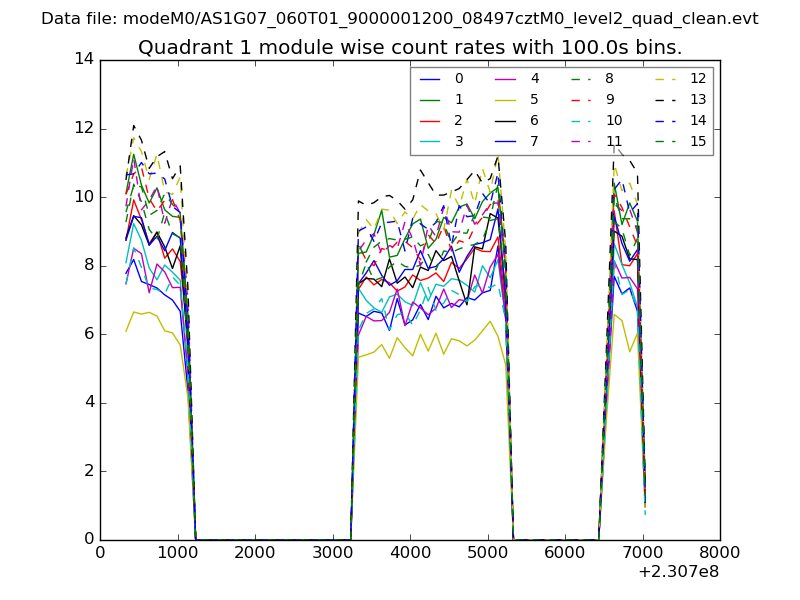
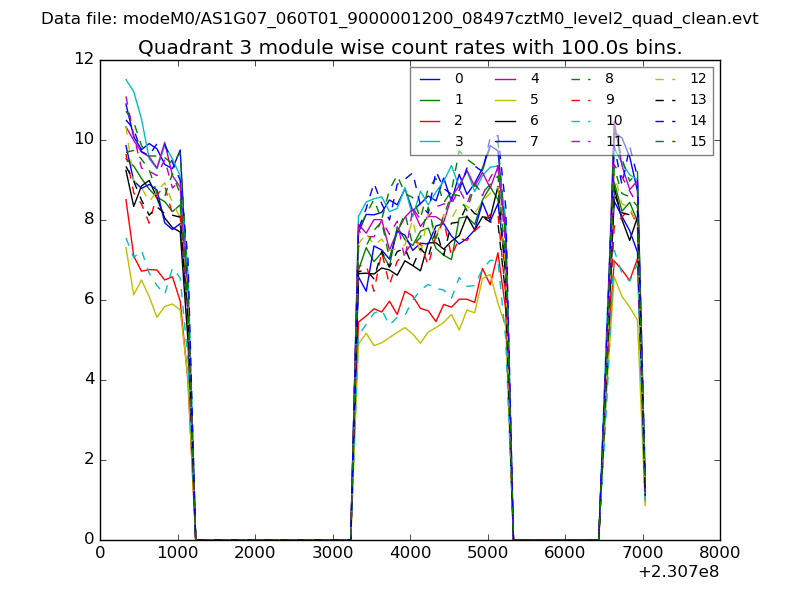
| Module-wise count rates for Quadrant A Data is divided into 100 sec bins |
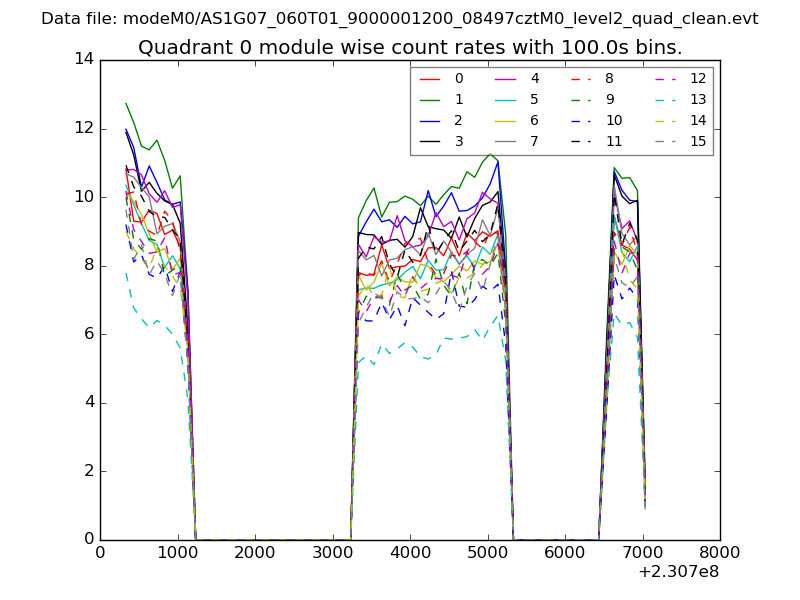 |
 |
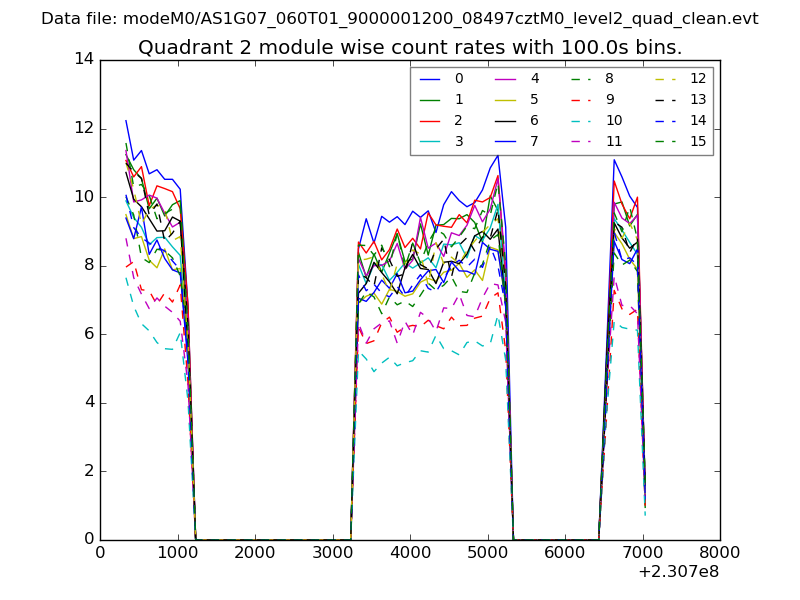
| Module-wise count rates for Quadrant B Data is divided into 100 sec bins |
 |
 |
| Module-wise count rates for Quadrant C Data is divided into 100 sec bins |
 |
 |
| Module-wise count rates for Quadrant D Data is divided into 100 sec bins |
 |
 |
| Parameter | Plot |
|---|---|
| CZT HV Monitor | 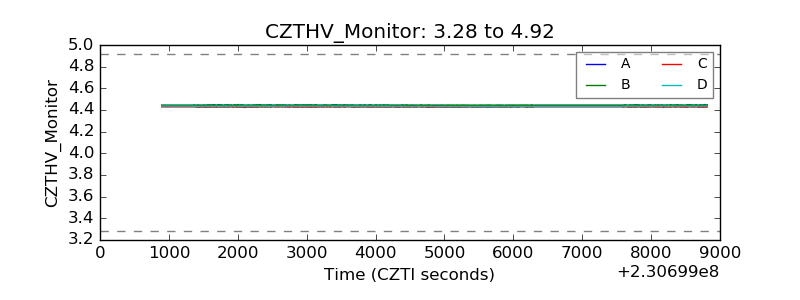 |
| D_VDD | 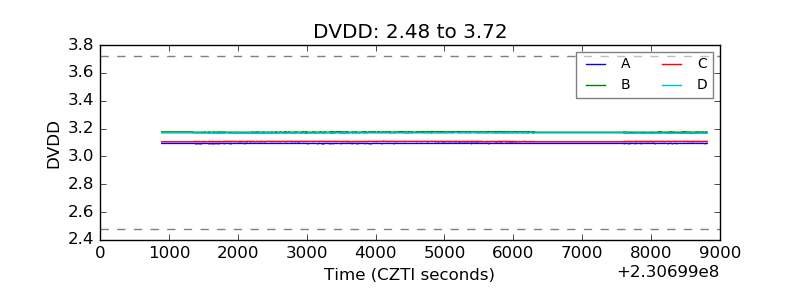 |
| Temperature 1 | 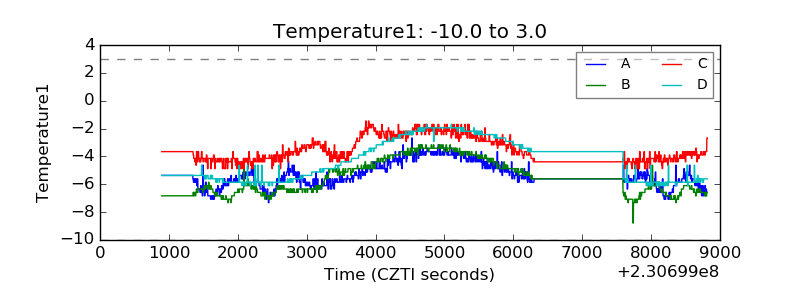 |
| Veto HV Monitor | 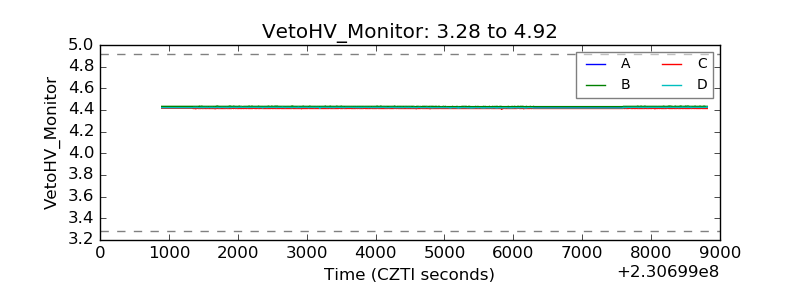 |
| Veto LLD | 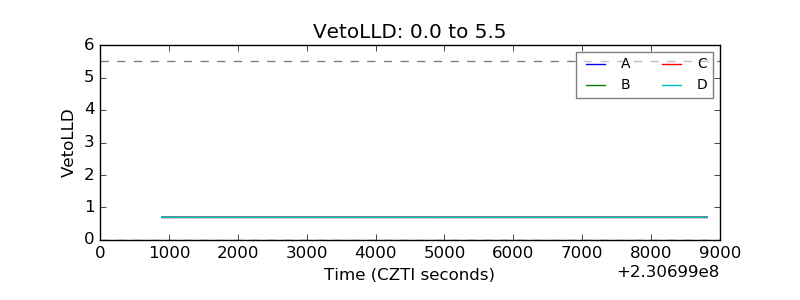 |
| Alpha Counter | 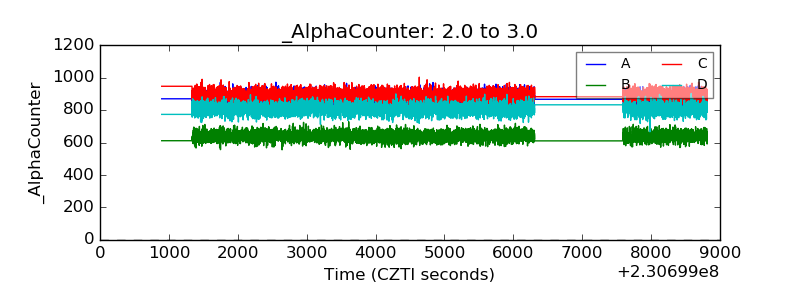 |
| _CPM_Rate | 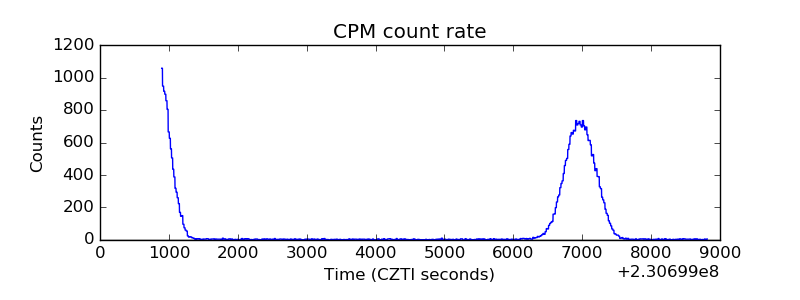 |
| CZT Counter | 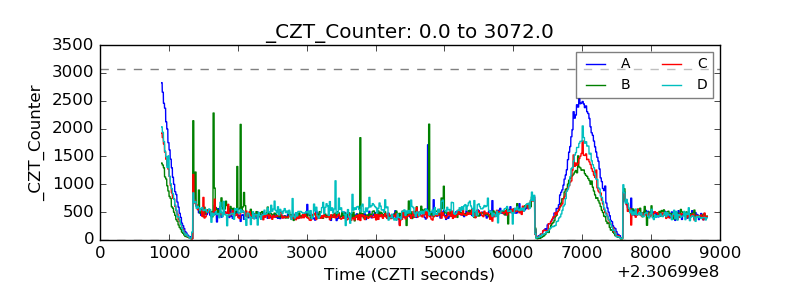 |
| +2.5 Volts monitor |  |
| +5 Volts monitor |  |
| _ROLL_ROT | 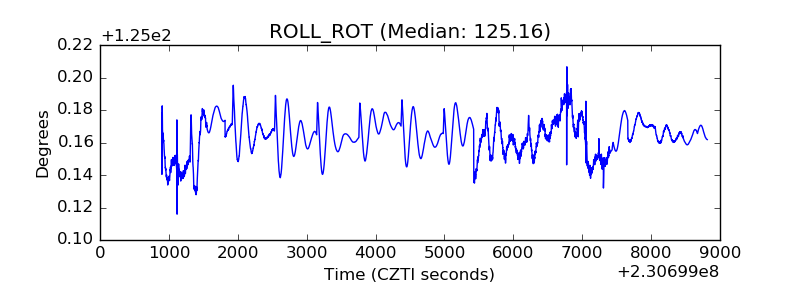 |
| _Roll_DEC | 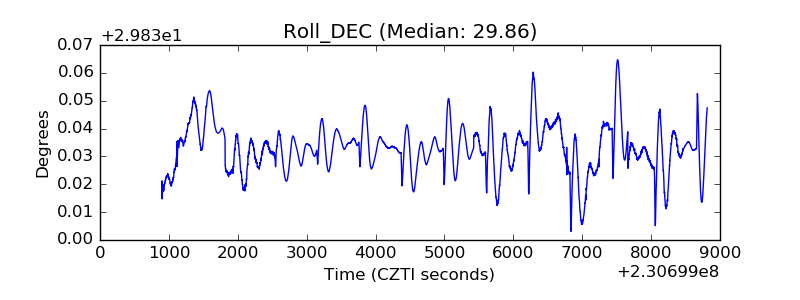 |
| _Roll_RA | 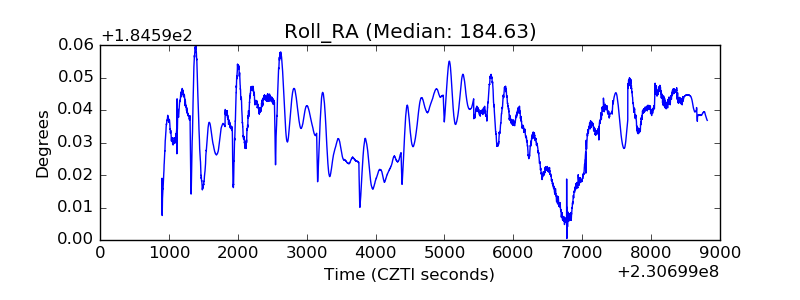 |
| Veto Counter | 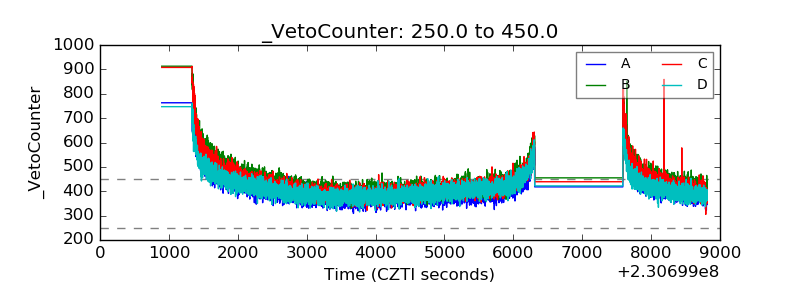 |