| Param | Original file | Final file |
|---|---|---|
| Filename | modeM0/AS1G07_060T01_9000001200_08498cztM0_level2.evt | modeM0/AS1G07_060T01_9000001200_08498cztM0_level2_quad_clean.evt |
| Size (bytes) | 428,466,240 | 70,292,160 |
| Size | 408.6 MB | 67.0 MB |
| Events in quadrant A | 3,095,426 | 422,127 |
| Events in quadrant B | 3,153,896 | 425,461 |
| Events in quadrant C | 2,998,588 | 418,852 |
| Events in quadrant D | 3,283,477 | 405,996 |
| Mode SS | |||
|---|---|---|---|
| Quadrant | BADHDUFLAG | Total packets | Discarded packets |
| A | 0 | 134 | 0 |
| B | 0 | 134 | 0 |
| C | 0 | 134 | 0 |
| D | 0 | 134 | 0 |
| Mode M0 | |||
|---|---|---|---|
| Quadrant | BADHDUFLAG | Total packets | Discarded packets |
| A | 0 | 13607 | 5 |
| B | 0 | 13616 | 2 |
| C | 0 | 13496 | 2 |
| D | 0 | 13914 | 5 |
| Mode M9 | |||
|---|---|---|---|
| Quadrant | BADHDUFLAG | Total packets | Discarded packets |
| A | 0 | 18 | 0 |
| B | 0 | 18 | 0 |
| C | 0 | 18 | 0 |
| D | 0 | 19 | 0 |
| Quadrant | Total seconds | Saturated seconds | Saturation percentage |
|---|---|---|---|
| A | 6531 | 127 | 1.944572% |
| B | 6532 | 147 | 2.250459% |
| C | 6532 | 91 | 1.393141% |
| D | 6531 | 83 | 1.270862% |
Noise dominated data is calculated using 1-second bins in cleaned event files. If a bin has >2000 counts, and if more than 50% of those come from <1% of pixels, then it is considered to be noise-dominated and hence unusable.
| Quadrant | # 1 sec bins | Bins with >0 counts | Bins with >2000 counts | High rate bins dominated by noise | Noise dominated (total time) | Noise dominated (detector-on time) | Marked lightcurve |
|---|---|---|---|---|---|---|---|
| A | 7502 | 6532 | 10 | 10 | 0.13% | 0.15% | 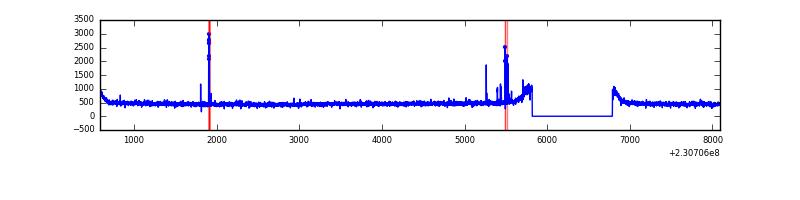 |
| B | 7502 | 6532 | 4 | 4 | 0.05% | 0.06% | 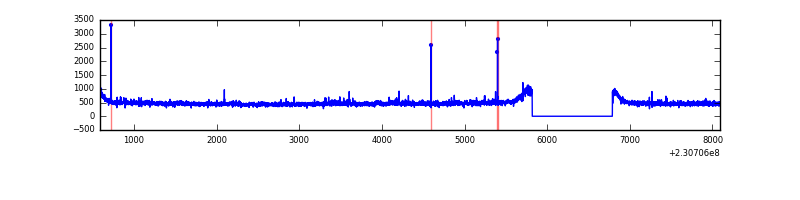 |
| C | 7502 | 6532 | 0 | 0 | 0.00% | 0.00% | 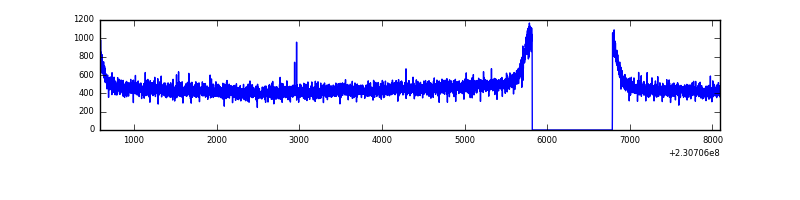 |
| D | 7502 | 6533 | 1 | 1 | 0.01% | 0.02% | 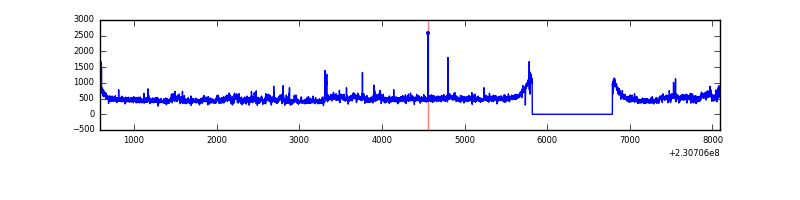 |
Top three noisy pixels from each quadrant. If the there are fewer than three noisy pixels in the level2.evt file, extra rows are filled as -1
| Pixel properties | Quadrant properties | ||||||
|---|---|---|---|---|---|---|---|
| Quadrant | DetID | PixID | Counts | Sigma | Mean | Median | Sigma |
| A | 5 | 16 | 39762 | 239.98 | 794 | 778 | 162.4 |
| A | 0 | 226 | 7240 | 39.78 | 794 | 778 | 162.4 |
| A | 12 | 194 | 6794 | 37.03 | 794 | 778 | 162.4 |
| B | 0 | 214 | 37200 | 237.26 | 797 | 777 | 153.5 |
| B | 12 | 111 | 17286 | 107.54 | 797 | 777 | 153.5 |
| B | 11 | 111 | 13585 | 83.43 | 797 | 777 | 153.5 |
| C | 13 | 61 | 5802 | 28.07 | 768 | 770 | 179.2 |
| C | 8 | 222 | 3126 | 13.14 | 768 | 770 | 179.2 |
| C | 3 | 202 | 1926 | 6.45 | 768 | 770 | 179.2 |
| D | 1 | 52 | 308137 | 1638.68 | 760 | 741 | 187.6 |
| D | 8 | 195 | 51139 | 268.66 | 760 | 741 | 187.6 |
| D | 2 | 234 | 19334 | 99.12 | 760 | 741 | 187.6 |
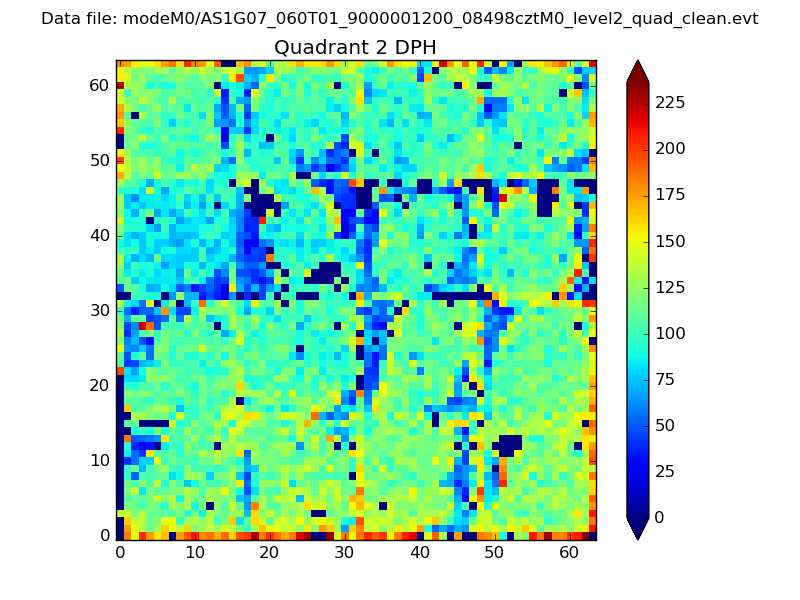
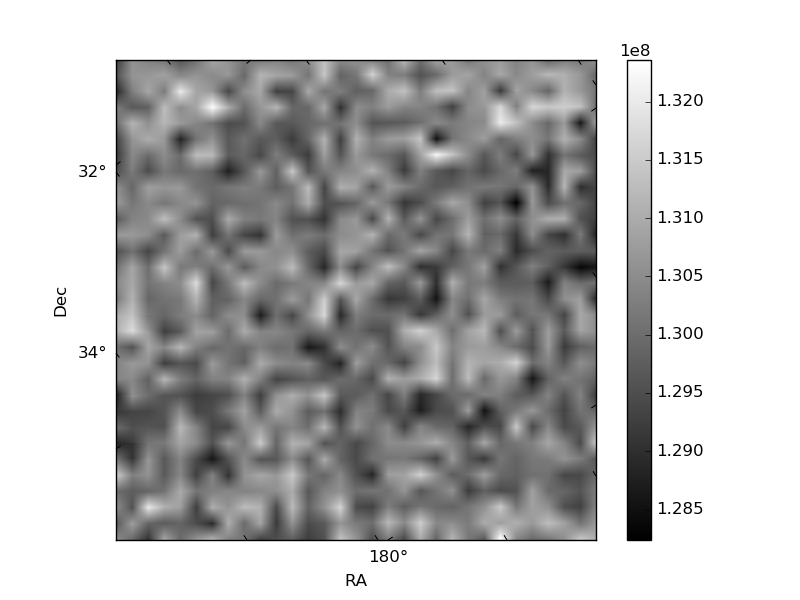
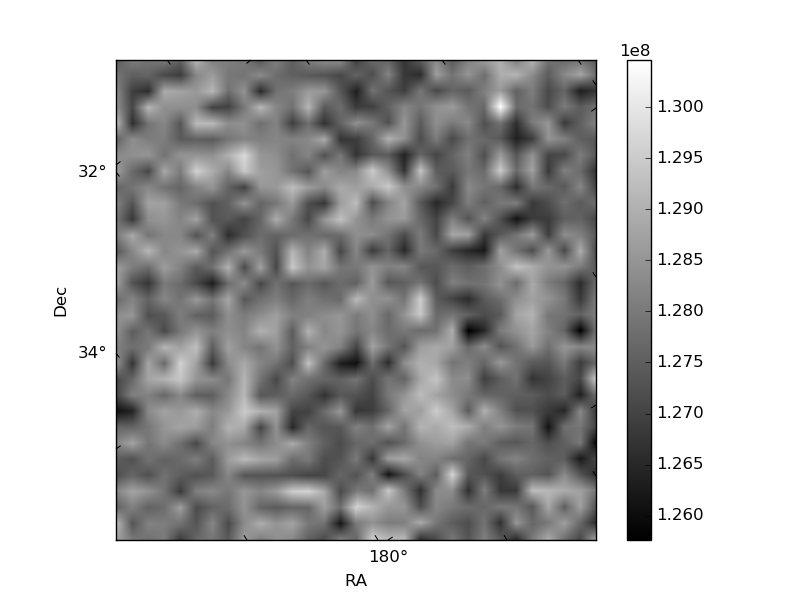
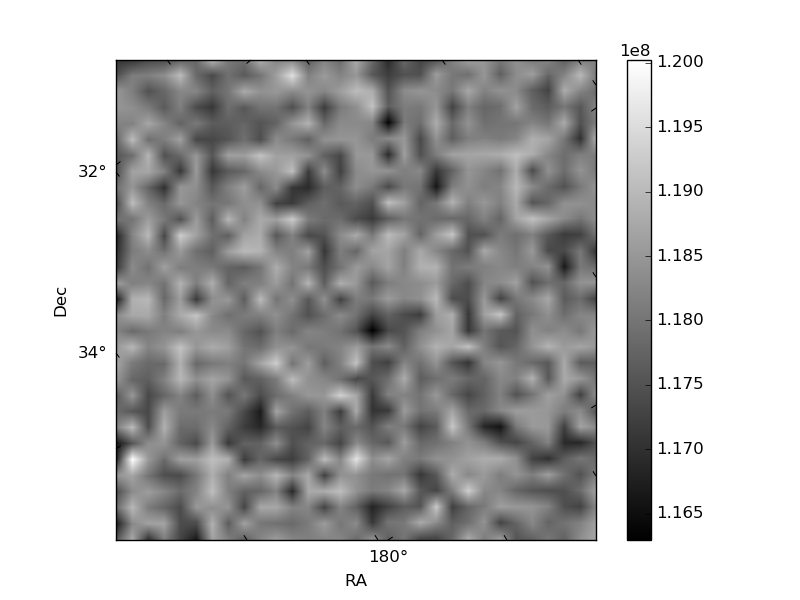
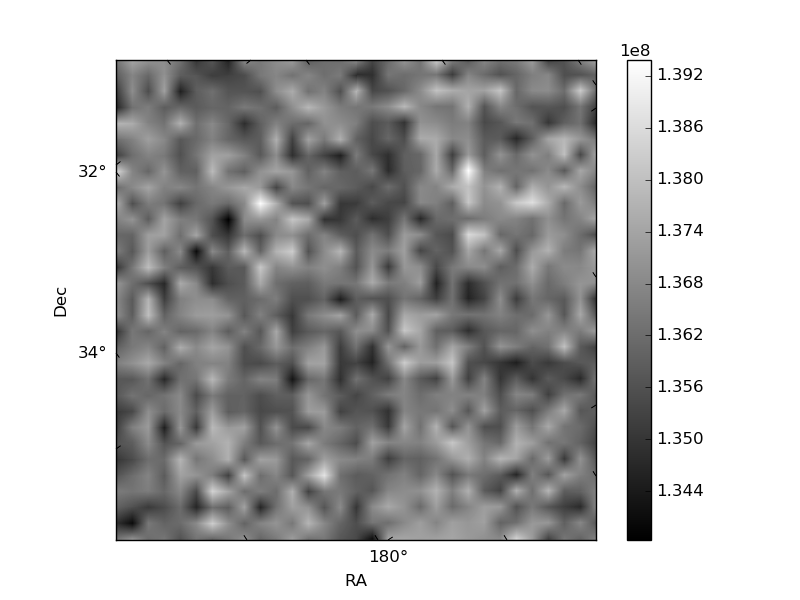
Histogram calculated using DETX and DETY for each event in the final _common_clean file
| Quadrant A | 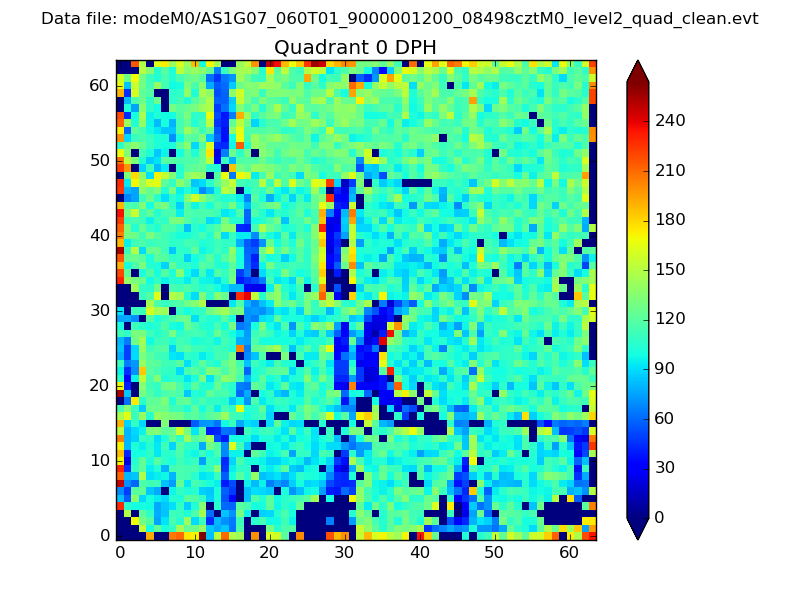 |
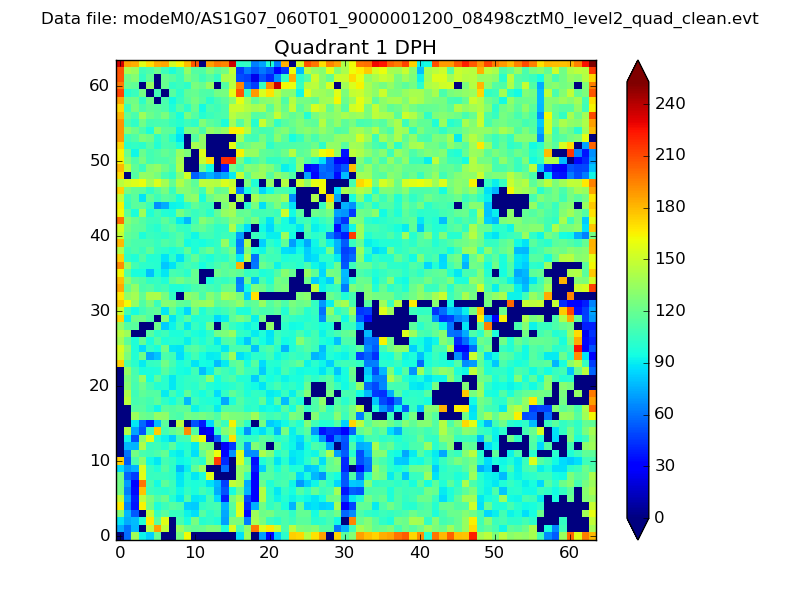 |
Quadrant B |
|---|---|---|---|
| Quadrant D | 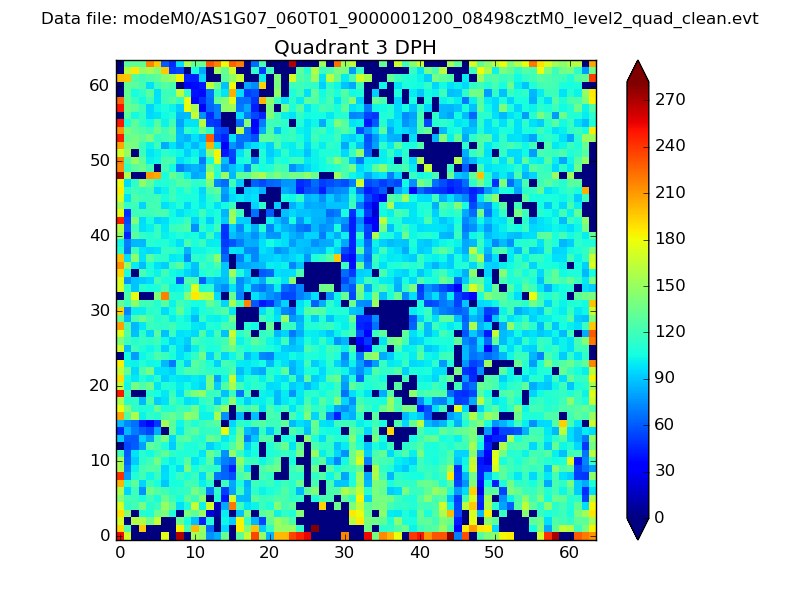 |
 |
Quadrant C |
| Plot type | Count rate plots | Images |
|---|---|---|
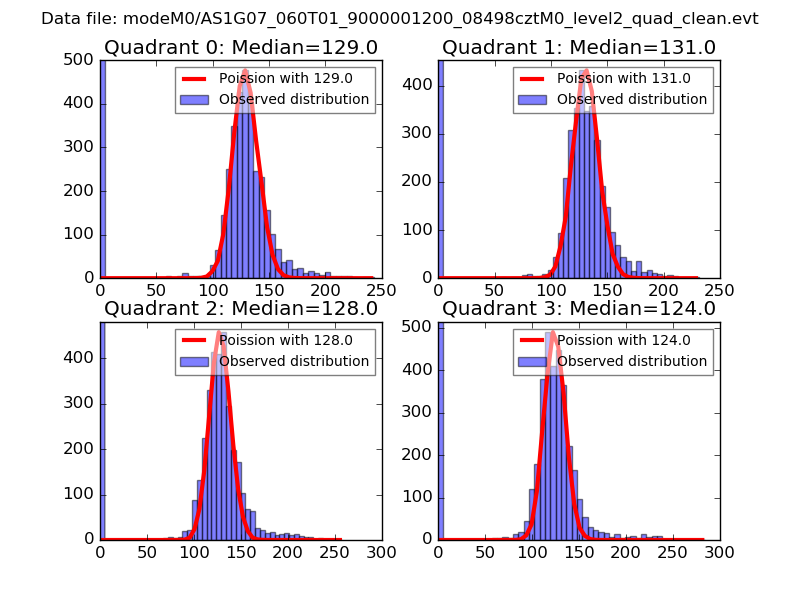
| Comparison with Poisson distribution Blue bars denote a histogram of data divided into 1 sec bins. Red curve is a Poisson curve with rate = median count rate of data. |
 |
 |
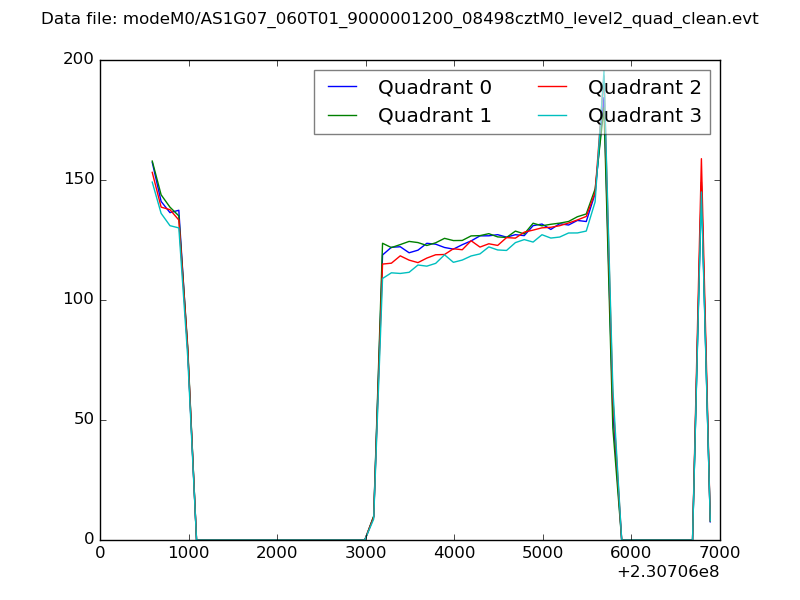
| Quadrant-wise count rates Data is divided into 100 sec bins |
 |
|
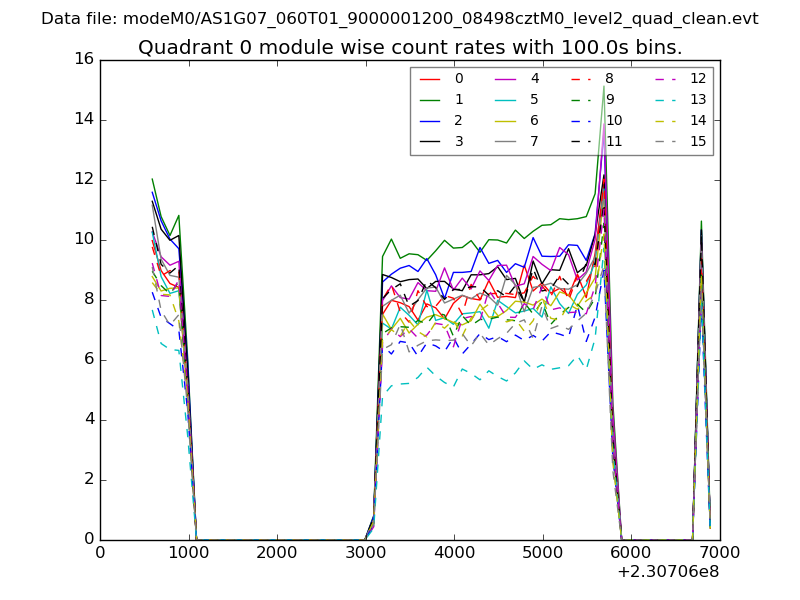
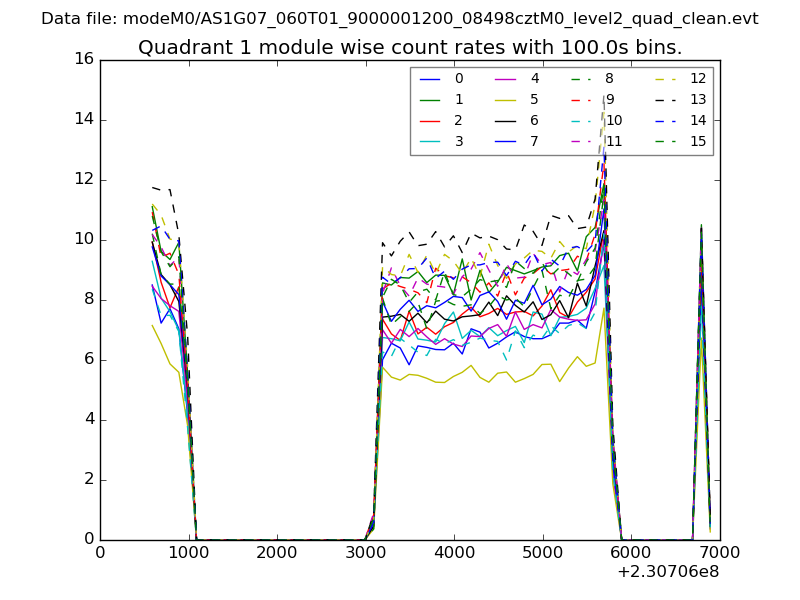
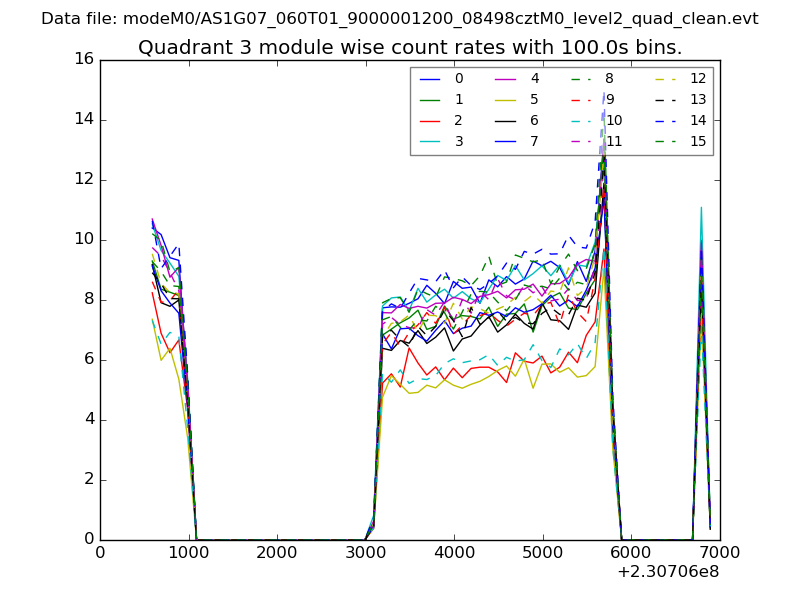
| Module-wise count rates for Quadrant A Data is divided into 100 sec bins |
 |
 |
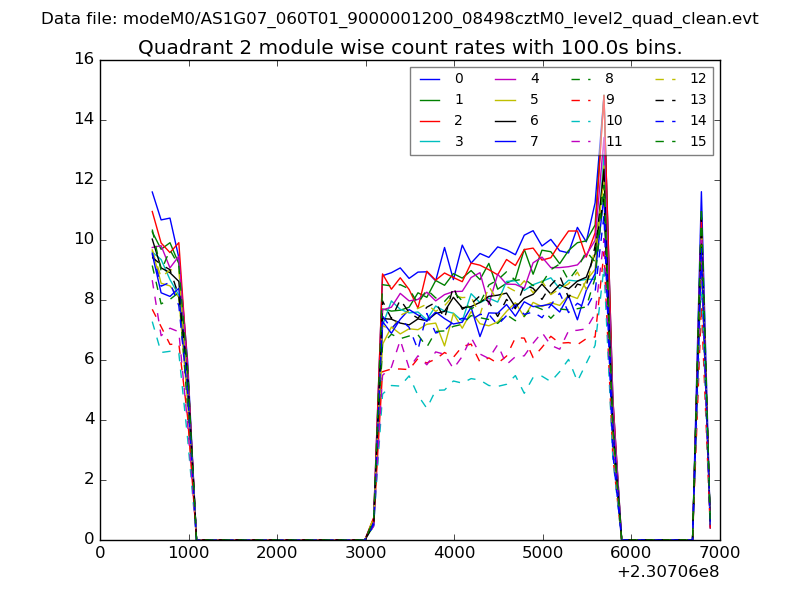
| Module-wise count rates for Quadrant B Data is divided into 100 sec bins |
 |
 |
| Module-wise count rates for Quadrant C Data is divided into 100 sec bins |
 |
 |
| Module-wise count rates for Quadrant D Data is divided into 100 sec bins |
 |
 |
| Parameter | Plot |
|---|---|
| CZT HV Monitor | 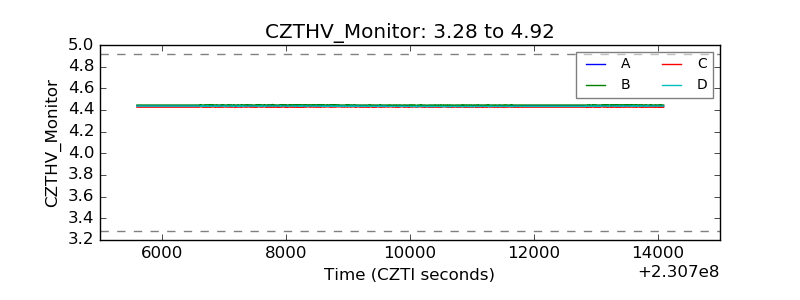 |
| D_VDD | 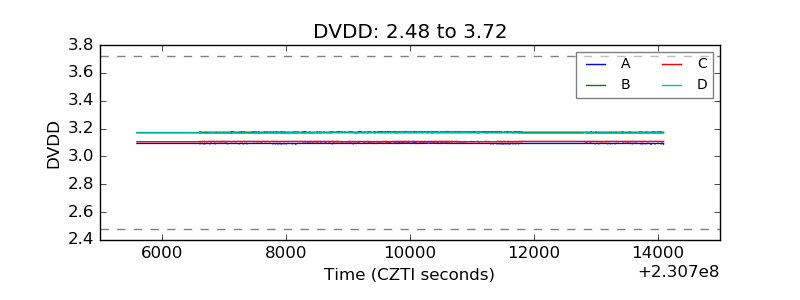 |
| Temperature 1 | 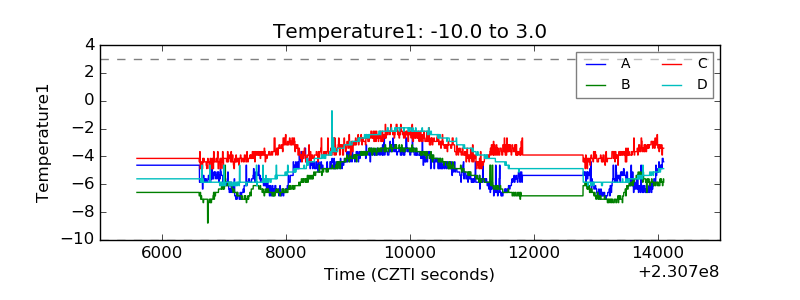 |
| Veto HV Monitor | 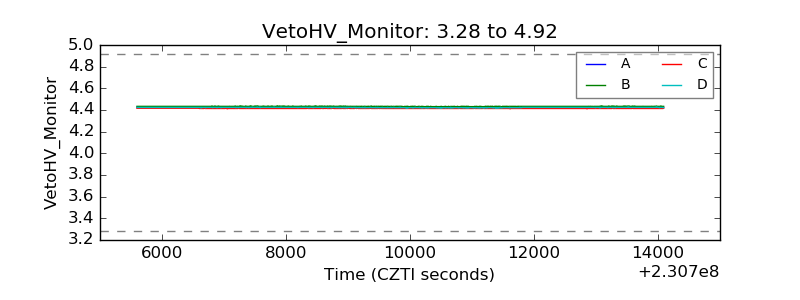 |
| Veto LLD | 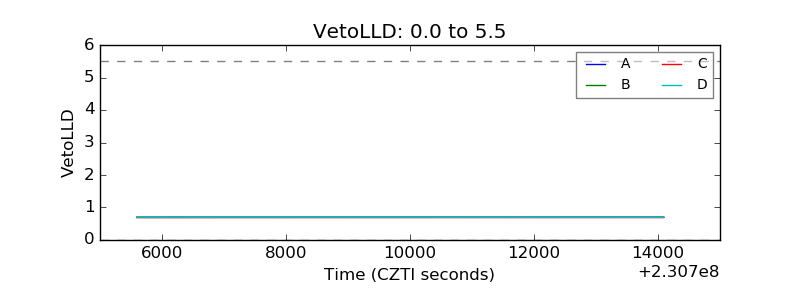 |
| Alpha Counter | 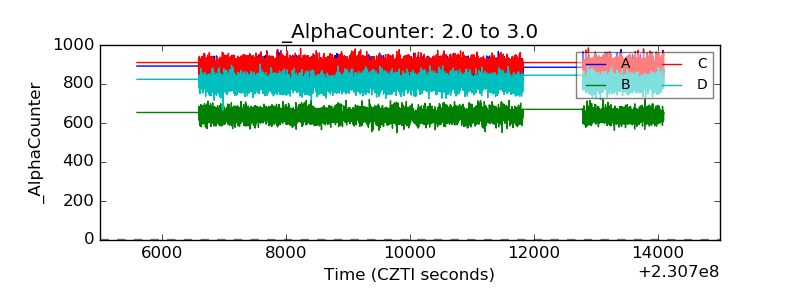 |
| _CPM_Rate | 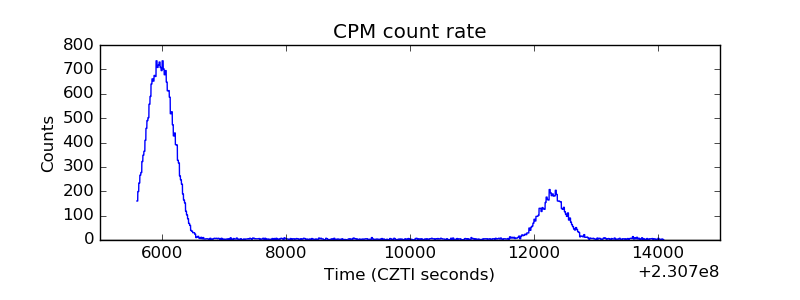 |
| CZT Counter | 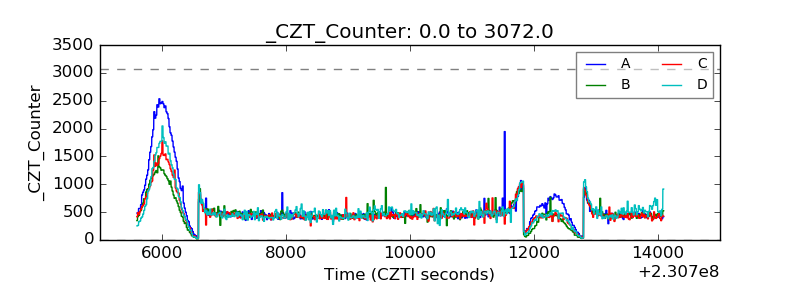 |
| +2.5 Volts monitor | 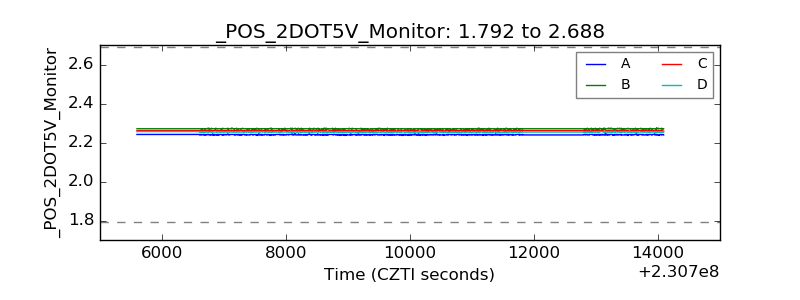 |
| +5 Volts monitor |  |
| _ROLL_ROT | 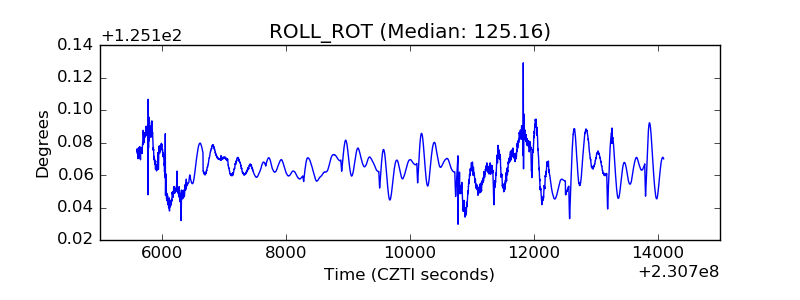 |
| _Roll_DEC | 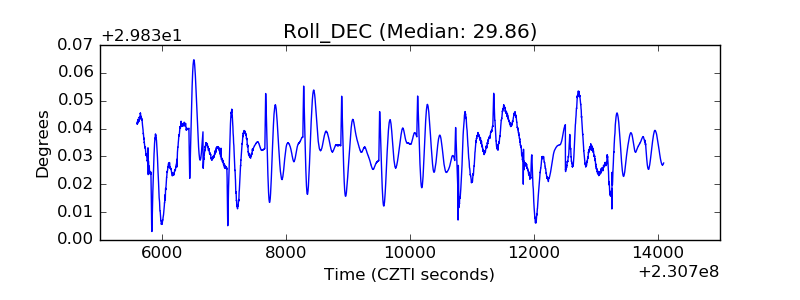 |
| _Roll_RA | 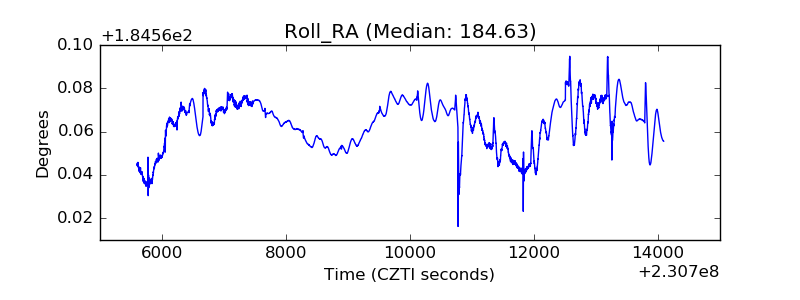 |
| Veto Counter | 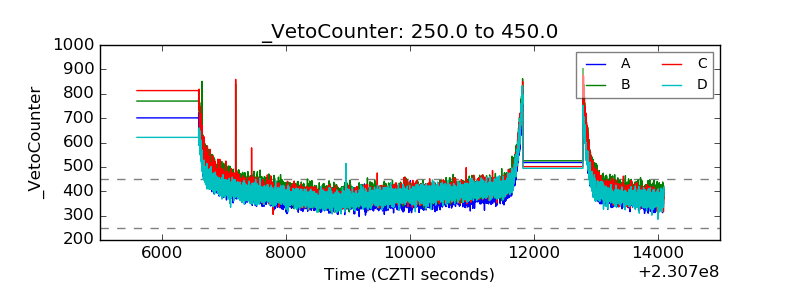 |