| Param | Original file | Final file |
|---|---|---|
| Filename | modeM0/AS1G07_060T01_9000001200_08499cztM0_level2.evt | modeM0/AS1G07_060T01_9000001200_08499cztM0_level2_quad_clean.evt |
| Size (bytes) | 490,176,000 | 81,884,160 |
| Size | 467.5 MB | 78.1 MB |
| Events in quadrant A | 3,531,022 | 494,960 |
| Events in quadrant B | 3,655,827 | 498,502 |
| Events in quadrant C | 3,388,979 | 493,781 |
| Events in quadrant D | 3,769,603 | 480,630 |
| Mode SS | |||
|---|---|---|---|
| Quadrant | BADHDUFLAG | Total packets | Discarded packets |
| A | 0 | 154 | 0 |
| B | 0 | 154 | 0 |
| C | 0 | 154 | 0 |
| D | 0 | 154 | 0 |
| Mode M0 | |||
|---|---|---|---|
| Quadrant | BADHDUFLAG | Total packets | Discarded packets |
| A | 0 | 15523 | 3 |
| B | 0 | 15716 | 2 |
| C | 0 | 15303 | 2 |
| D | 0 | 16098 | 2 |
| Mode M9 | |||
|---|---|---|---|
| Quadrant | BADHDUFLAG | Total packets | Discarded packets |
| A | 0 | 16 | 0 |
| B | 0 | 16 | 0 |
| C | 0 | 16 | 0 |
| D | 0 | 16 | 0 |
| Quadrant | Total seconds | Saturated seconds | Saturation percentage |
|---|---|---|---|
| A | 7344 | 197 | 2.682462% |
| B | 7344 | 232 | 3.159041% |
| C | 7344 | 130 | 1.770153% |
| D | 7344 | 133 | 1.811002% |
Noise dominated data is calculated using 1-second bins in cleaned event files. If a bin has >2000 counts, and if more than 50% of those come from <1% of pixels, then it is considered to be noise-dominated and hence unusable.
| Quadrant | # 1 sec bins | Bins with >0 counts | Bins with >2000 counts | High rate bins dominated by noise | Noise dominated (total time) | Noise dominated (detector-on time) | Marked lightcurve |
|---|---|---|---|---|---|---|---|
| A | 8969 | 7345 | 15 | 15 | 0.17% | 0.20% | 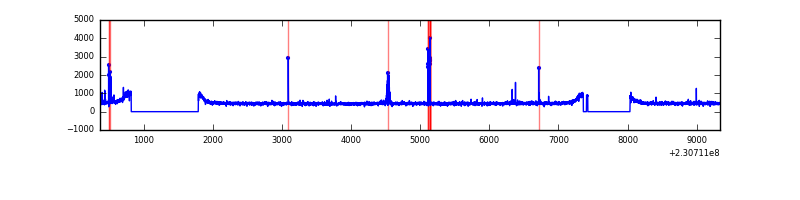 |
| B | 8969 | 7345 | 9 | 9 | 0.10% | 0.12% | 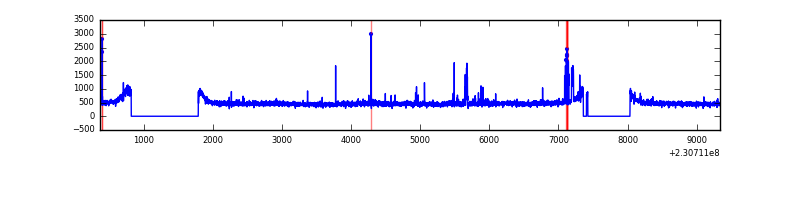 |
| C | 8969 | 7345 | 0 | 0 | 0.00% | 0.00% | 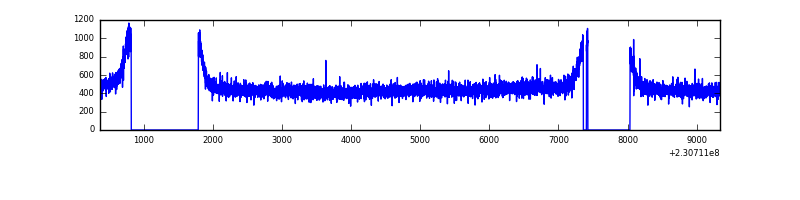 |
| D | 8969 | 7346 | 8 | 8 | 0.09% | 0.11% | 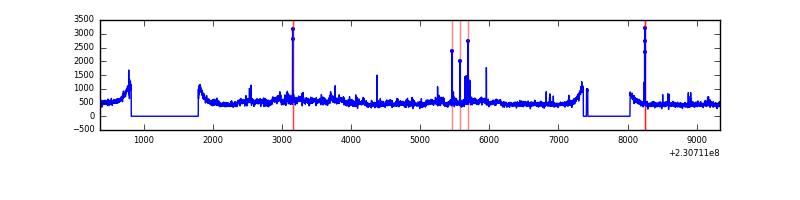 |
Top three noisy pixels from each quadrant. If the there are fewer than three noisy pixels in the level2.evt file, extra rows are filled as -1
| Pixel properties | Quadrant properties | ||||||
|---|---|---|---|---|---|---|---|
| Quadrant | DetID | PixID | Counts | Sigma | Mean | Median | Sigma |
| A | 5 | 16 | 54252 | 291.76 | 893 | 873 | 183.0 |
| A | 13 | 248 | 29689 | 157.5 | 893 | 873 | 183.0 |
| A | 0 | 226 | 8179 | 39.93 | 893 | 873 | 183.0 |
| B | 5 | 255 | 75234 | 426.52 | 896 | 872 | 174.3 |
| B | 10 | 16 | 41925 | 235.47 | 896 | 872 | 174.3 |
| B | 0 | 214 | 36063 | 201.85 | 896 | 872 | 174.3 |
| C | 13 | 61 | 6579 | 28.0 | 868 | 871 | 203.9 |
| C | 8 | 222 | 3871 | 14.72 | 868 | 871 | 203.9 |
| C | 3 | 202 | 2136 | 6.21 | 868 | 871 | 203.9 |
| D | 1 | 52 | 377284 | 1759.04 | 860 | 839 | 214.0 |
| D | 7 | 71 | 57757 | 265.97 | 860 | 839 | 214.0 |
| D | 2 | 234 | 23799 | 107.29 | 860 | 839 | 214.0 |
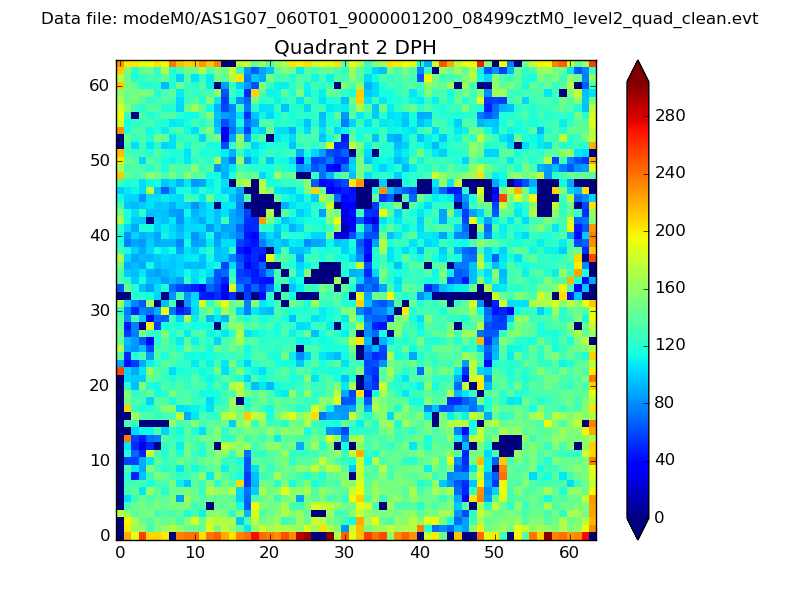
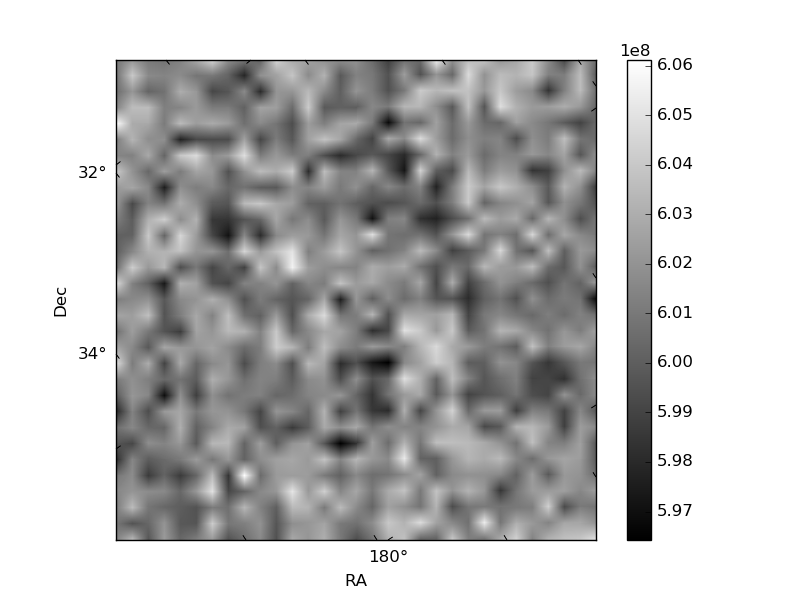
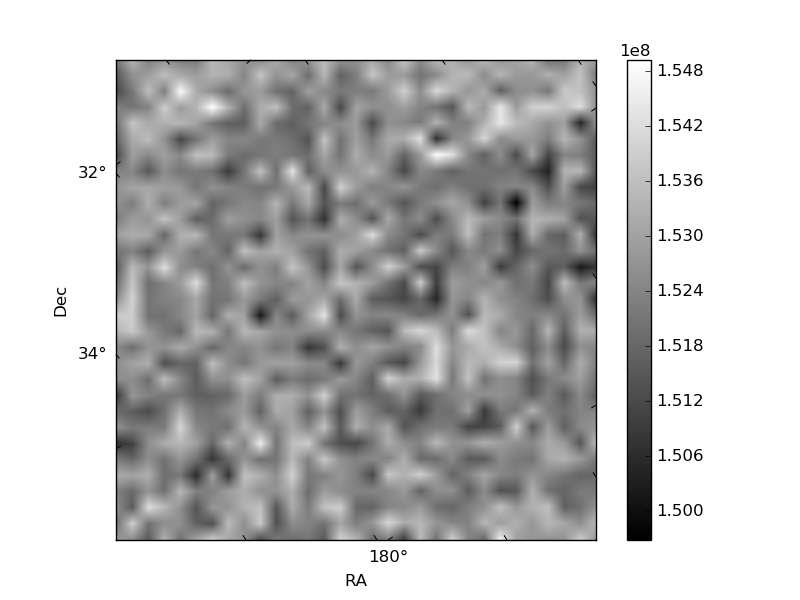
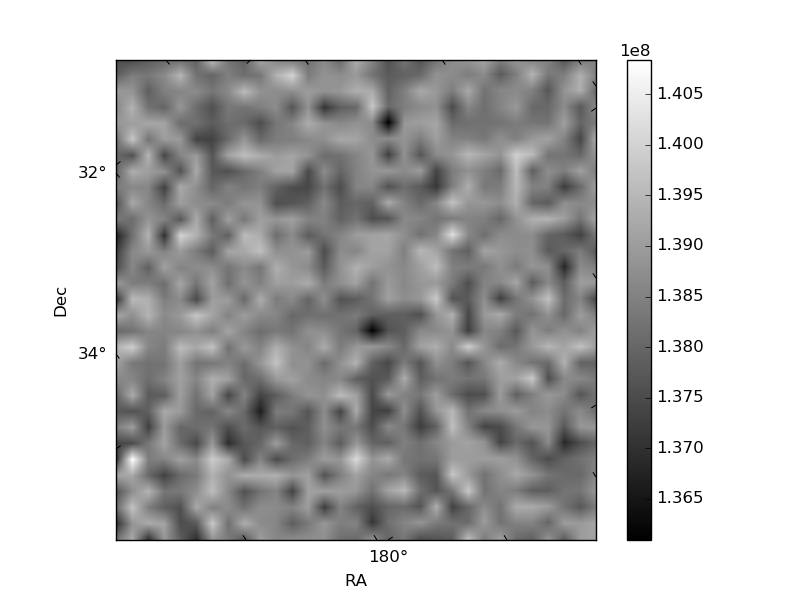
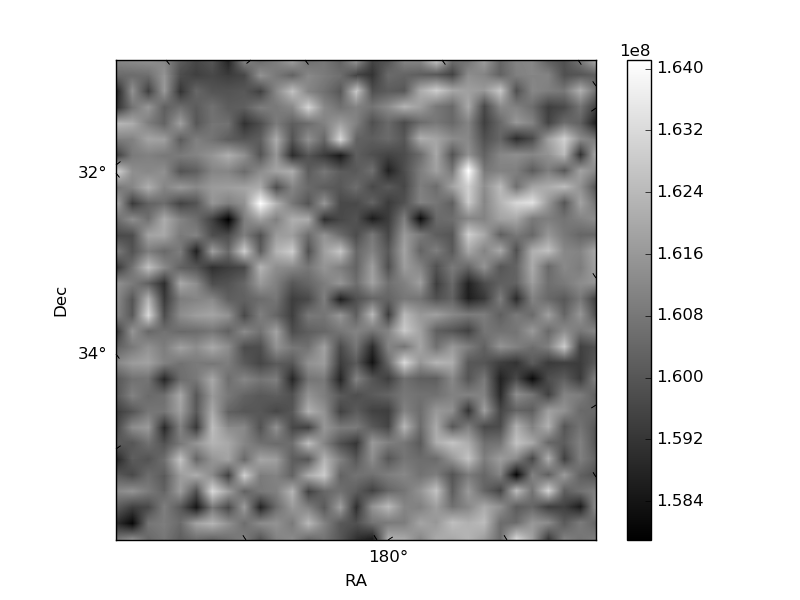
Histogram calculated using DETX and DETY for each event in the final _common_clean file
| Quadrant A | 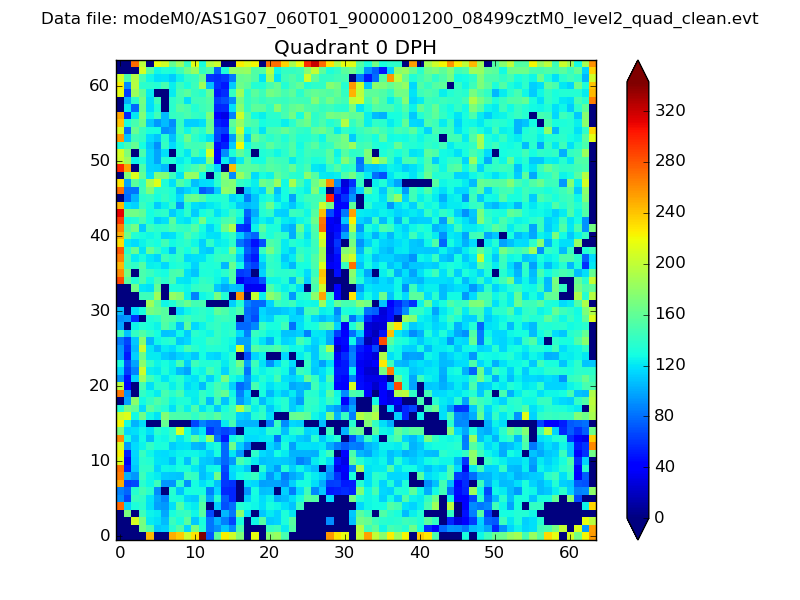 |
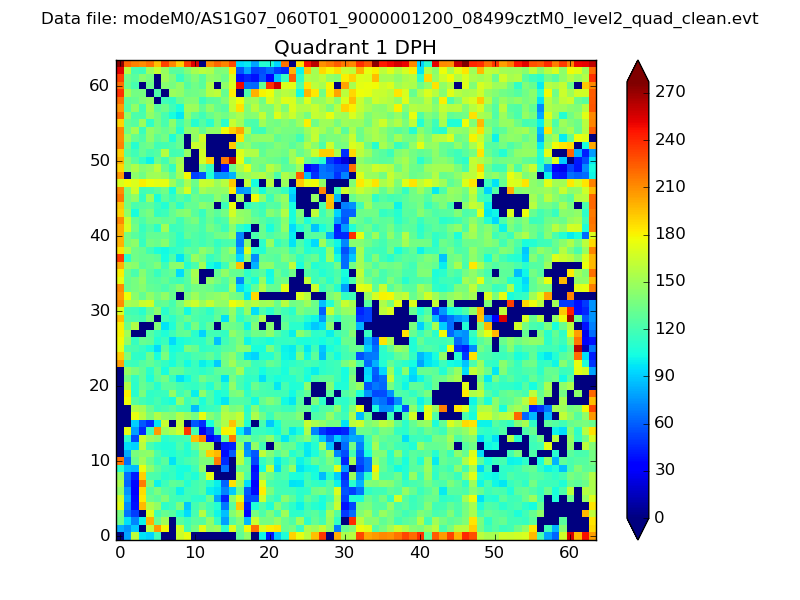 |
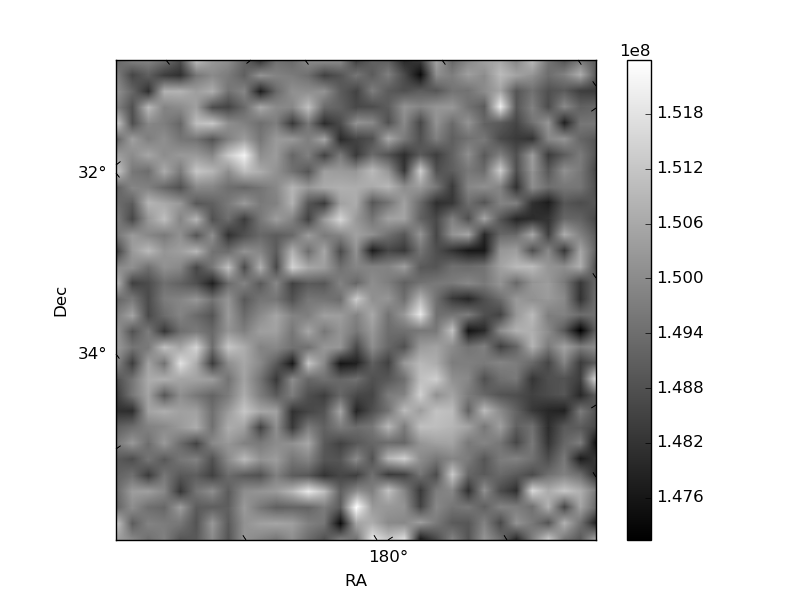
Quadrant B |
|---|---|---|---|
| Quadrant D | 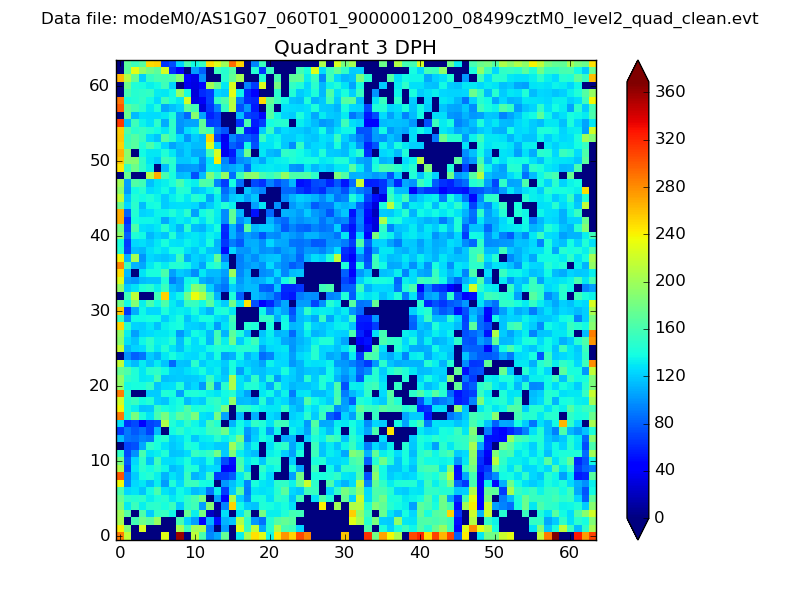 |
 |
Quadrant C |
| Plot type | Count rate plots | Images |
|---|---|---|
| Comparison with Poisson distribution Blue bars denote a histogram of data divided into 1 sec bins. Red curve is a Poisson curve with rate = median count rate of data. |
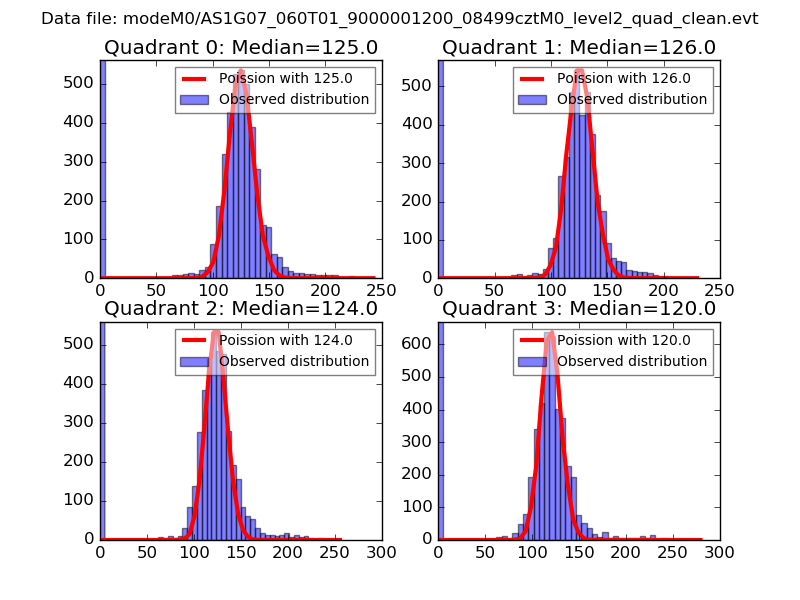 |
 |
| Quadrant-wise count rates Data is divided into 100 sec bins |
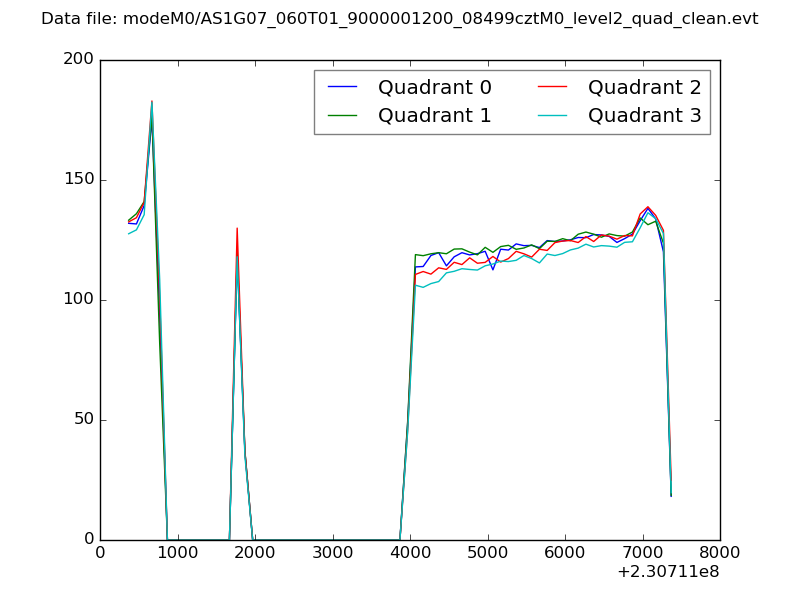 |
|
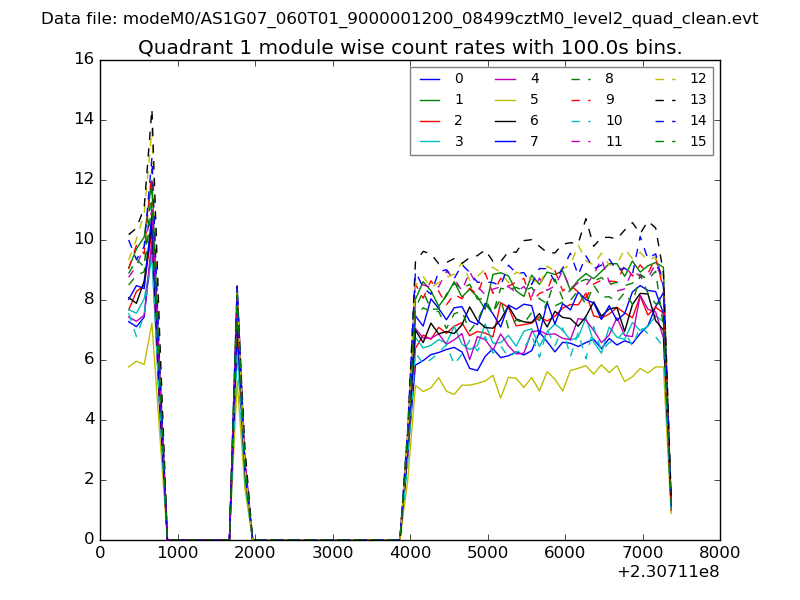
| Module-wise count rates for Quadrant A Data is divided into 100 sec bins |
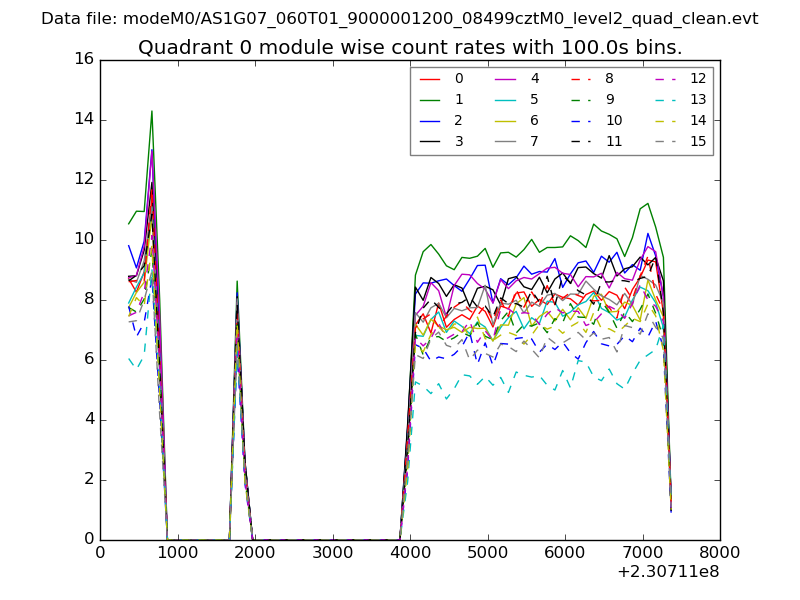 |
 |
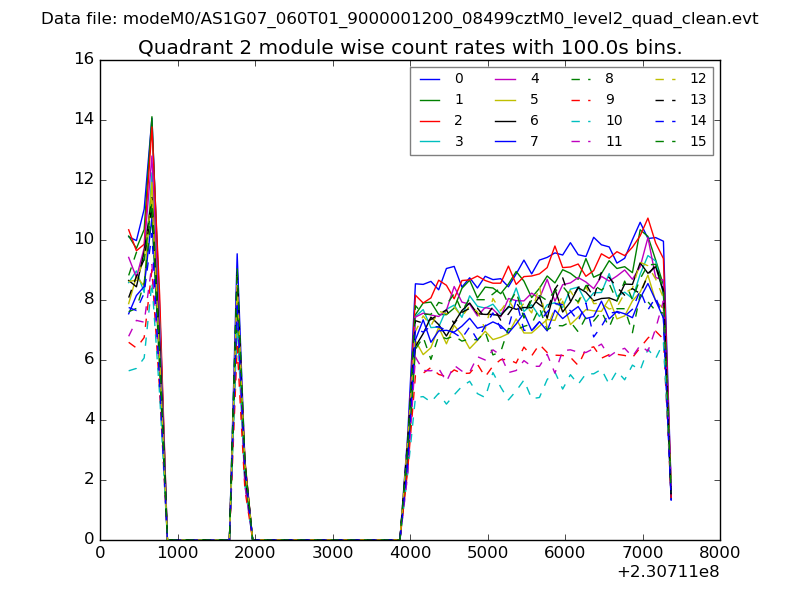
| Module-wise count rates for Quadrant B Data is divided into 100 sec bins |
 |
 |
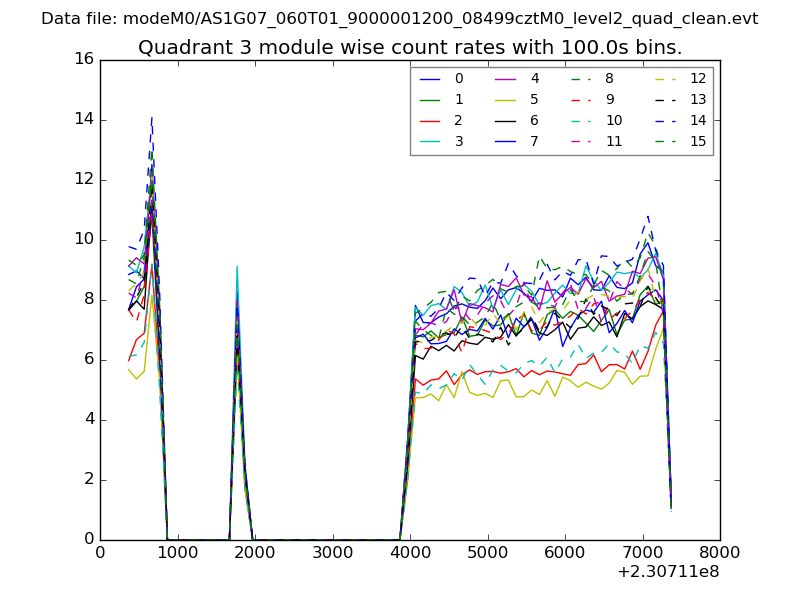
| Module-wise count rates for Quadrant C Data is divided into 100 sec bins |
 |
 |
| Module-wise count rates for Quadrant D Data is divided into 100 sec bins |
 |
 |
| Parameter | Plot |
|---|---|
| CZT HV Monitor | 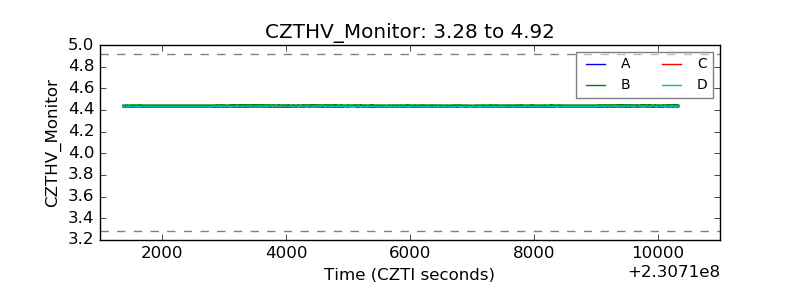 |
| D_VDD | 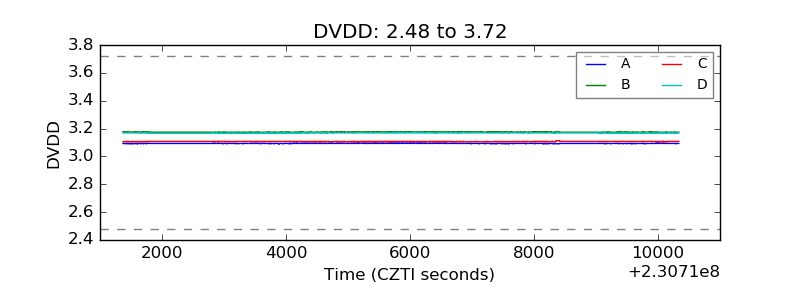 |
| Temperature 1 | 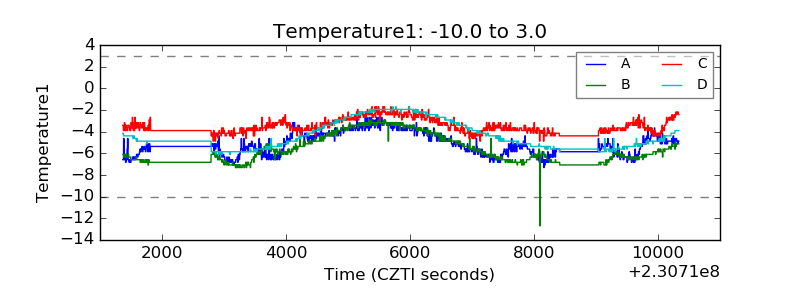 |
| Veto HV Monitor | 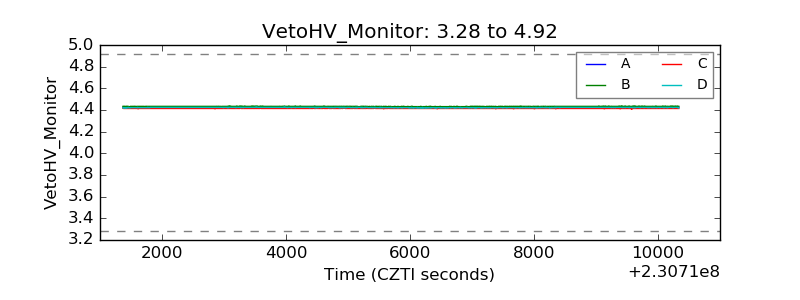 |
| Veto LLD | 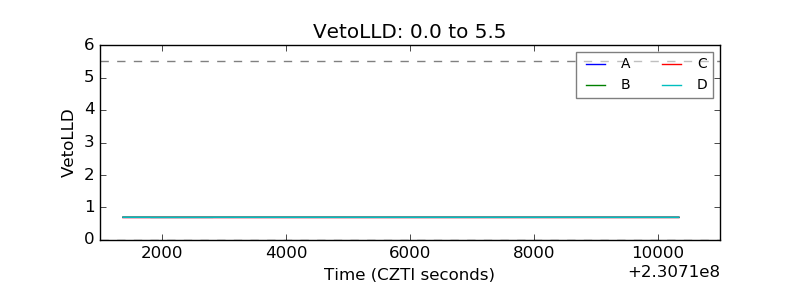 |
| Alpha Counter | 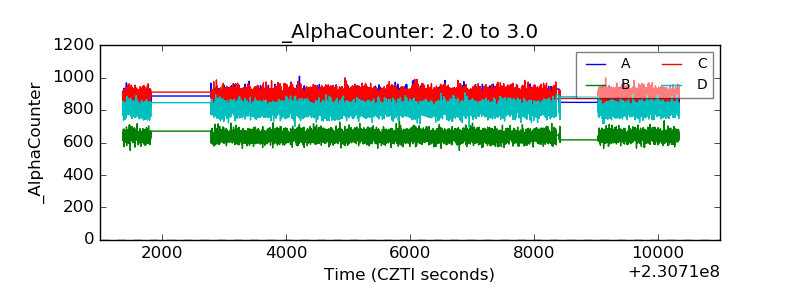 |
| _CPM_Rate | 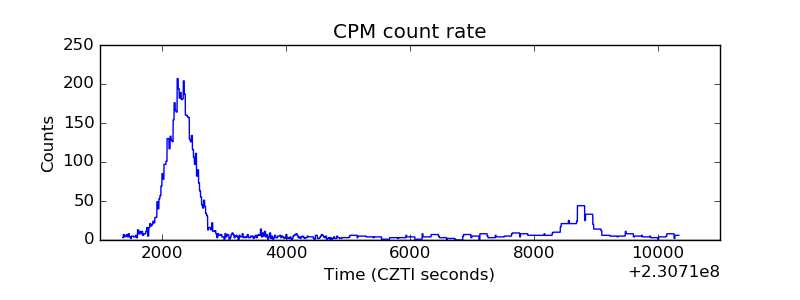 |
| CZT Counter | 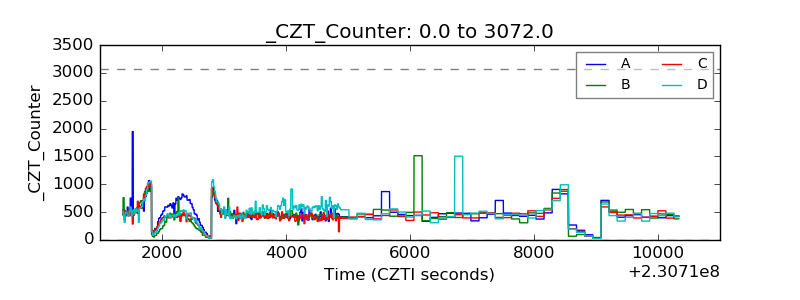 |
| +2.5 Volts monitor |  |
| +5 Volts monitor |  |
| _ROLL_ROT | 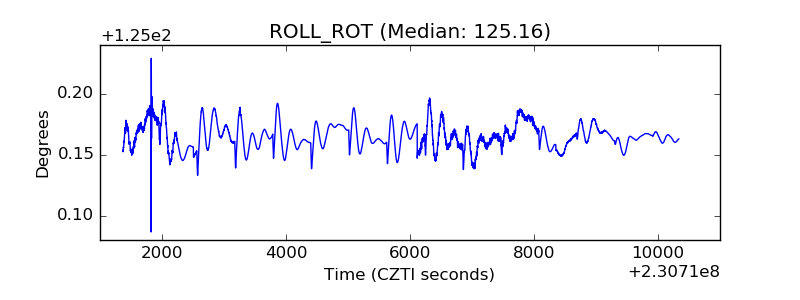 |
| _Roll_DEC | 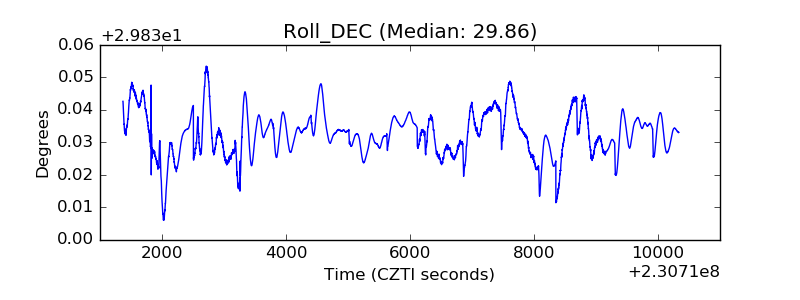 |
| _Roll_RA | 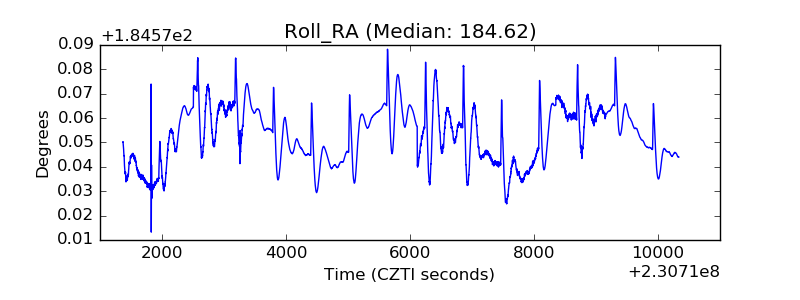 |
| Veto Counter | 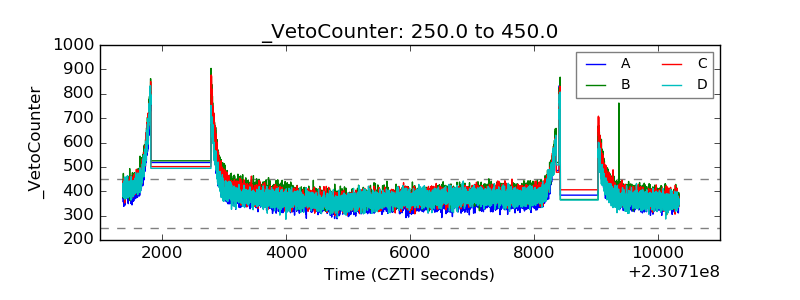 |