| Param | Original file | Final file |
|---|---|---|
| Filename | modeM0/AS1G07_060T01_9000001200_08500cztM0_level2.evt | modeM0/AS1G07_060T01_9000001200_08500cztM0_level2_quad_clean.evt |
| Size (bytes) | 572,860,800 | 97,102,080 |
| Size | 546.3 MB | 92.6 MB |
| Events in quadrant A | 4,064,194 | 590,295 |
| Events in quadrant B | 4,361,233 | 592,454 |
| Events in quadrant C | 3,984,661 | 585,250 |
| Events in quadrant D | 4,348,066 | 568,527 |
| Mode SS | |||
|---|---|---|---|
| Quadrant | BADHDUFLAG | Total packets | Discarded packets |
| A | 0 | 180 | 0 |
| B | 0 | 180 | 0 |
| C | 0 | 180 | 0 |
| D | 0 | 180 | 0 |
| Mode M0 | |||
|---|---|---|---|
| Quadrant | BADHDUFLAG | Total packets | Discarded packets |
| A | 0 | 18162 | 17 |
| B | 0 | 18741 | 14 |
| C | 0 | 18084 | 16 |
| D | 0 | 18798 | 14 |
| Mode M9 | |||
|---|---|---|---|
| Quadrant | BADHDUFLAG | Total packets | Discarded packets |
| A | 0 | 10 | 0 |
| B | 0 | 10 | 0 |
| C | 0 | 10 | 0 |
| D | 0 | 10 | 0 |
| Quadrant | Total seconds | Saturated seconds | Saturation percentage |
|---|---|---|---|
| A | 8714 | 311 | 3.568969% |
| B | 8715 | 348 | 3.993115% |
| C | 8714 | 203 | 2.329585% |
| D | 8716 | 235 | 2.696191% |
Noise dominated data is calculated using 1-second bins in cleaned event files. If a bin has >2000 counts, and if more than 50% of those come from <1% of pixels, then it is considered to be noise-dominated and hence unusable.
| Quadrant | # 1 sec bins | Bins with >0 counts | Bins with >2000 counts | High rate bins dominated by noise | Noise dominated (total time) | Noise dominated (detector-on time) | Marked lightcurve |
|---|---|---|---|---|---|---|---|
| A | 9496 | 8724 | 2 | 2 | 0.02% | 0.02% | 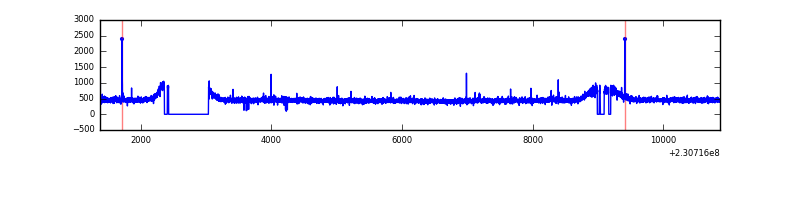 |
| B | 9496 | 8723 | 15 | 15 | 0.16% | 0.17% | 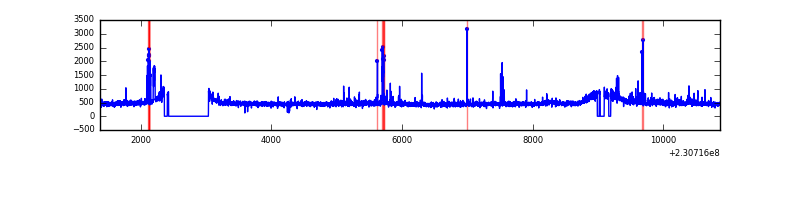 |
| C | 9496 | 8723 | 0 | 0 | 0.00% | 0.00% |  |
| D | 9496 | 8725 | 13 | 13 | 0.14% | 0.15% | 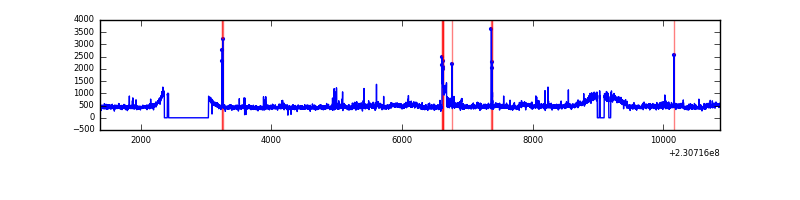 |
Top three noisy pixels from each quadrant. If the there are fewer than three noisy pixels in the level2.evt file, extra rows are filled as -1
| Pixel properties | Quadrant properties | ||||||
|---|---|---|---|---|---|---|---|
| Quadrant | DetID | PixID | Counts | Sigma | Mean | Median | Sigma |
| A | 5 | 16 | 19100 | 83.88 | 1049 | 1022 | 215.5 |
| A | 0 | 226 | 9524 | 39.45 | 1049 | 1022 | 215.5 |
| A | 12 | 194 | 9301 | 38.41 | 1049 | 1022 | 215.5 |
| B | 5 | 255 | 97363 | 469.75 | 1052 | 1023 | 205.1 |
| B | 0 | 214 | 74352 | 357.55 | 1052 | 1023 | 205.1 |
| B | 4 | 81 | 50309 | 240.32 | 1052 | 1023 | 205.1 |
| C | 13 | 61 | 7736 | 28.27 | 1019 | 1022 | 237.5 |
| C | 14 | 82 | 4319 | 13.88 | 1019 | 1022 | 237.5 |
| C | 8 | 222 | 4138 | 13.12 | 1019 | 1022 | 237.5 |
| D | 1 | 52 | 299782 | 1180.52 | 1010 | 980 | 253.1 |
| D | 7 | 71 | 116198 | 455.21 | 1010 | 980 | 253.1 |
| D | 14 | 34 | 49967 | 193.54 | 1010 | 980 | 253.1 |
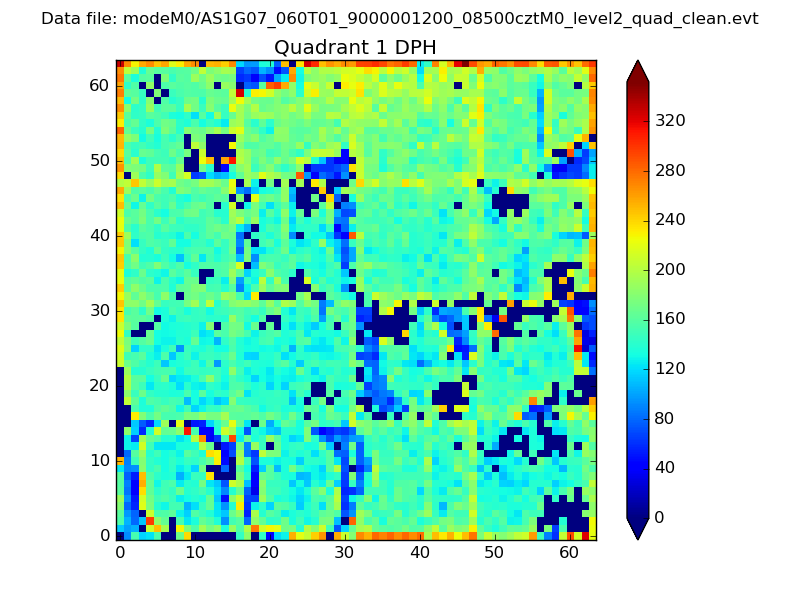
Histogram calculated using DETX and DETY for each event in the final _common_clean file
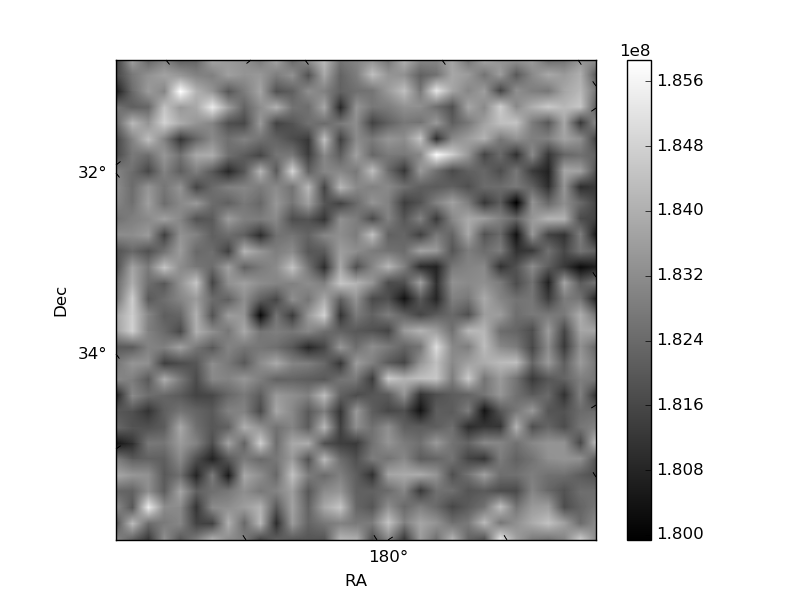
| Quadrant A | 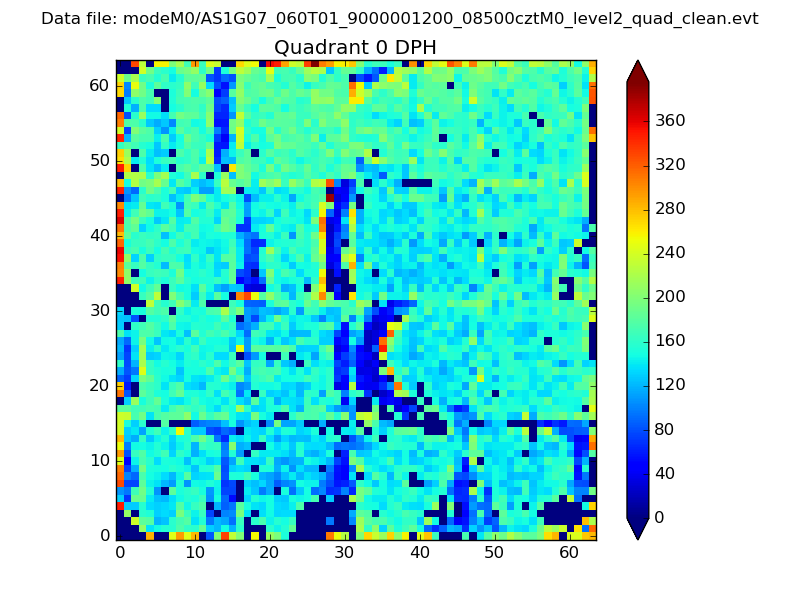 |
 |
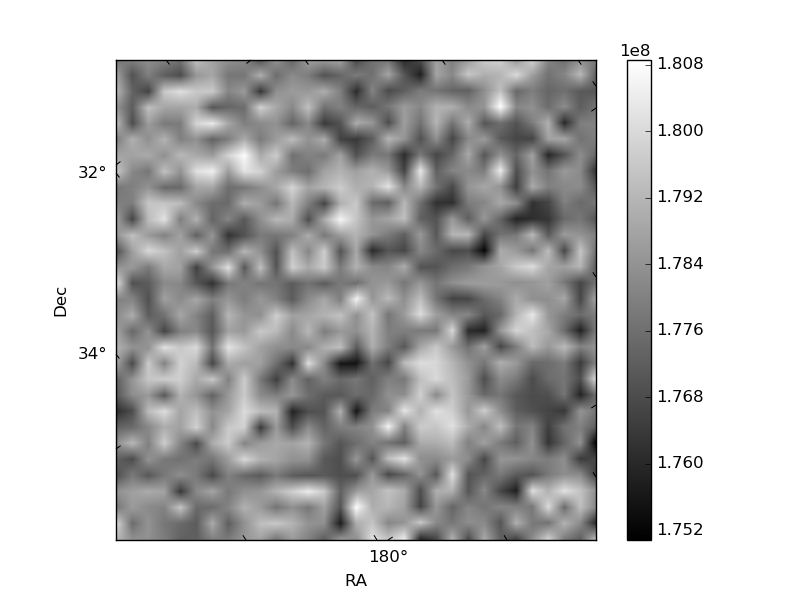
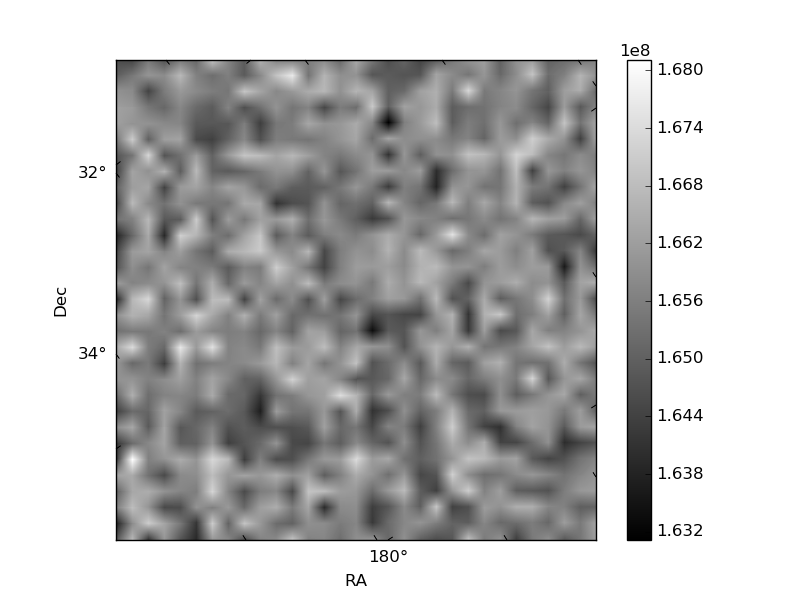
Quadrant B |
|---|---|---|---|
| Quadrant D | 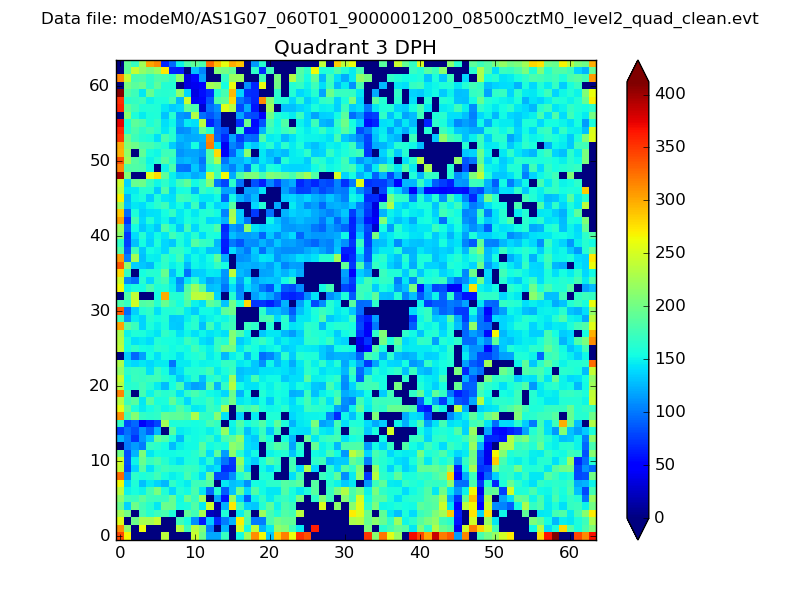 |
 |
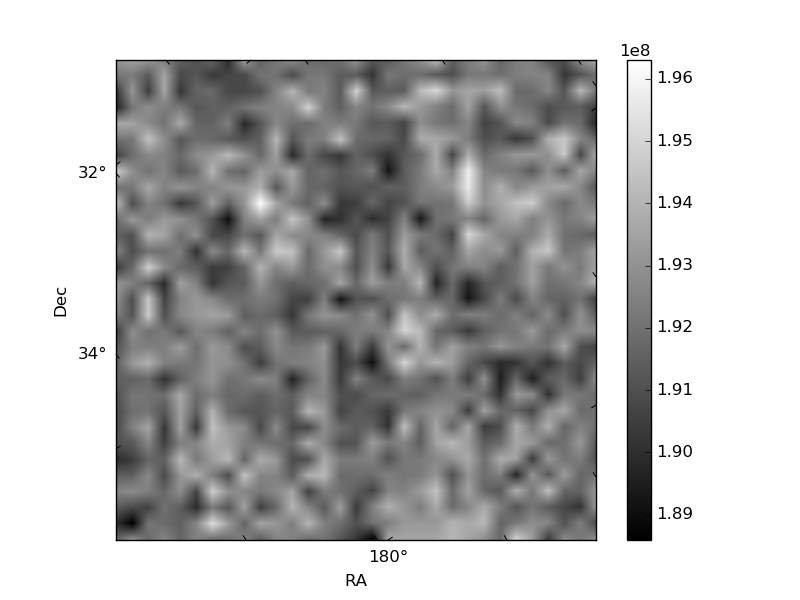
Quadrant C |
| Plot type | Count rate plots | Images |
|---|---|---|
| Comparison with Poisson distribution Blue bars denote a histogram of data divided into 1 sec bins. Red curve is a Poisson curve with rate = median count rate of data. |
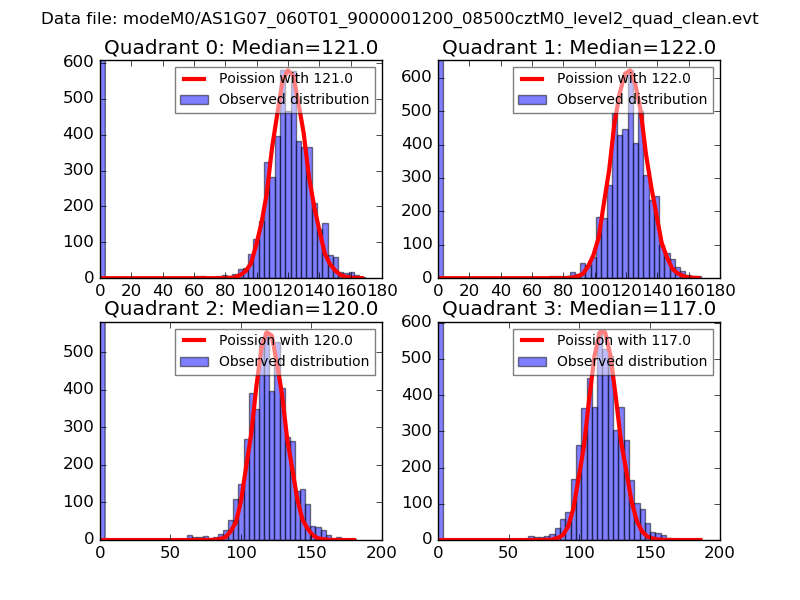 |
 |
| Quadrant-wise count rates Data is divided into 100 sec bins |
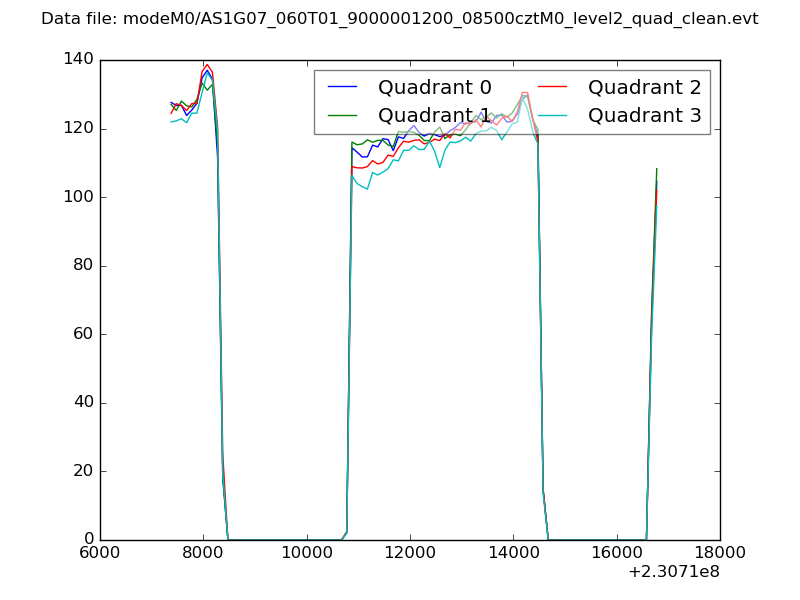 |
|
| Module-wise count rates for Quadrant A Data is divided into 100 sec bins |
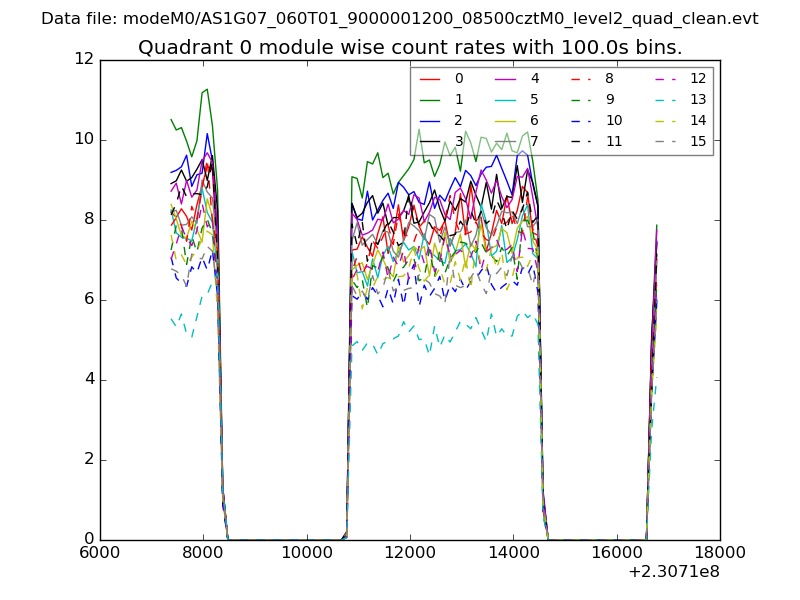 |
 |
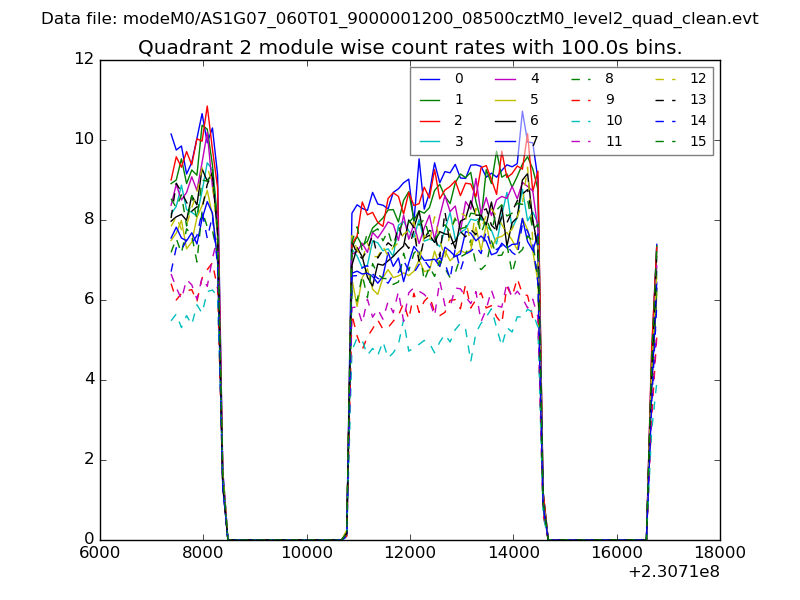
| Module-wise count rates for Quadrant B Data is divided into 100 sec bins |
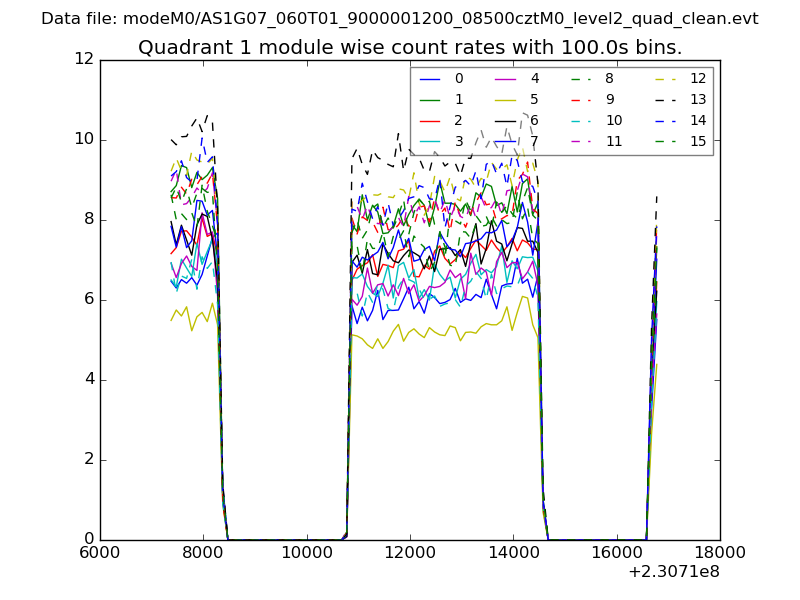 |
 |
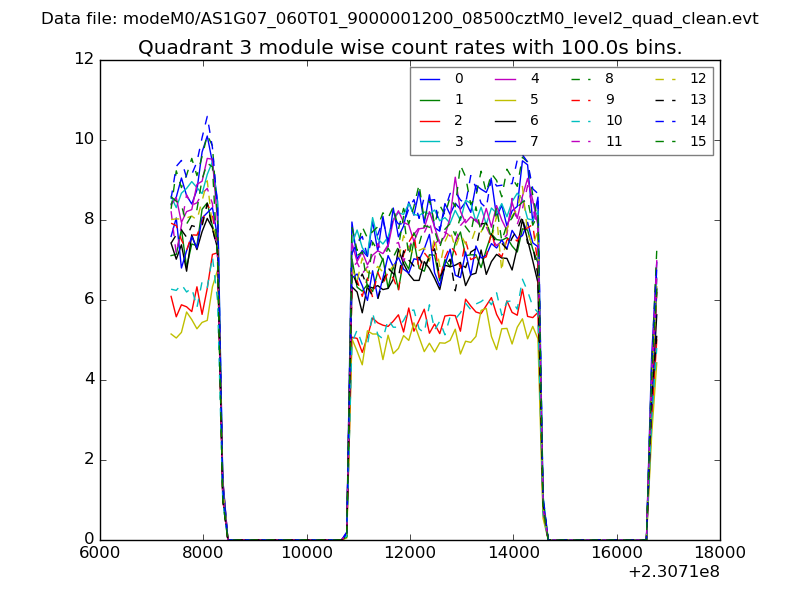
| Module-wise count rates for Quadrant C Data is divided into 100 sec bins |
 |
 |
| Module-wise count rates for Quadrant D Data is divided into 100 sec bins |
 |
 |
| Parameter | Plot |
|---|---|
| CZT HV Monitor | 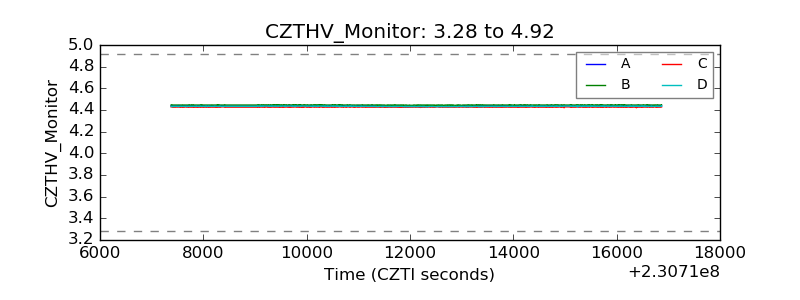 |
| D_VDD |  |
| Temperature 1 | 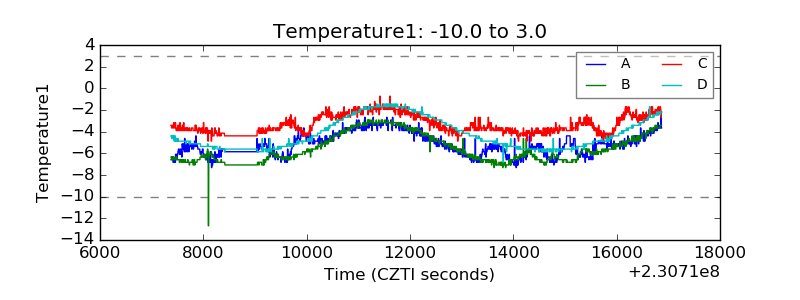 |
| Veto HV Monitor |  |
| Veto LLD | 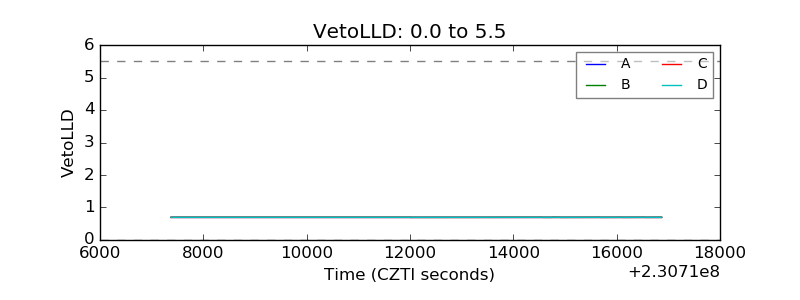 |
| Alpha Counter | 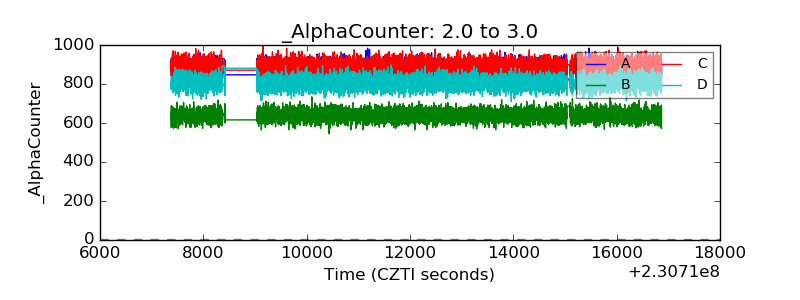 |
| _CPM_Rate | 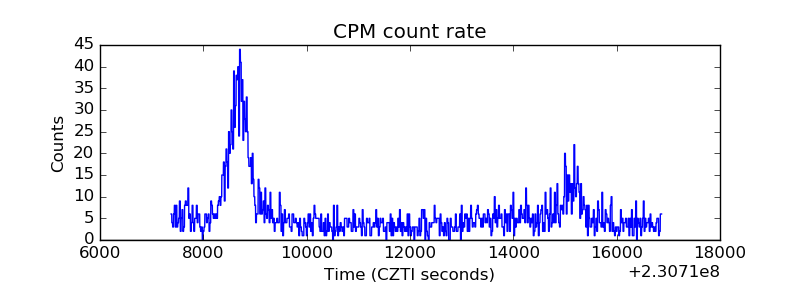 |
| CZT Counter |  |
| +2.5 Volts monitor |  |
| +5 Volts monitor |  |
| _ROLL_ROT | 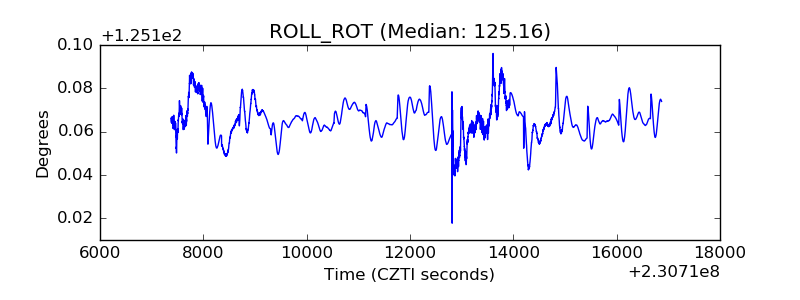 |
| _Roll_DEC | 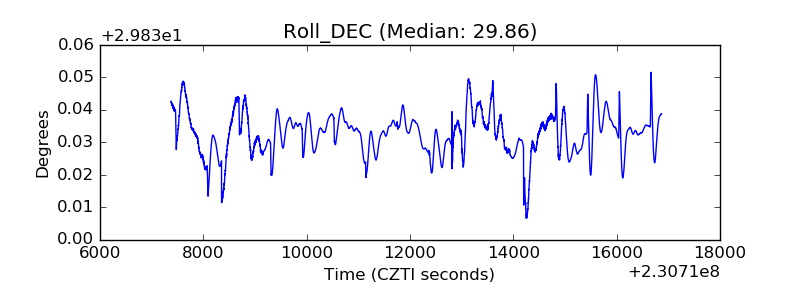 |
| _Roll_RA |  |
| Veto Counter | 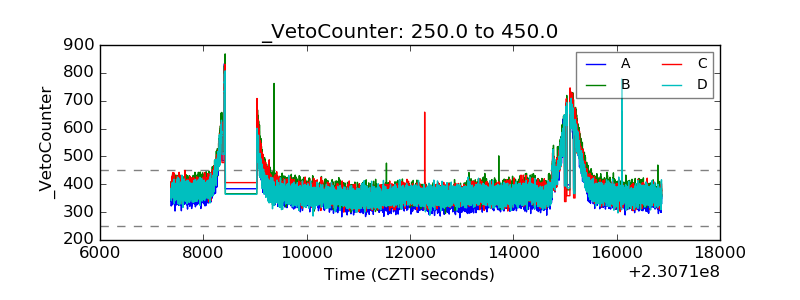 |