| Param | Original file | Final file |
|---|---|---|
| Filename | modeM0/AS1G07_060T01_9000001200_08501cztM0_level2.evt | modeM0/AS1G07_060T01_9000001200_08501cztM0_level2_quad_clean.evt |
| Size (bytes) | 579,427,200 | 83,975,040 |
| Size | 552.6 MB | 80.1 MB |
| Events in quadrant A | 4,645,971 | 501,685 |
| Events in quadrant B | 4,075,512 | 504,184 |
| Events in quadrant C | 3,762,338 | 493,576 |
| Events in quadrant D | 4,512,503 | 479,125 |
| Mode SS | |||
|---|---|---|---|
| Quadrant | BADHDUFLAG | Total packets | Discarded packets |
| A | 0 | 166 | 0 |
| B | 0 | 166 | 0 |
| C | 0 | 166 | 0 |
| D | 0 | 166 | 0 |
| Mode M0 | |||
|---|---|---|---|
| Quadrant | BADHDUFLAG | Total packets | Discarded packets |
| A | 0 | 19576 | 3 |
| B | 0 | 17550 | 2 |
| C | 0 | 17020 | 2 |
| D | 0 | 18798 | 2 |
| Mode M9 | |||
|---|---|---|---|
| Quadrant | BADHDUFLAG | Total packets | Discarded packets |
| A | 0 | 4 | 0 |
| B | 0 | 4 | 0 |
| C | 0 | 4 | 0 |
| D | 0 | 4 | 0 |
| Quadrant | Total seconds | Saturated seconds | Saturation percentage |
|---|---|---|---|
| A | 8134 | 748 | 9.195968% |
| B | 8134 | 456 | 5.606098% |
| C | 8134 | 295 | 3.626752% |
| D | 8134 | 359 | 4.413573% |
Noise dominated data is calculated using 1-second bins in cleaned event files. If a bin has >2000 counts, and if more than 50% of those come from <1% of pixels, then it is considered to be noise-dominated and hence unusable.
| Quadrant | # 1 sec bins | Bins with >0 counts | Bins with >2000 counts | High rate bins dominated by noise | Noise dominated (total time) | Noise dominated (detector-on time) | Marked lightcurve |
|---|---|---|---|---|---|---|---|
| A | 8294 | 8137 | 138 | 138 | 1.66% | 1.70% |  |
| B | 8294 | 8136 | 7 | 7 | 0.08% | 0.09% |  |
| C | 8294 | 8137 | 0 | 0 | 0.00% | 0.00% | 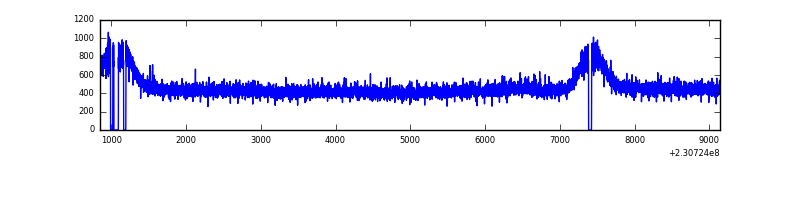 |
| D | 8294 | 8138 | 7 | 7 | 0.08% | 0.09% | 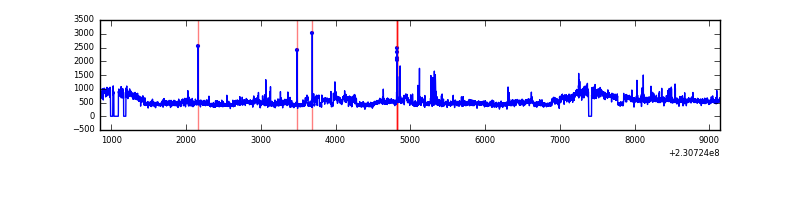 |
Top three noisy pixels from each quadrant. If the there are fewer than three noisy pixels in the level2.evt file, extra rows are filled as -1
| Pixel properties | Quadrant properties | ||||||
|---|---|---|---|---|---|---|---|
| Quadrant | DetID | PixID | Counts | Sigma | Mean | Median | Sigma |
| A | 15 | 236 | 867574 | 4318.91 | 973 | 947 | 200.7 |
| A | 5 | 16 | 27642 | 133.04 | 973 | 947 | 200.7 |
| A | 13 | 251 | 9428 | 42.27 | 973 | 947 | 200.7 |
| B | 4 | 81 | 86442 | 446.13 | 985 | 957 | 191.6 |
| B | 0 | 231 | 54138 | 277.54 | 985 | 957 | 191.6 |
| B | 0 | 214 | 49628 | 254.01 | 985 | 957 | 191.6 |
| C | 13 | 61 | 7316 | 28.39 | 961 | 962 | 223.8 |
| C | 8 | 128 | 5846 | 21.82 | 961 | 962 | 223.8 |
| C | 8 | 222 | 3660 | 12.05 | 961 | 962 | 223.8 |
| D | 1 | 52 | 757984 | 3224.08 | 953 | 925 | 234.8 |
| D | 14 | 34 | 106094 | 447.88 | 953 | 925 | 234.8 |
| D | 2 | 234 | 29103 | 120.0 | 953 | 925 | 234.8 |
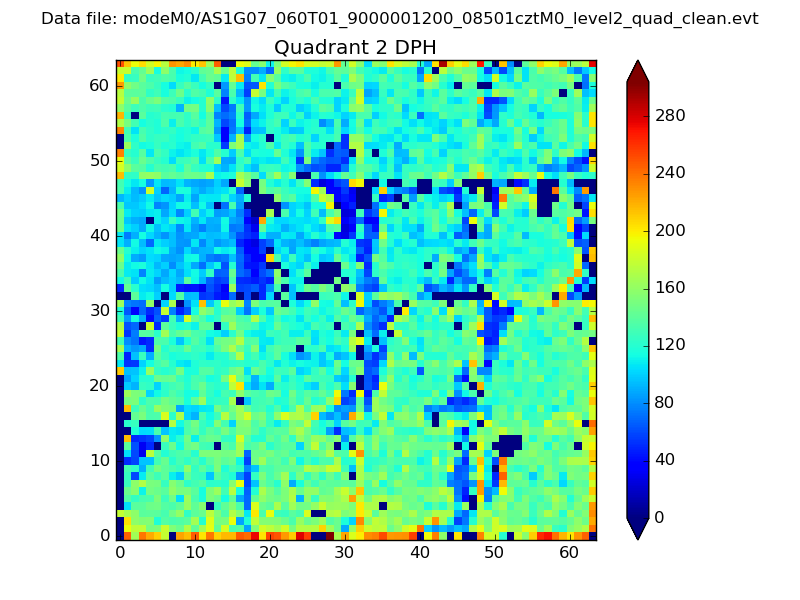
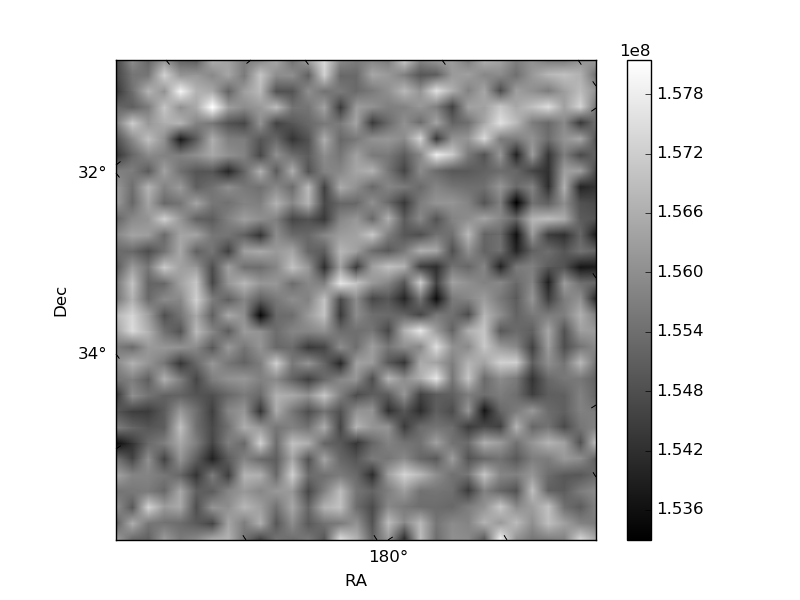
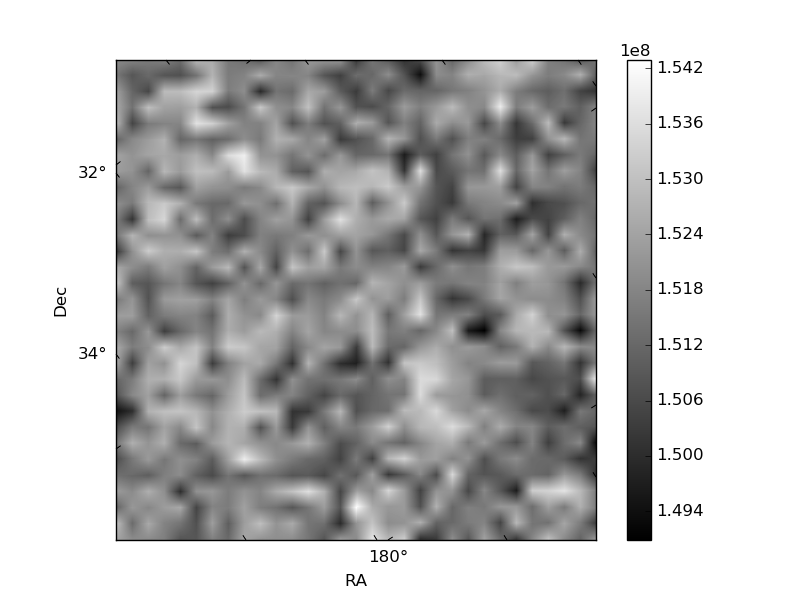
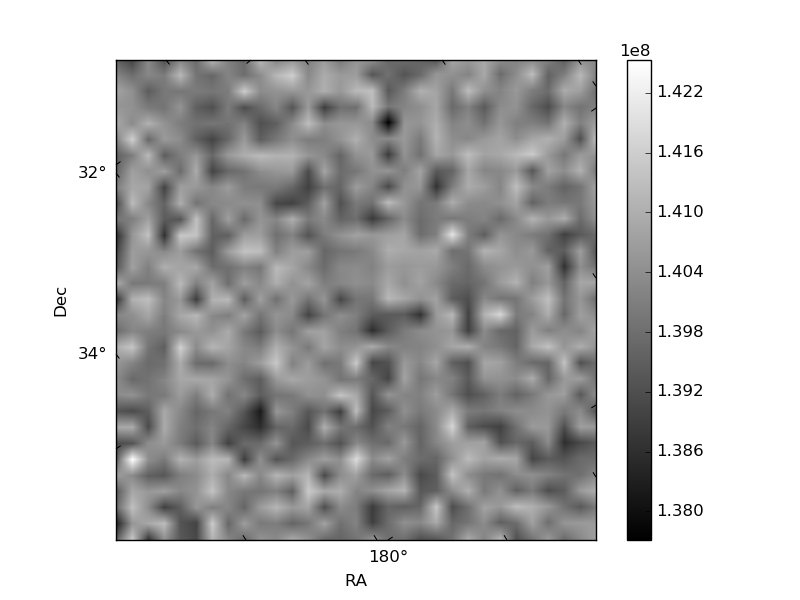
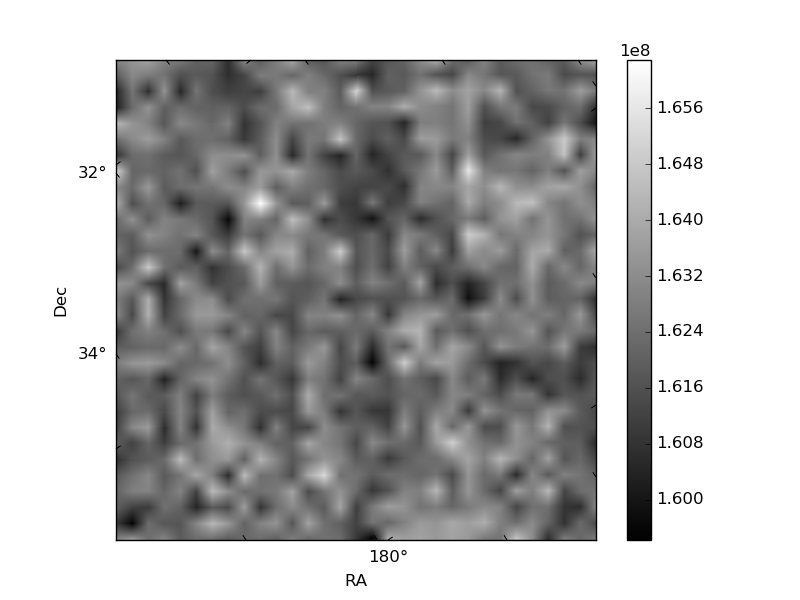
Histogram calculated using DETX and DETY for each event in the final _common_clean file
| Quadrant A | 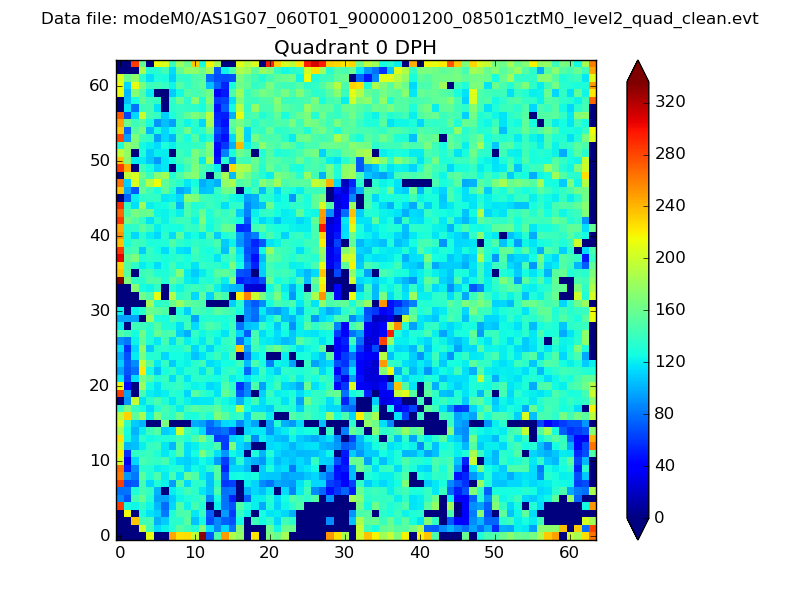 |
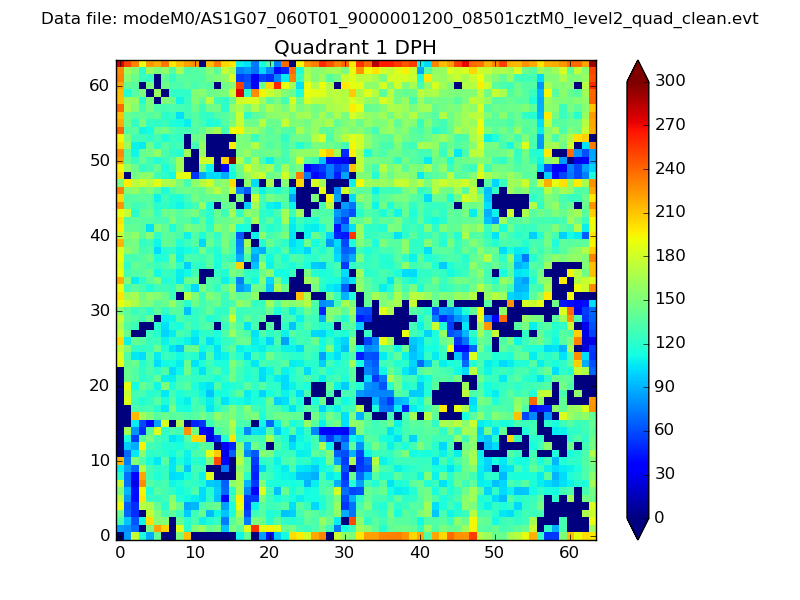 |
Quadrant B |
|---|---|---|---|
| Quadrant D | 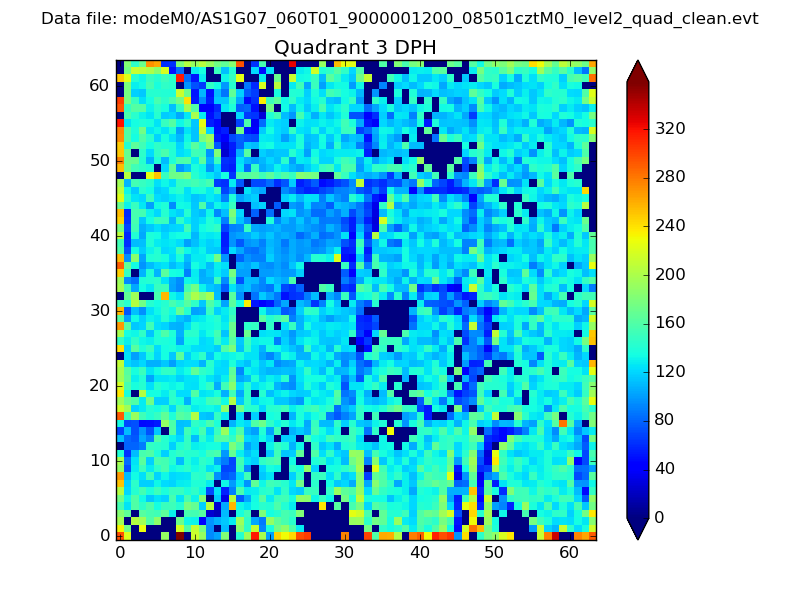 |
 |
Quadrant C |
| Plot type | Count rate plots | Images |
|---|---|---|
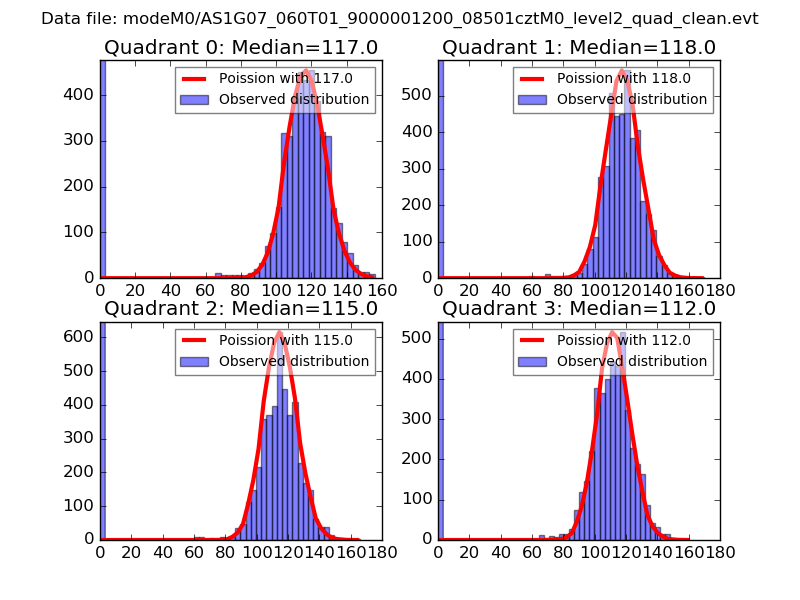
| Comparison with Poisson distribution Blue bars denote a histogram of data divided into 1 sec bins. Red curve is a Poisson curve with rate = median count rate of data. |
 |
 |
| Quadrant-wise count rates Data is divided into 100 sec bins |
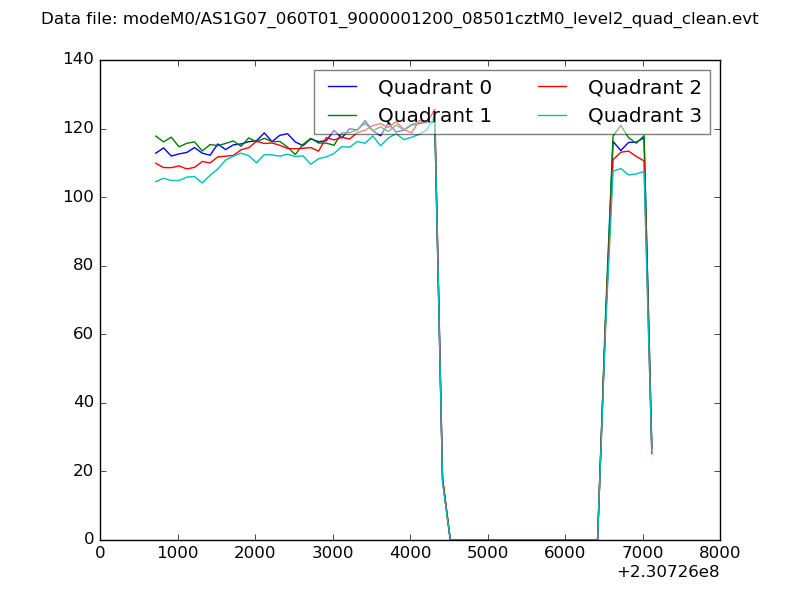 |
|
| Module-wise count rates for Quadrant A Data is divided into 100 sec bins |
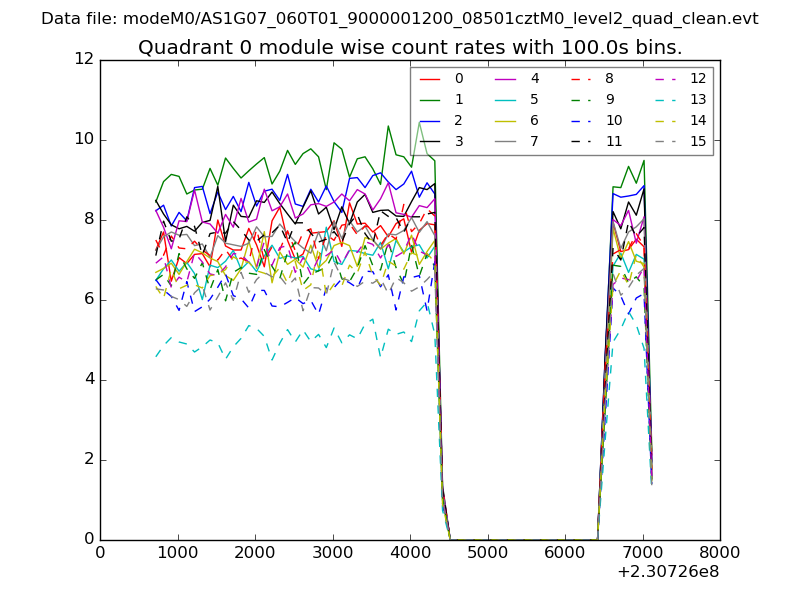 |
 |
| Module-wise count rates for Quadrant B Data is divided into 100 sec bins |
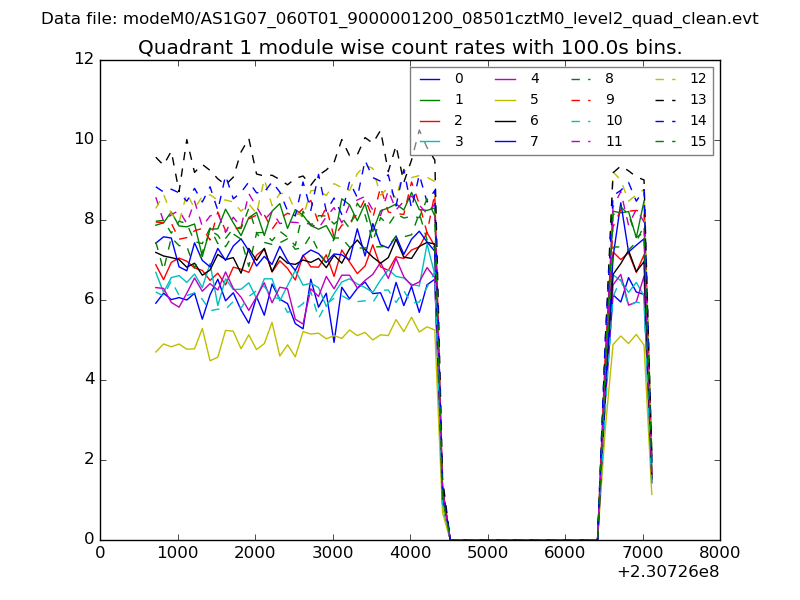 |
 |
| Module-wise count rates for Quadrant C Data is divided into 100 sec bins |
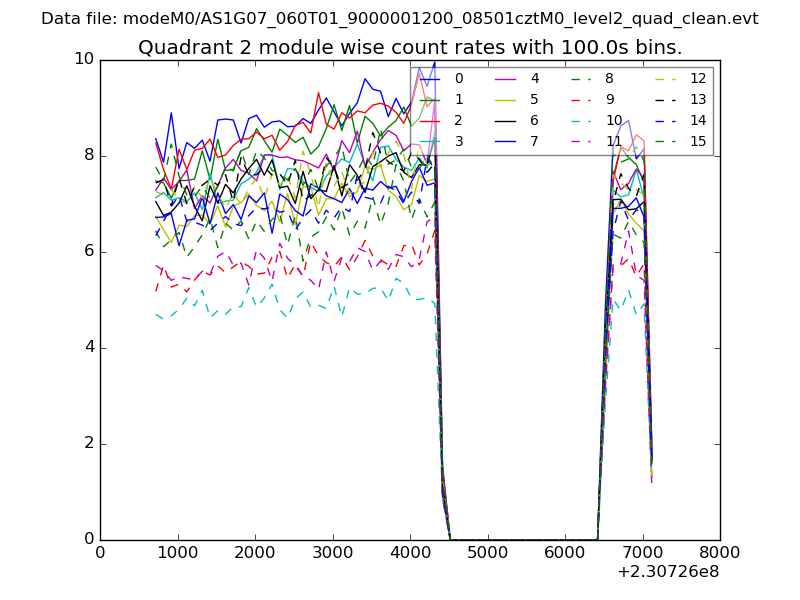 |
 |
| Module-wise count rates for Quadrant D Data is divided into 100 sec bins |
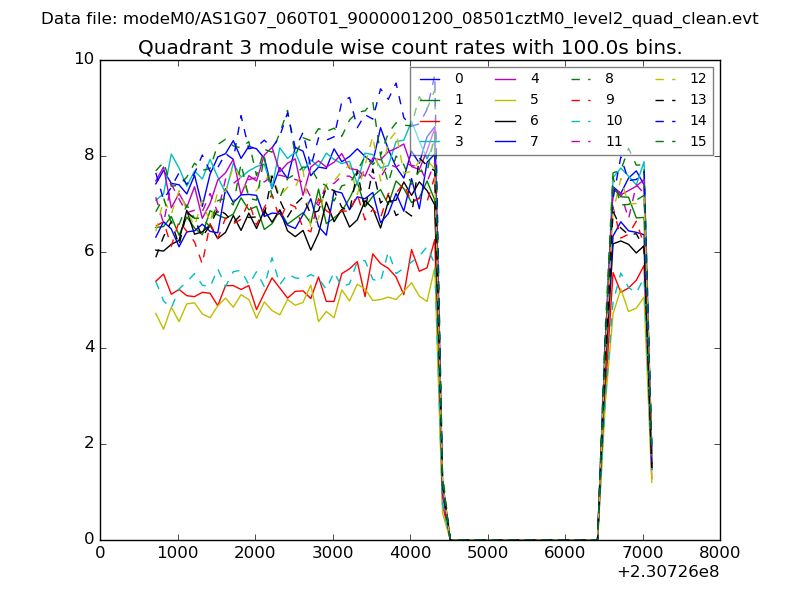 |
 |
| Parameter | Plot |
|---|---|
| CZT HV Monitor | 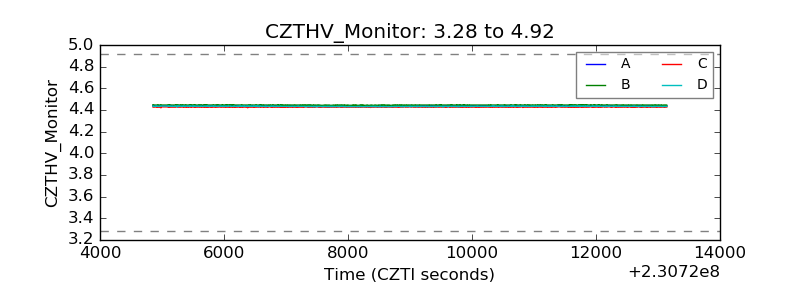 |
| D_VDD | 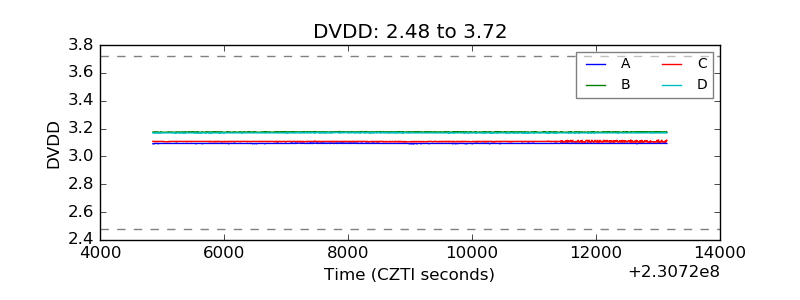 |
| Temperature 1 | 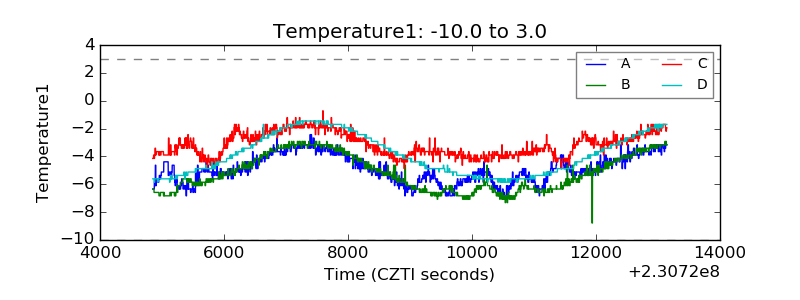 |
| Veto HV Monitor | 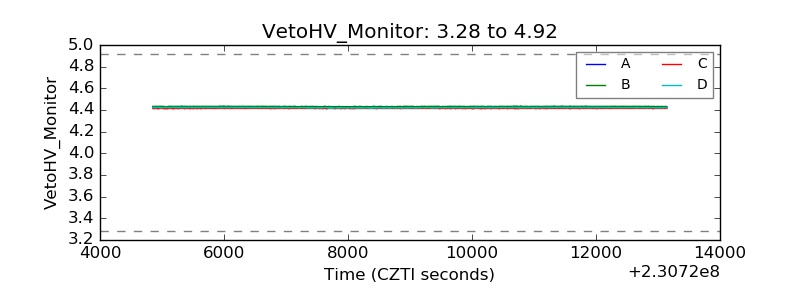 |
| Veto LLD | 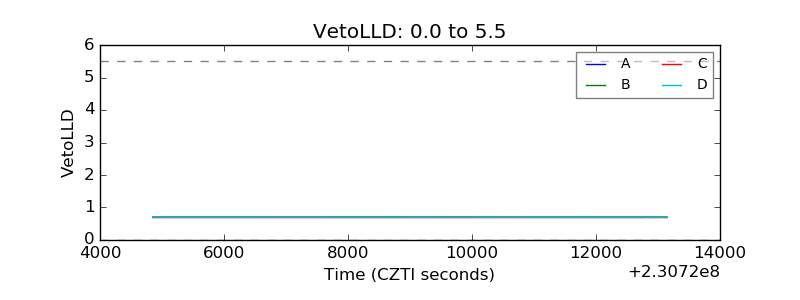 |
| Alpha Counter | 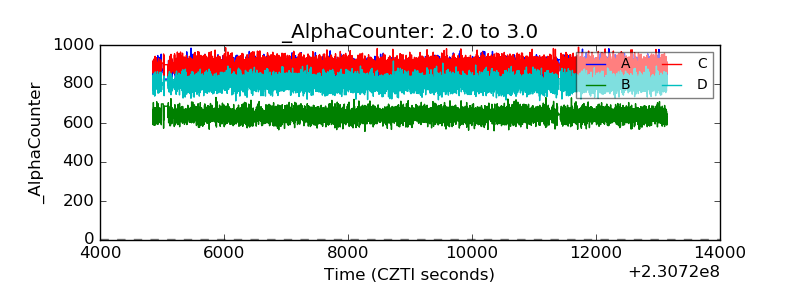 |
| _CPM_Rate | 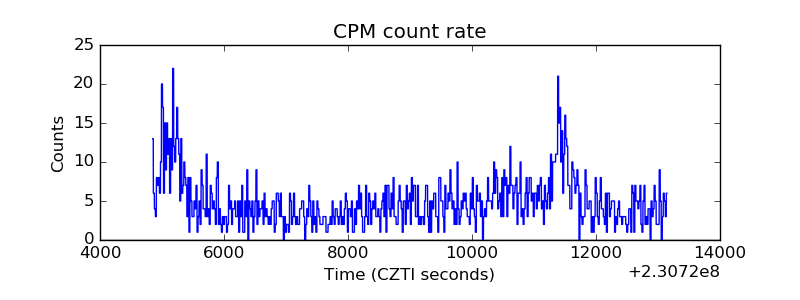 |
| CZT Counter | 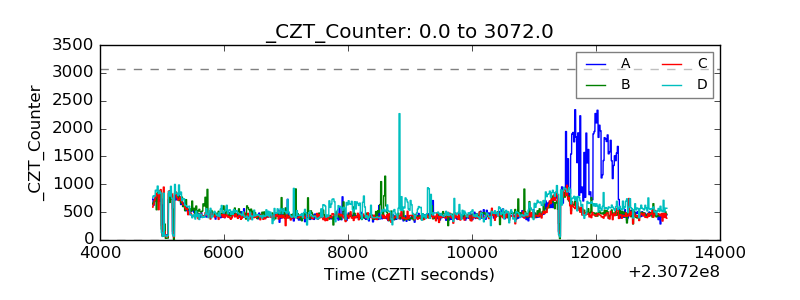 |
| +2.5 Volts monitor |  |
| +5 Volts monitor |  |
| _ROLL_ROT | 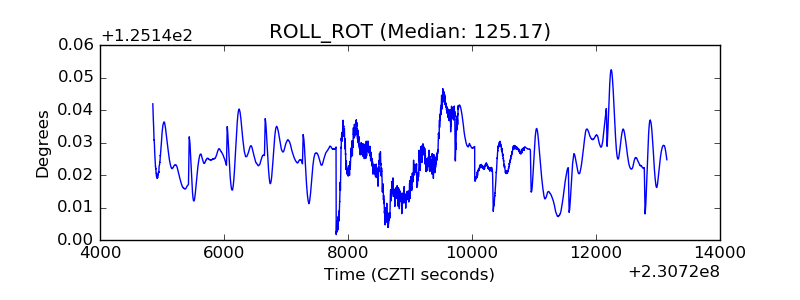 |
| _Roll_DEC | 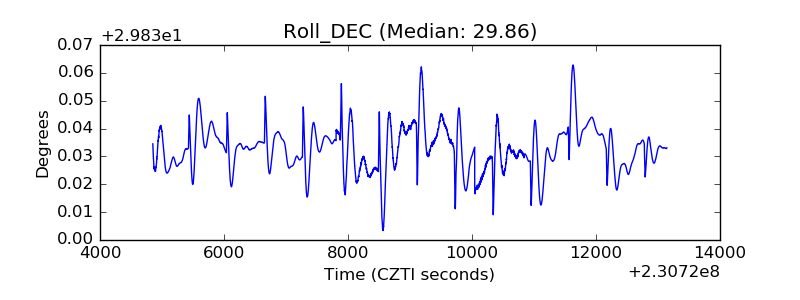 |
| _Roll_RA | 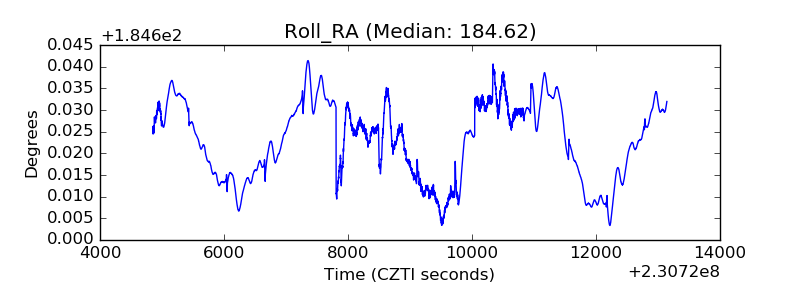 |
| Veto Counter | 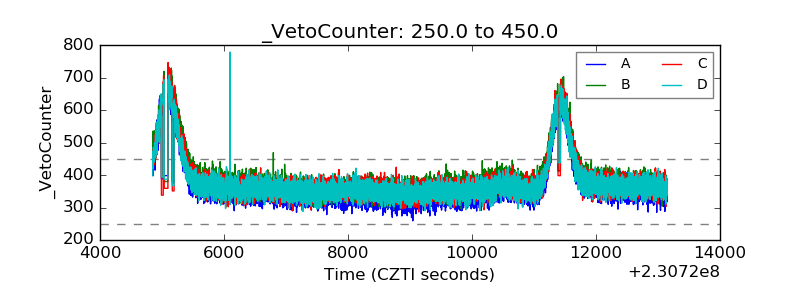 |