| Param | Original file | Final file |
|---|---|---|
| Filename | modeM0/AS1G07_060T01_9000001200_08506cztM0_level2.evt | modeM0/AS1G07_060T01_9000001200_08506cztM0_level2_quad_clean.evt |
| Size (bytes) | 434,698,560 | 89,907,840 |
| Size | 414.6 MB | 85.7 MB |
| Events in quadrant A | 3,108,611 | 570,133 |
| Events in quadrant B | 3,424,038 | 570,503 |
| Events in quadrant C | 2,965,042 | 567,224 |
| Events in quadrant D | 3,216,058 | 552,301 |
| Mode SS | |||
|---|---|---|---|
| Quadrant | BADHDUFLAG | Total packets | Discarded packets |
| A | 0 | 132 | 0 |
| B | 0 | 132 | 0 |
| C | 0 | 132 | 0 |
| D | 0 | 132 | 0 |
| Mode M0 | |||
|---|---|---|---|
| Quadrant | BADHDUFLAG | Total packets | Discarded packets |
| A | 0 | 13981 | 3 |
| B | 0 | 14738 | 2 |
| C | 0 | 13611 | 2 |
| D | 0 | 14024 | 2 |
| Mode M9 | |||
|---|---|---|---|
| Quadrant | BADHDUFLAG | Total packets | Discarded packets |
| A | 0 | 14 | 0 |
| B | 0 | 14 | 0 |
| C | 0 | 14 | 0 |
| D | 0 | 15 | 0 |
| Quadrant | Total seconds | Saturated seconds | Saturation percentage |
|---|---|---|---|
| A | 6642 | 69 | 1.038844% |
| B | 6642 | 101 | 1.520626% |
| C | 6642 | 25 | 0.376393% |
| D | 6642 | 37 | 0.557061% |
Noise dominated data is calculated using 1-second bins in cleaned event files. If a bin has >2000 counts, and if more than 50% of those come from <1% of pixels, then it is considered to be noise-dominated and hence unusable.
| Quadrant | # 1 sec bins | Bins with >0 counts | Bins with >2000 counts | High rate bins dominated by noise | Noise dominated (total time) | Noise dominated (detector-on time) | Marked lightcurve |
|---|---|---|---|---|---|---|---|
| A | 7662 | 6643 | 29 | 29 | 0.38% | 0.44% | 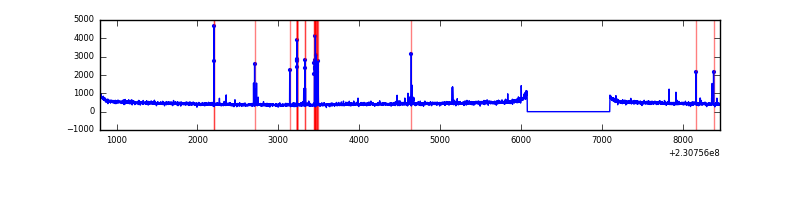 |
| B | 7662 | 6643 | 34 | 34 | 0.44% | 0.51% | 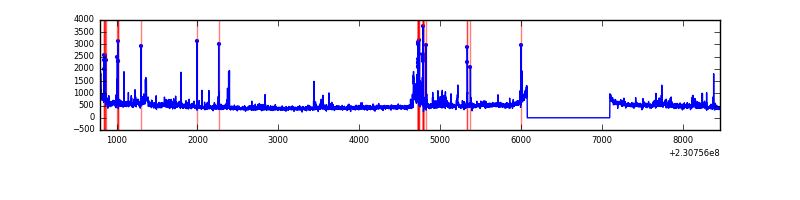 |
| C | 7662 | 6643 | 0 | 0 | 0.00% | 0.00% | 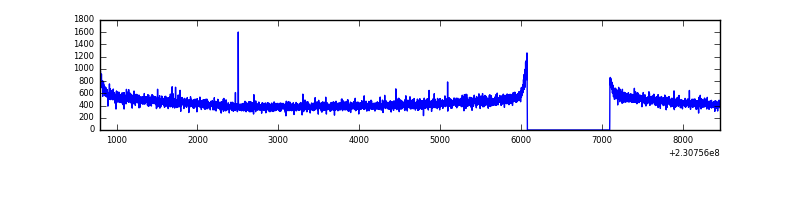 |
| D | 7662 | 6643 | 7 | 7 | 0.09% | 0.11% | 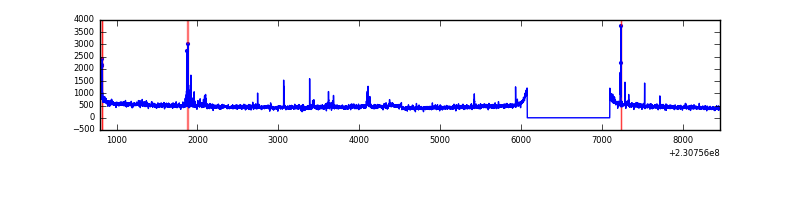 |
Top three noisy pixels from each quadrant. If the there are fewer than three noisy pixels in the level2.evt file, extra rows are filled as -1
| Pixel properties | Quadrant properties | ||||||
|---|---|---|---|---|---|---|---|
| Quadrant | DetID | PixID | Counts | Sigma | Mean | Median | Sigma |
| A | 5 | 16 | 134206 | 848.99 | 771 | 751 | 157.2 |
| A | 13 | 251 | 7246 | 41.32 | 771 | 751 | 157.2 |
| A | 0 | 226 | 7124 | 40.54 | 771 | 751 | 157.2 |
| B | 4 | 81 | 149186 | 1013.58 | 771 | 753 | 146.4 |
| B | 10 | 16 | 95493 | 646.93 | 771 | 753 | 146.4 |
| B | 0 | 214 | 45595 | 306.2 | 771 | 753 | 146.4 |
| C | 13 | 61 | 5667 | 27.78 | 758 | 761 | 176.6 |
| C | 12 | 4 | 3702 | 16.65 | 758 | 761 | 176.6 |
| C | 8 | 222 | 3284 | 14.28 | 758 | 761 | 176.6 |
| D | 1 | 52 | 244497 | 1333.16 | 751 | 735 | 182.8 |
| D | 13 | 122 | 47887 | 257.88 | 751 | 735 | 182.8 |
| D | 9 | 64 | 26934 | 143.29 | 751 | 735 | 182.8 |
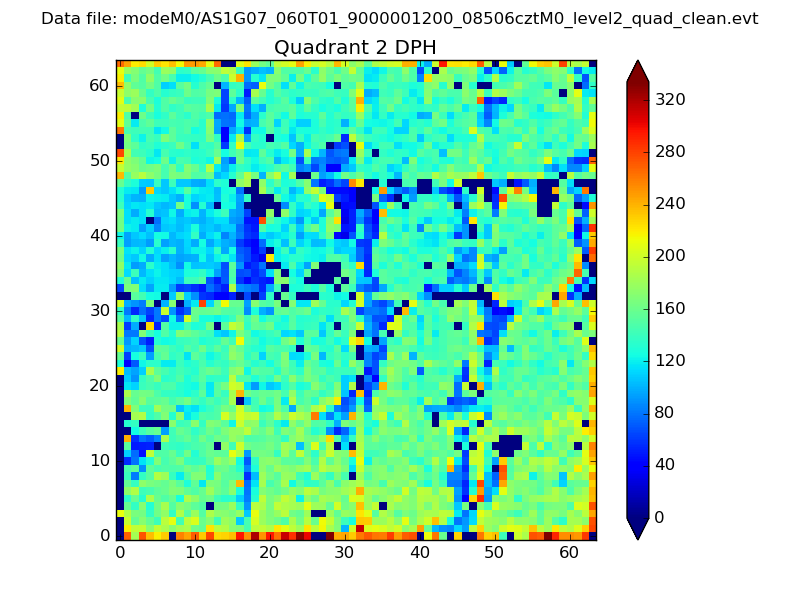
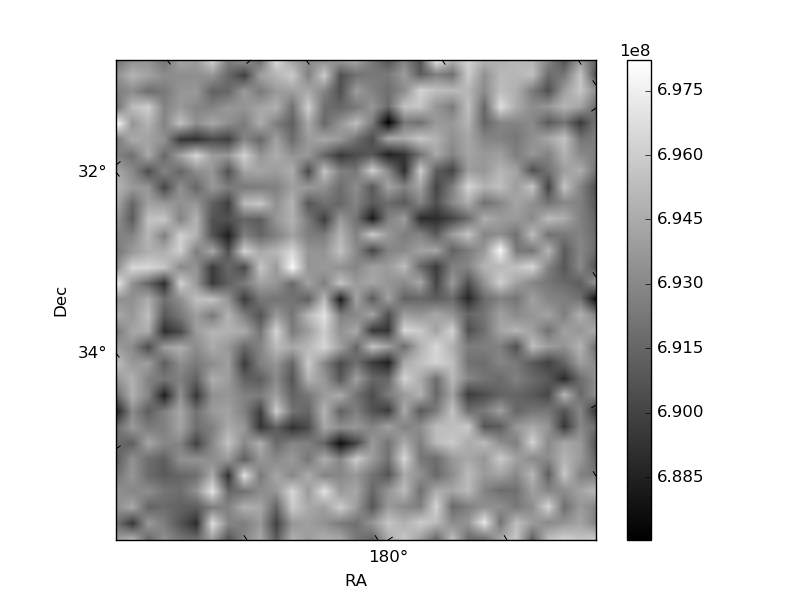
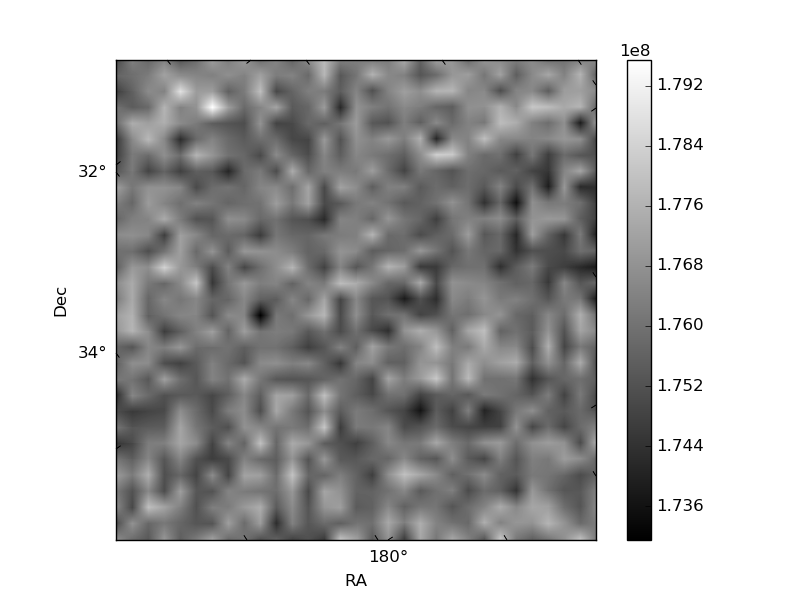
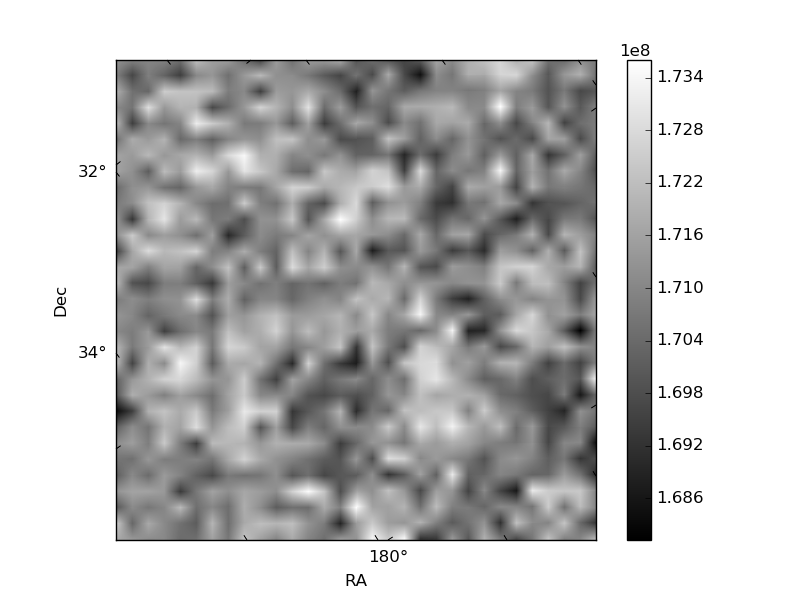
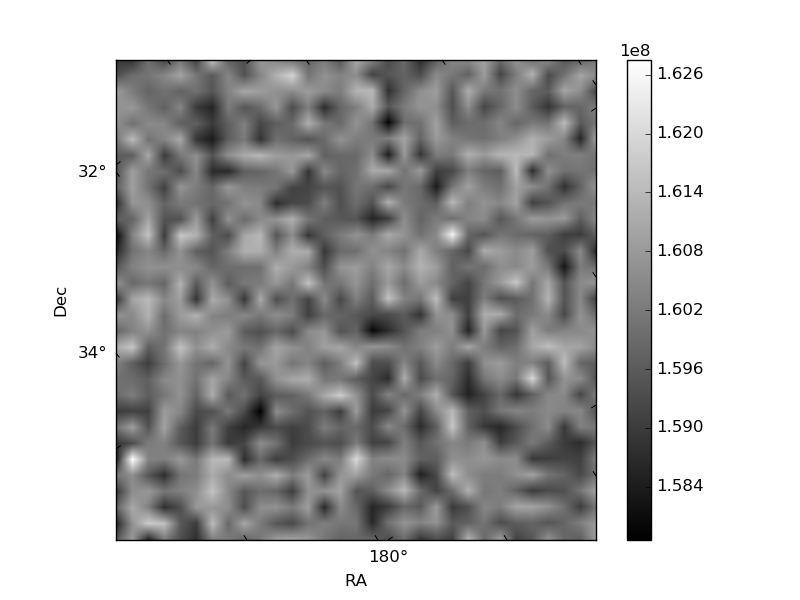
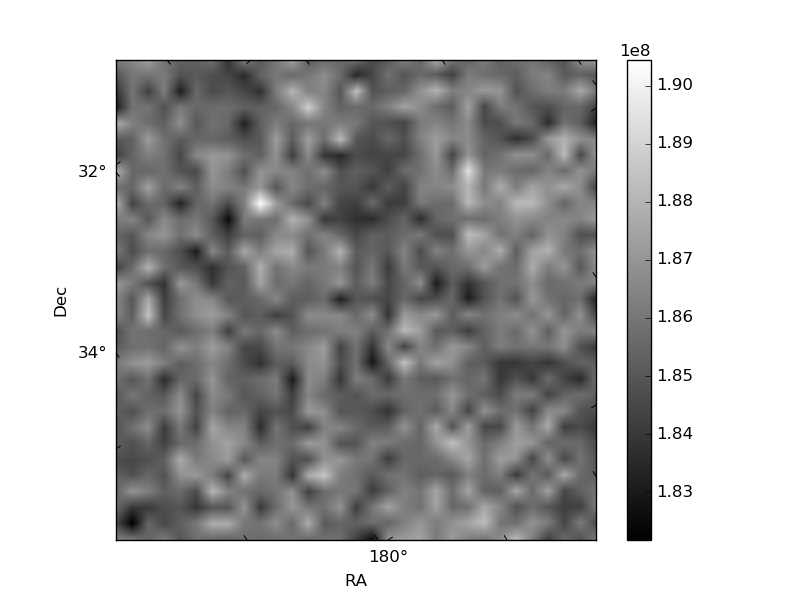
Histogram calculated using DETX and DETY for each event in the final _common_clean file
| Quadrant A | 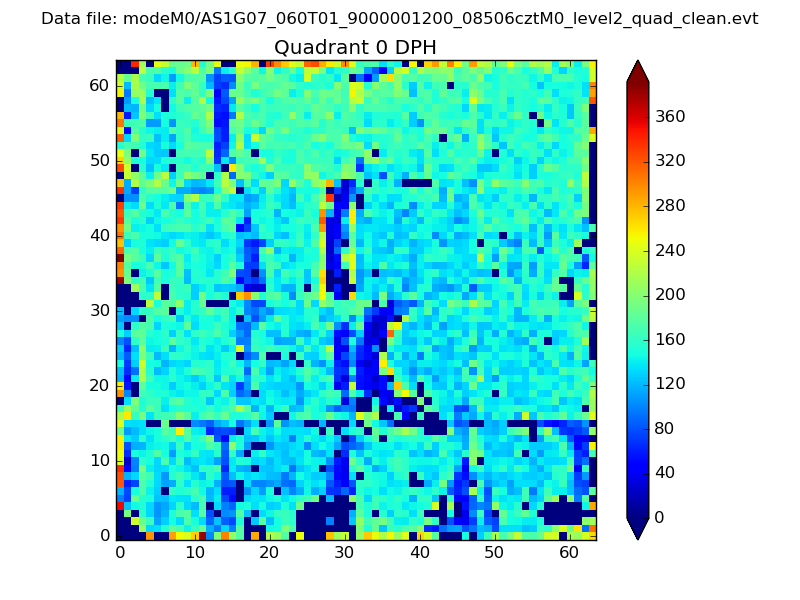 |
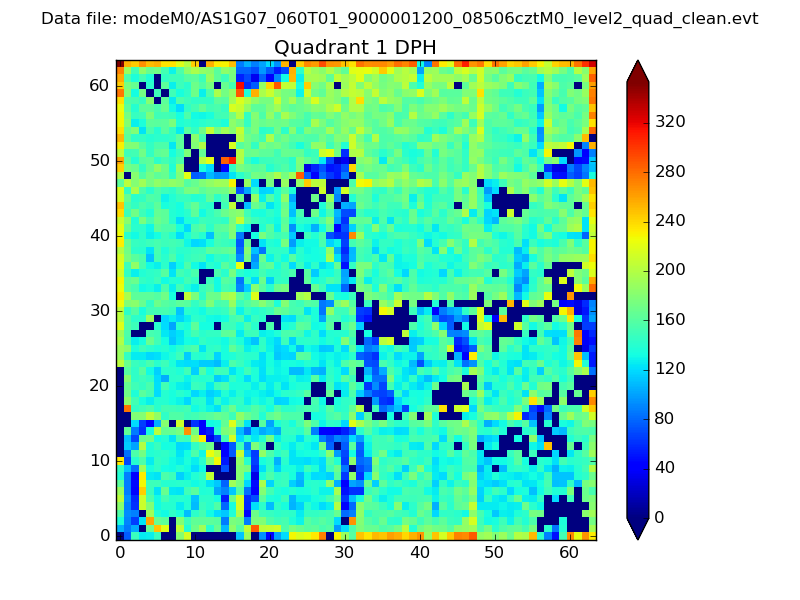 |
Quadrant B |
|---|---|---|---|
| Quadrant D | 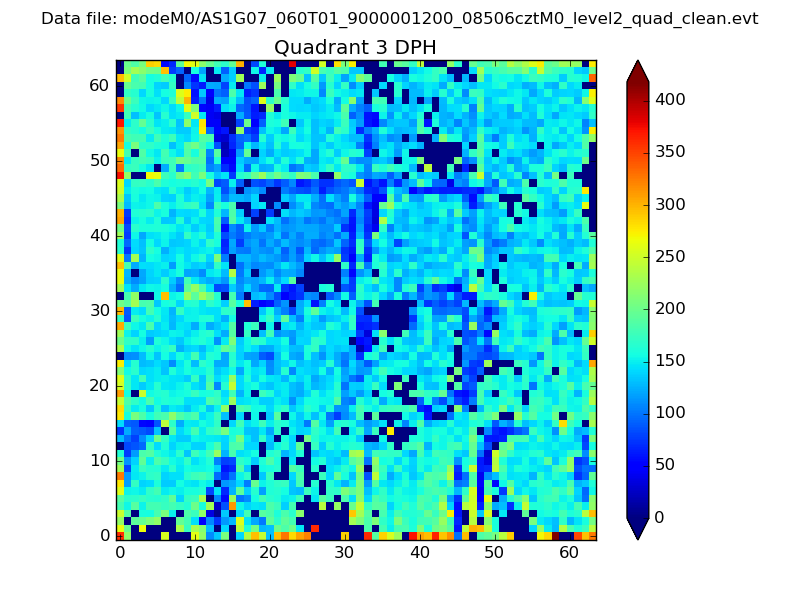 |
 |
Quadrant C |
| Plot type | Count rate plots | Images |
|---|---|---|
| Comparison with Poisson distribution Blue bars denote a histogram of data divided into 1 sec bins. Red curve is a Poisson curve with rate = median count rate of data. |
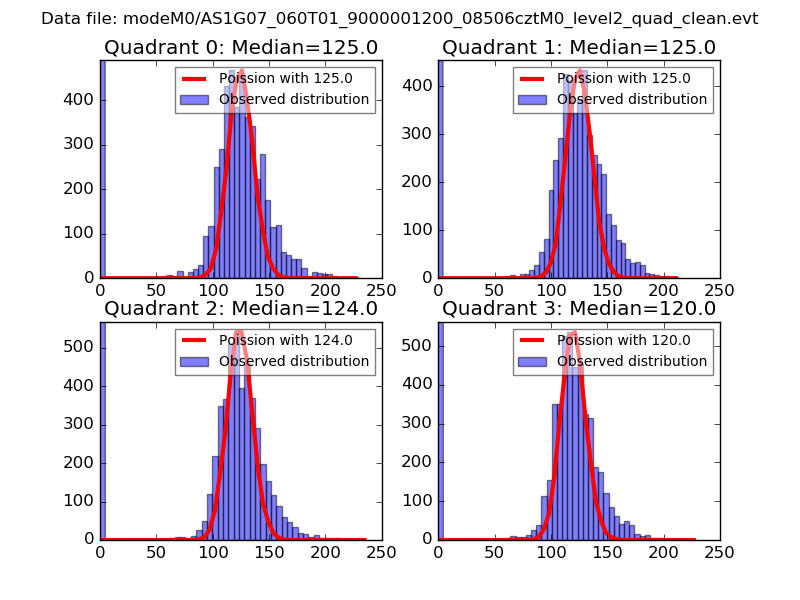 |
 |
| Quadrant-wise count rates Data is divided into 100 sec bins |
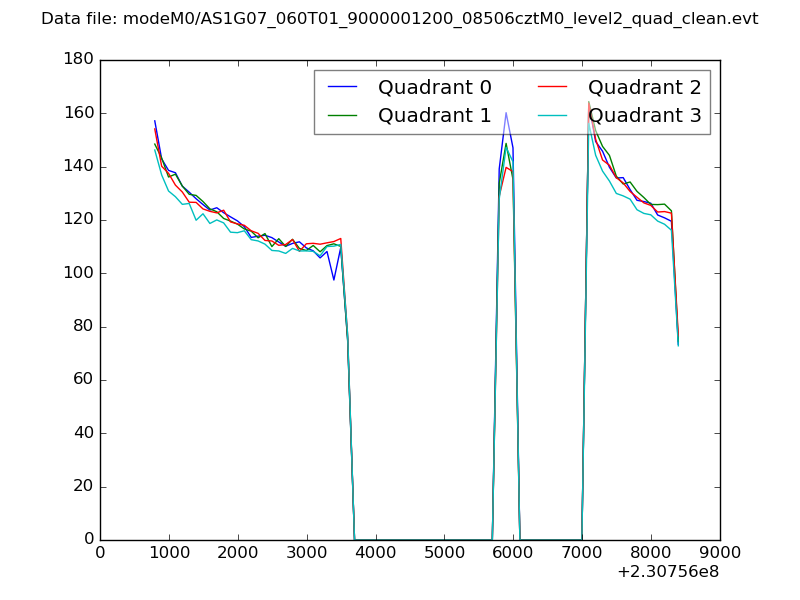 |
|
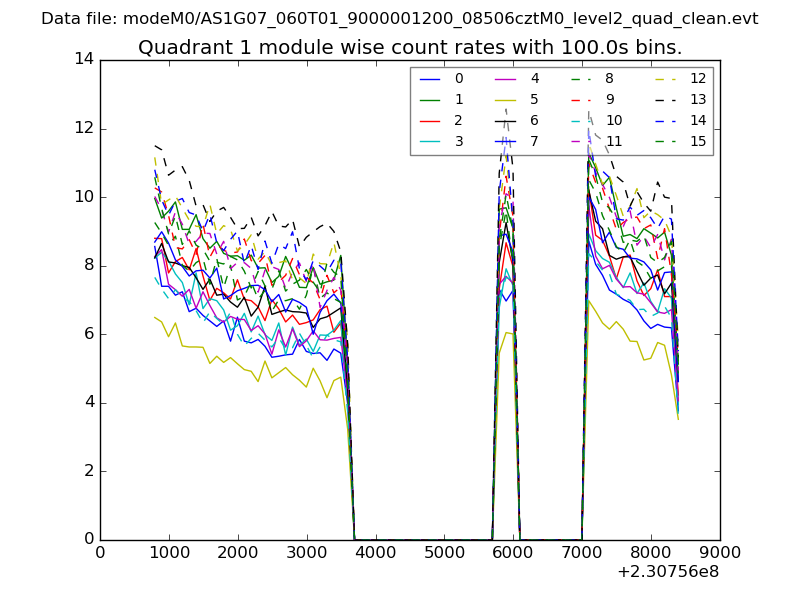
| Module-wise count rates for Quadrant A Data is divided into 100 sec bins |
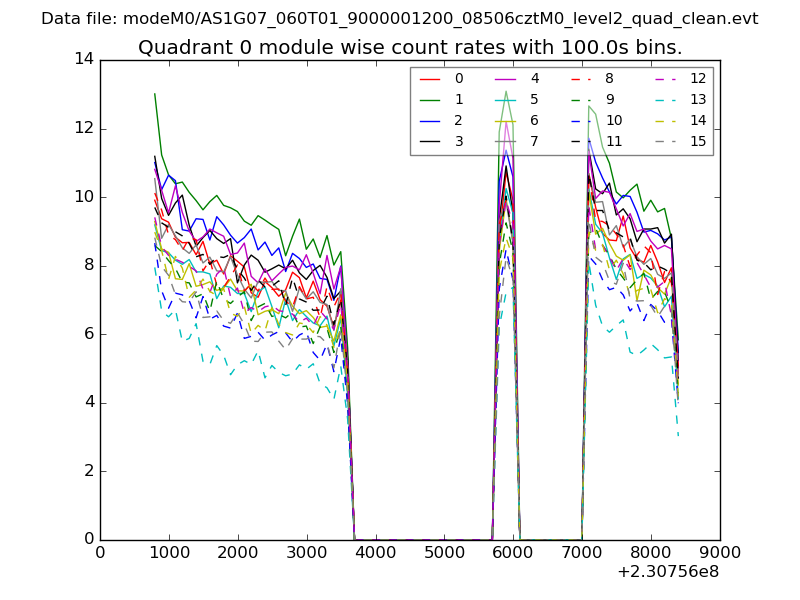 |
 |
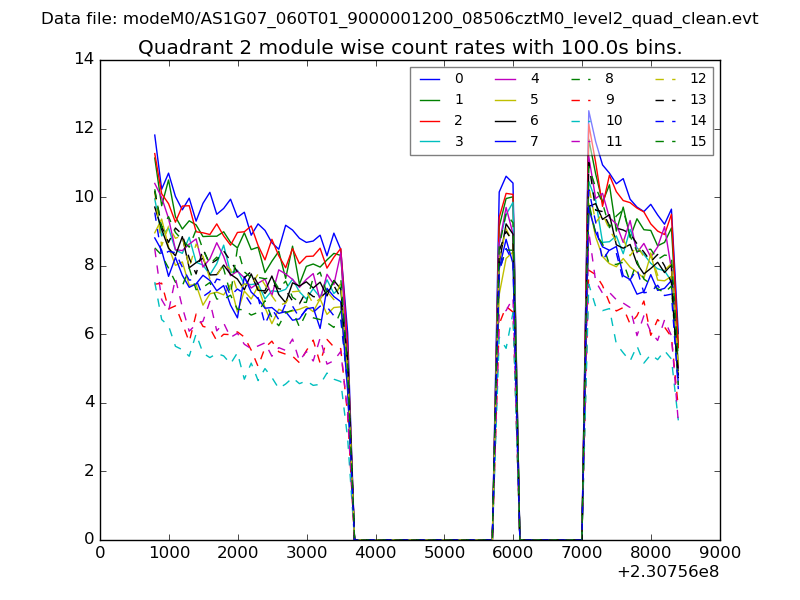
| Module-wise count rates for Quadrant B Data is divided into 100 sec bins |
 |
 |
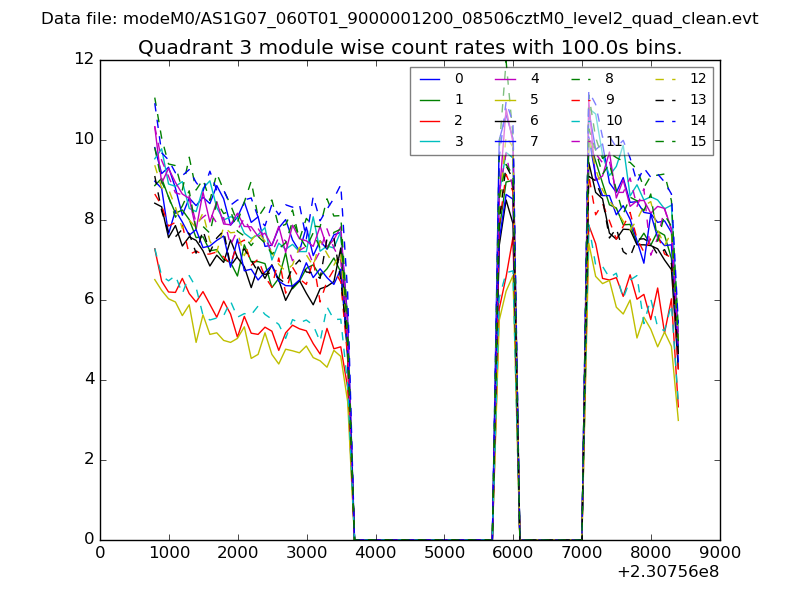
| Module-wise count rates for Quadrant C Data is divided into 100 sec bins |
 |
 |
| Module-wise count rates for Quadrant D Data is divided into 100 sec bins |
 |
 |
| Parameter | Plot |
|---|---|
| CZT HV Monitor | 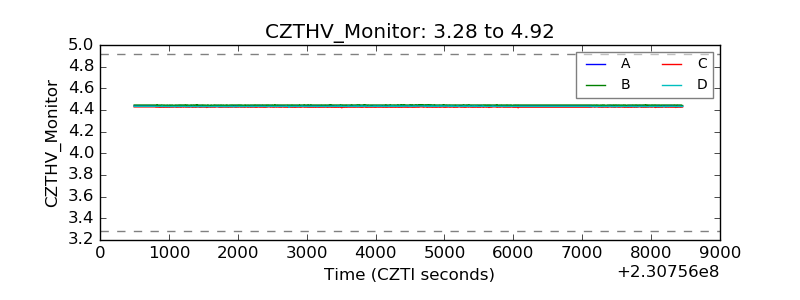 |
| D_VDD | 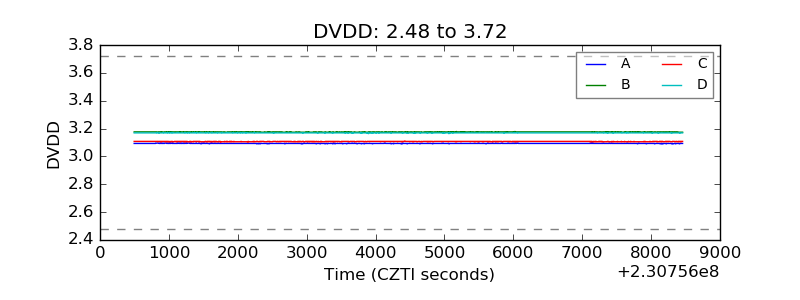 |
| Temperature 1 | 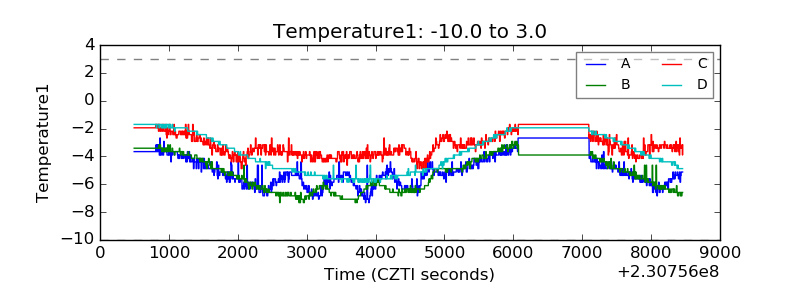 |
| Veto HV Monitor | 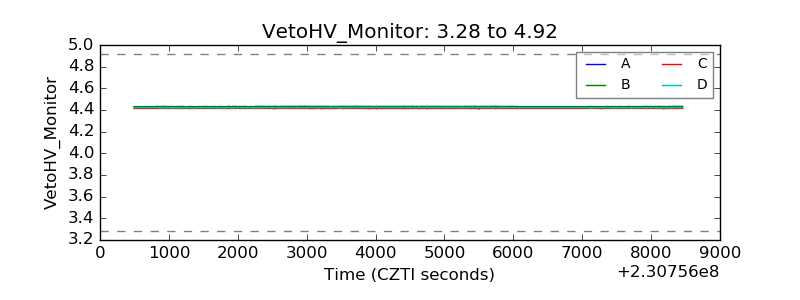 |
| Veto LLD | 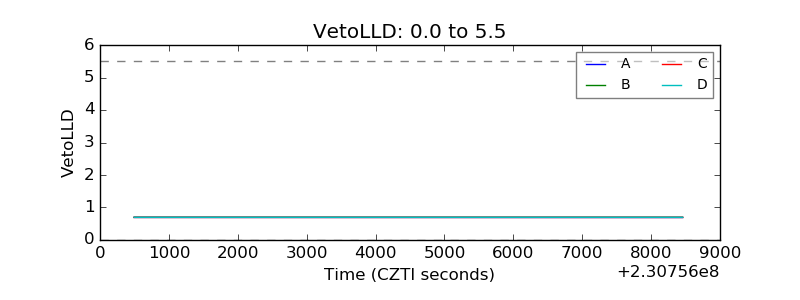 |
| Alpha Counter | 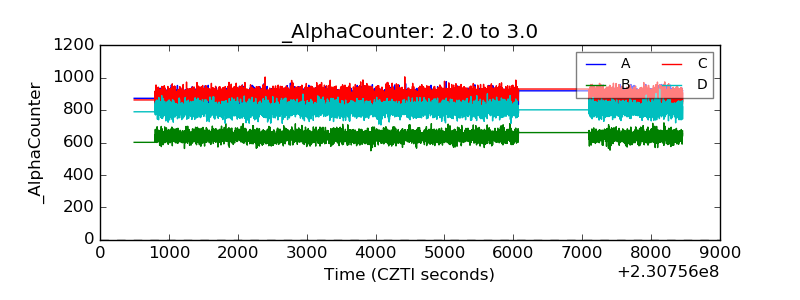 |
| _CPM_Rate | 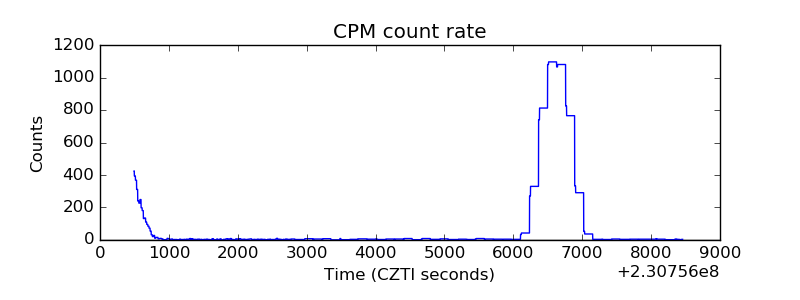 |
| CZT Counter | 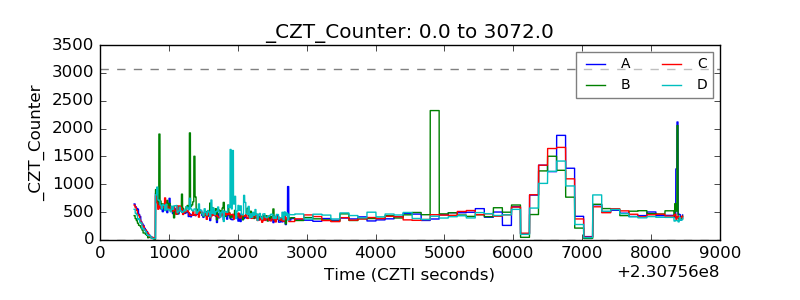 |
| +2.5 Volts monitor |  |
| +5 Volts monitor |  |
| _ROLL_ROT | 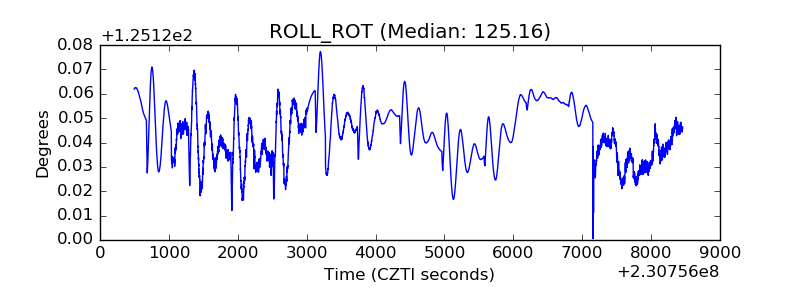 |
| _Roll_DEC | 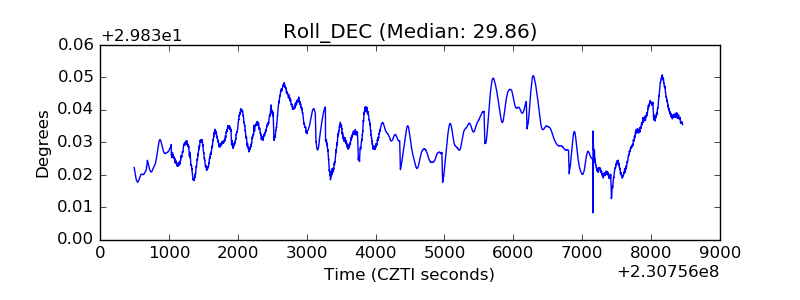 |
| _Roll_RA | 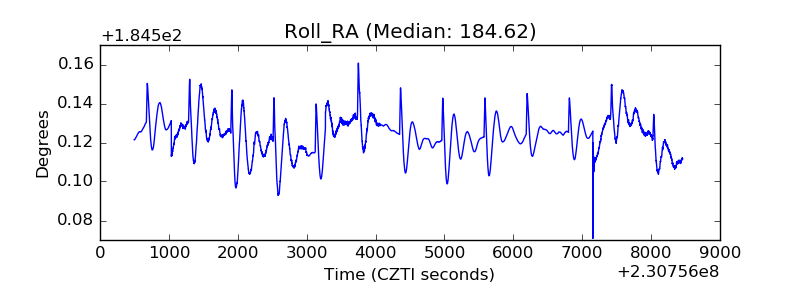 |
| Veto Counter | 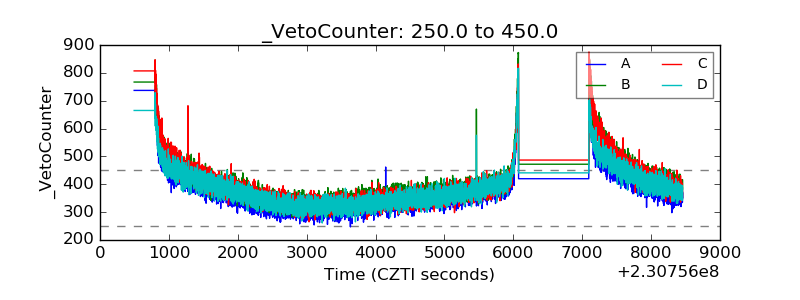 |