| Param | Original file | Final file |
|---|---|---|
| Filename | modeM0/AS1G07_060T01_9000001200_08508cztM0_level2.evt | modeM0/AS1G07_060T01_9000001200_08508cztM0_level2_quad_clean.evt |
| Size (bytes) | 399,271,680 | 86,843,520 |
| Size | 380.8 MB | 82.8 MB |
| Events in quadrant A | 2,955,736 | 548,686 |
| Events in quadrant B | 3,064,673 | 557,738 |
| Events in quadrant C | 2,839,438 | 550,079 |
| Events in quadrant D | 2,799,761 | 530,204 |
| Mode SS | |||
|---|---|---|---|
| Quadrant | BADHDUFLAG | Total packets | Discarded packets |
| A | 0 | 130 | 0 |
| B | 0 | 130 | 0 |
| C | 0 | 130 | 0 |
| D | 0 | 130 | 0 |
| Mode M0 | |||
|---|---|---|---|
| Quadrant | BADHDUFLAG | Total packets | Discarded packets |
| A | 0 | 13210 | 5 |
| B | 0 | 13453 | 2 |
| C | 0 | 12958 | 2 |
| D | 0 | 13146 | 4 |
| Mode M9 | |||
|---|---|---|---|
| Quadrant | BADHDUFLAG | Total packets | Discarded packets |
| A | 0 | 19 | 0 |
| B | 0 | 19 | 0 |
| C | 0 | 19 | 0 |
| D | 0 | 20 | 0 |
| Quadrant | Total seconds | Saturated seconds | Saturation percentage |
|---|---|---|---|
| A | 6347 | 46 | 0.724752% |
| B | 6348 | 40 | 0.630120% |
| C | 6348 | 15 | 0.236295% |
| D | 6347 | 13 | 0.204821% |
Noise dominated data is calculated using 1-second bins in cleaned event files. If a bin has >2000 counts, and if more than 50% of those come from <1% of pixels, then it is considered to be noise-dominated and hence unusable.
| Quadrant | # 1 sec bins | Bins with >0 counts | Bins with >2000 counts | High rate bins dominated by noise | Noise dominated (total time) | Noise dominated (detector-on time) | Marked lightcurve |
|---|---|---|---|---|---|---|---|
| A | 7503 | 6349 | 19 | 19 | 0.25% | 0.30% | 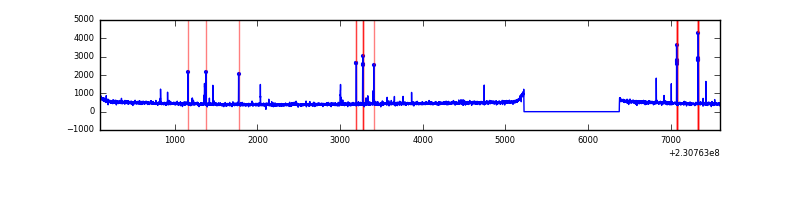 |
| B | 7503 | 6349 | 8 | 8 | 0.11% | 0.13% | 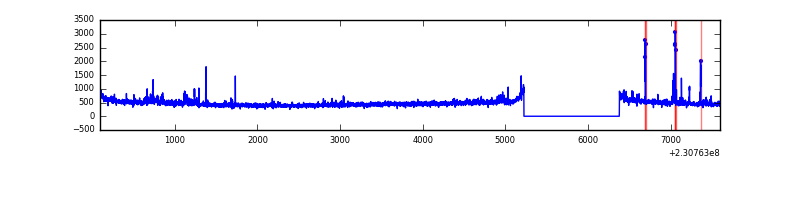 |
| C | 7503 | 6349 | 0 | 0 | 0.00% | 0.00% | 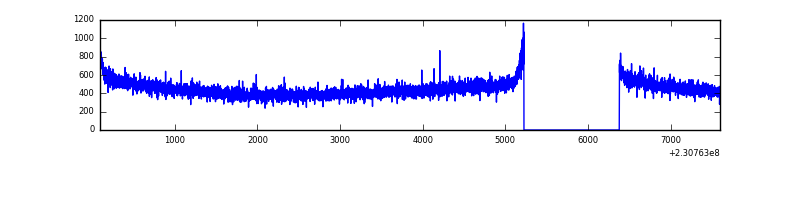 |
| D | 7503 | 6349 | 2 | 2 | 0.03% | 0.03% |  |
Top three noisy pixels from each quadrant. If the there are fewer than three noisy pixels in the level2.evt file, extra rows are filled as -1
| Pixel properties | Quadrant properties | ||||||
|---|---|---|---|---|---|---|---|
| Quadrant | DetID | PixID | Counts | Sigma | Mean | Median | Sigma |
| A | 5 | 16 | 100494 | 662.42 | 740 | 722 | 150.6 |
| A | 13 | 14 | 7546 | 45.31 | 740 | 722 | 150.6 |
| A | 0 | 226 | 6750 | 40.02 | 740 | 722 | 150.6 |
| B | 5 | 255 | 55109 | 384.0 | 747 | 729 | 141.6 |
| B | 0 | 214 | 39959 | 277.02 | 747 | 729 | 141.6 |
| B | 10 | 252 | 29130 | 200.55 | 747 | 729 | 141.6 |
| C | 13 | 61 | 5401 | 27.58 | 727 | 728 | 169.5 |
| C | 8 | 222 | 3253 | 14.9 | 727 | 728 | 169.5 |
| C | 3 | 202 | 1809 | 6.38 | 727 | 728 | 169.5 |
| D | 13 | 105 | 37962 | 208.53 | 719 | 699 | 178.7 |
| D | 2 | 234 | 20956 | 113.36 | 719 | 699 | 178.7 |
| D | 9 | 64 | 20686 | 111.85 | 719 | 699 | 178.7 |
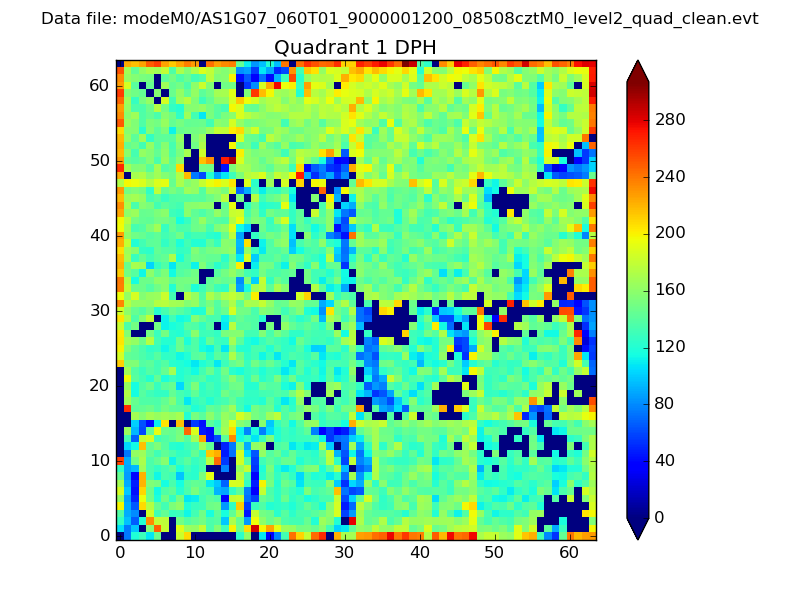
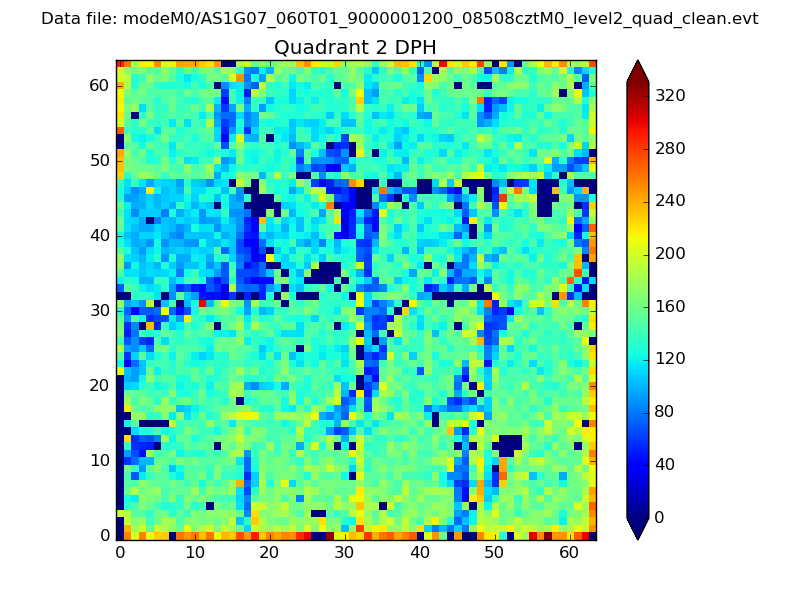
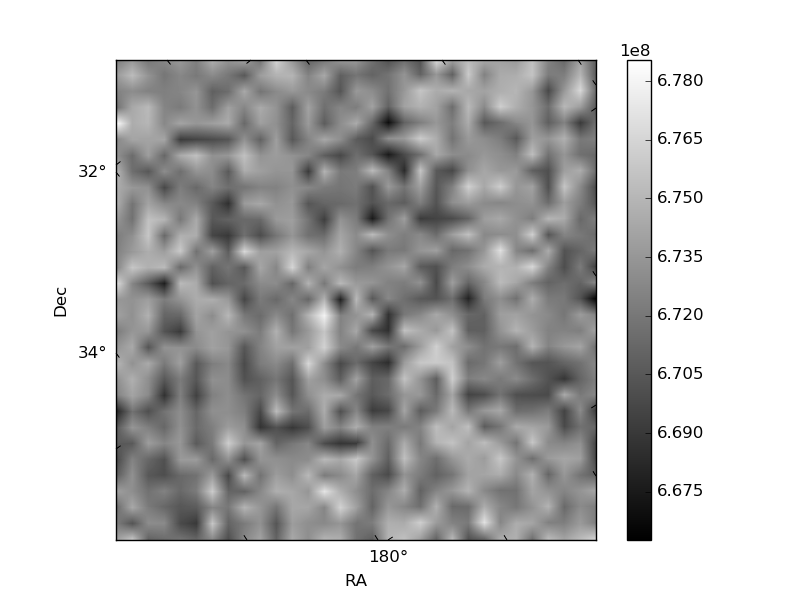
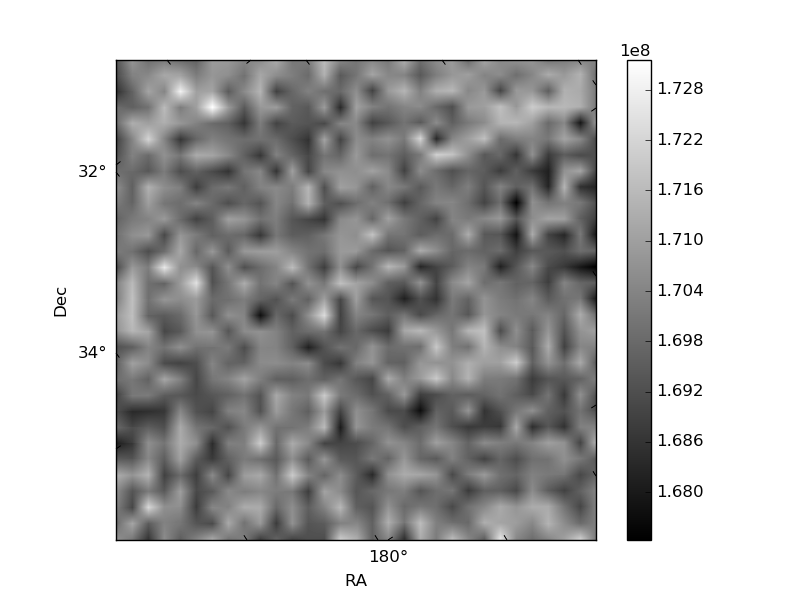
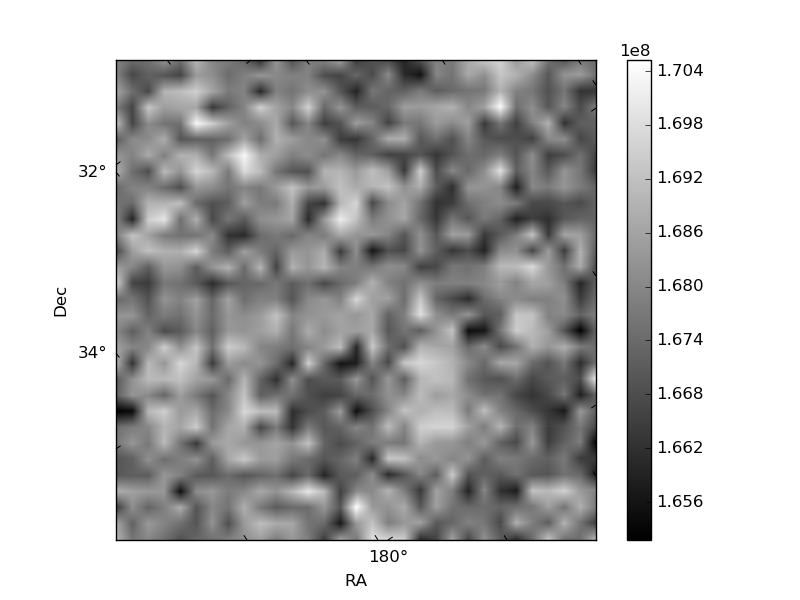
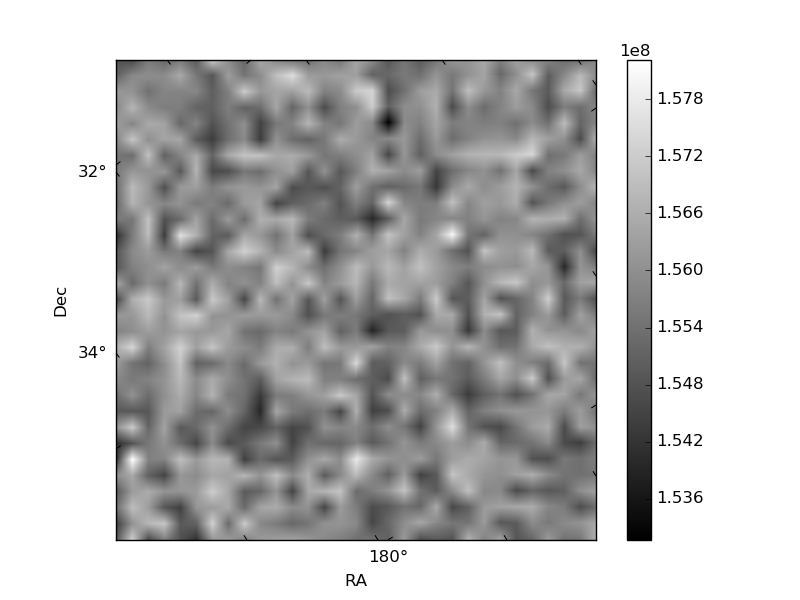
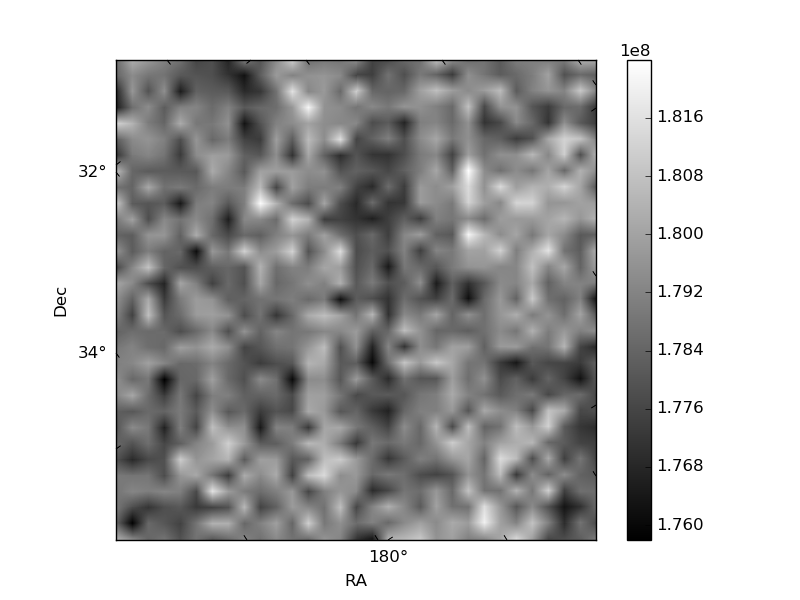
Histogram calculated using DETX and DETY for each event in the final _common_clean file
| Quadrant A | 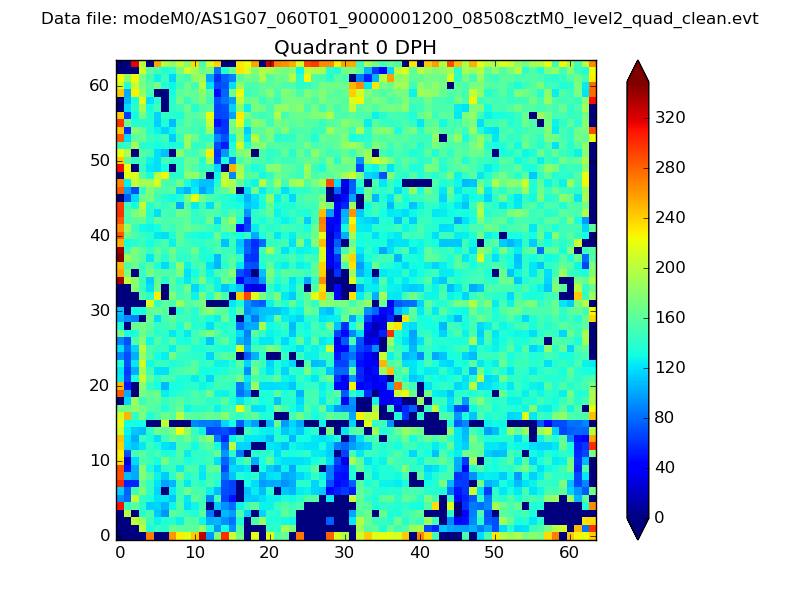 |
 |
Quadrant B |
|---|---|---|---|
| Quadrant D | 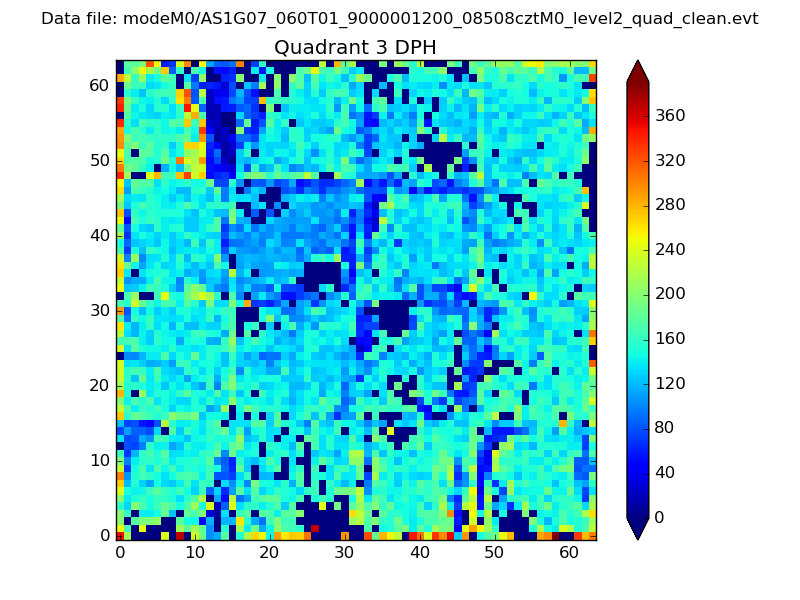 |
 |
Quadrant C |
| Plot type | Count rate plots | Images |
|---|---|---|
| Comparison with Poisson distribution Blue bars denote a histogram of data divided into 1 sec bins. Red curve is a Poisson curve with rate = median count rate of data. |
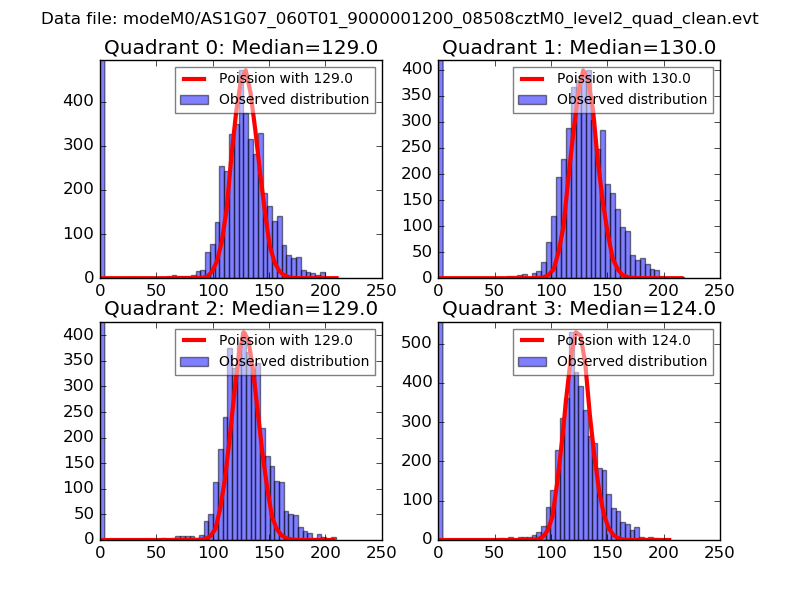 |
 |
| Quadrant-wise count rates Data is divided into 100 sec bins |
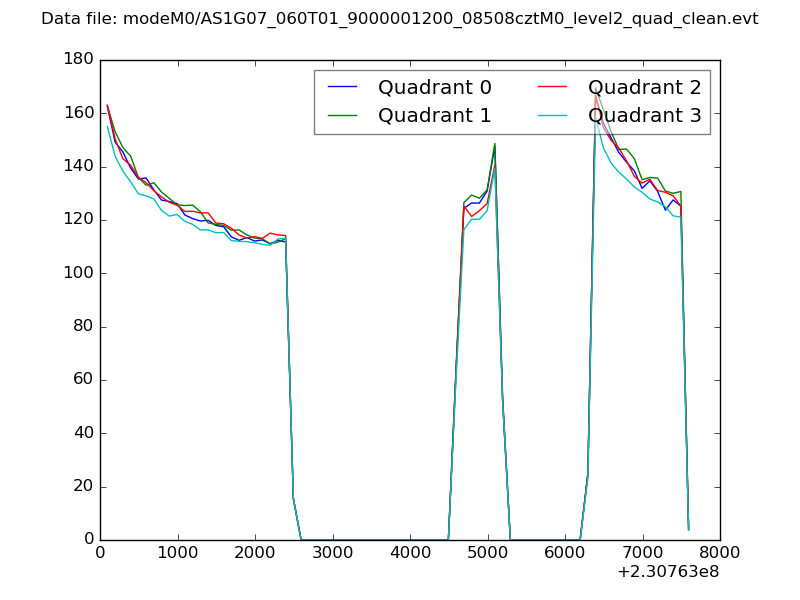 |
|
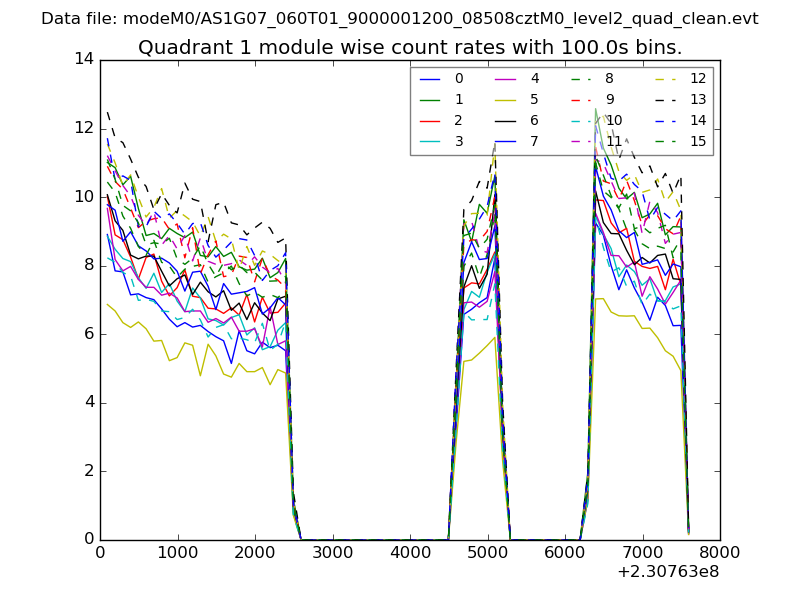
| Module-wise count rates for Quadrant A Data is divided into 100 sec bins |
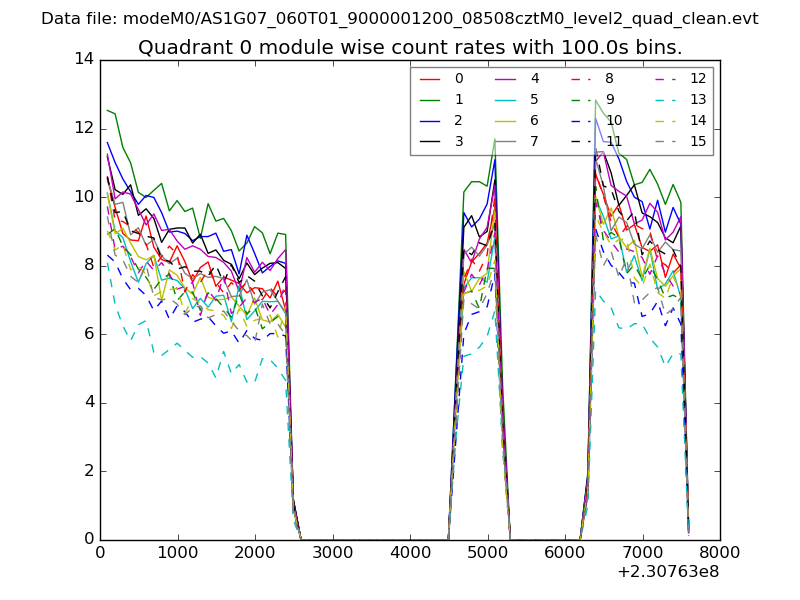 |
 |
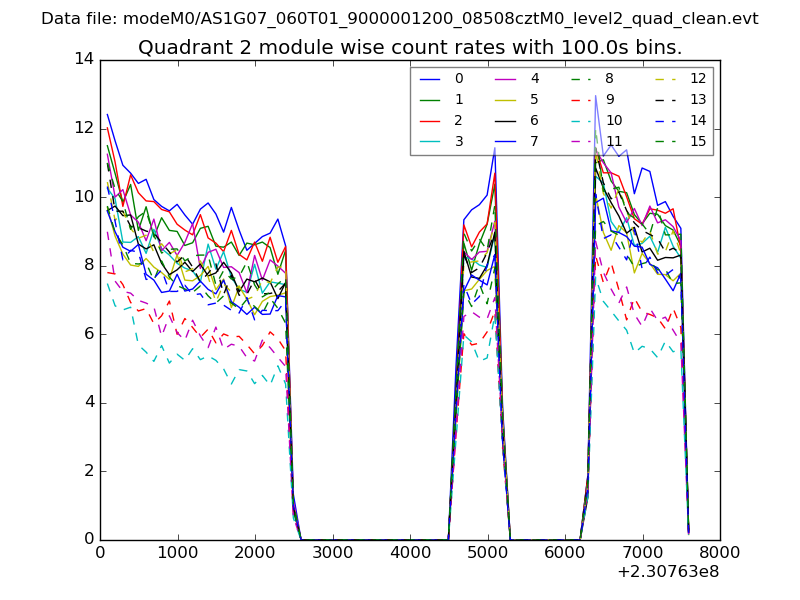
| Module-wise count rates for Quadrant B Data is divided into 100 sec bins |
 |
 |
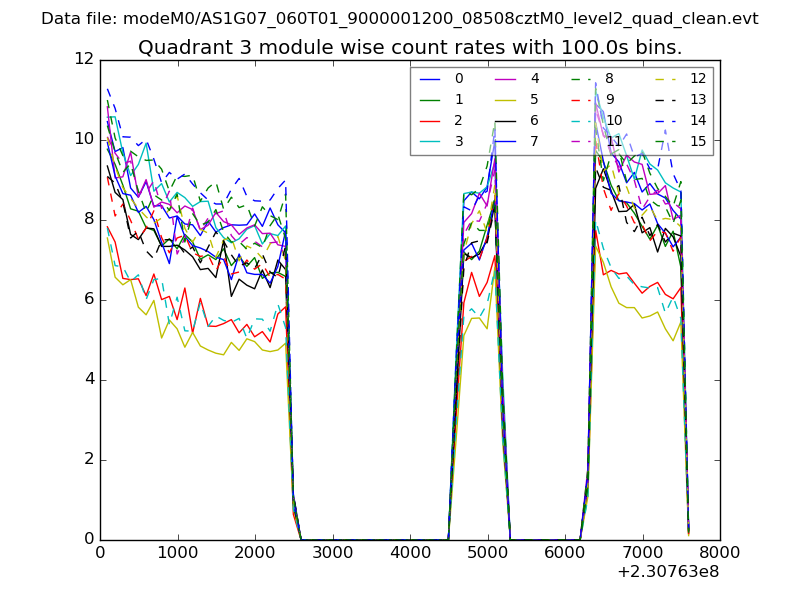
| Module-wise count rates for Quadrant C Data is divided into 100 sec bins |
 |
 |
| Module-wise count rates for Quadrant D Data is divided into 100 sec bins |
 |
 |
| Parameter | Plot |
|---|---|
| CZT HV Monitor | 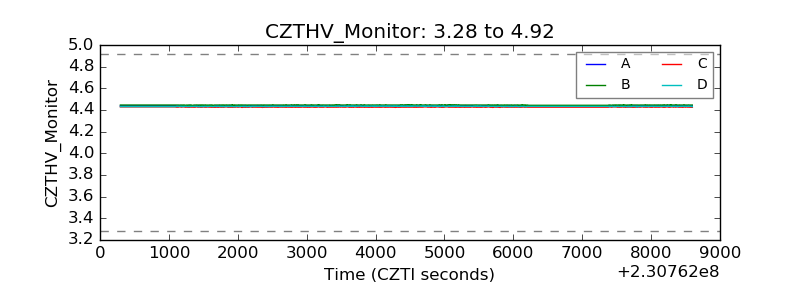 |
| D_VDD |  |
| Temperature 1 | 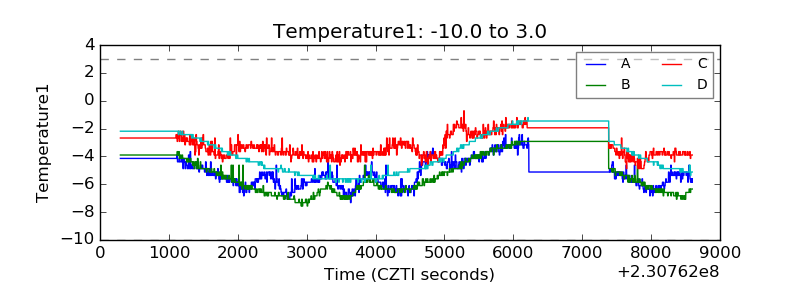 |
| Veto HV Monitor | 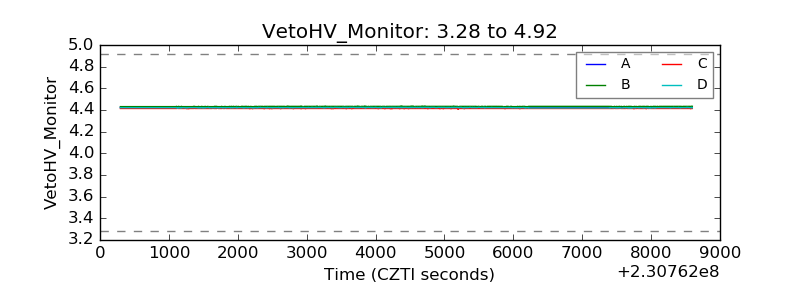 |
| Veto LLD | 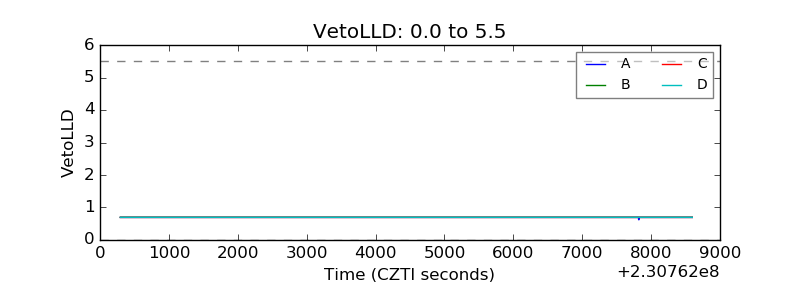 |
| Alpha Counter | 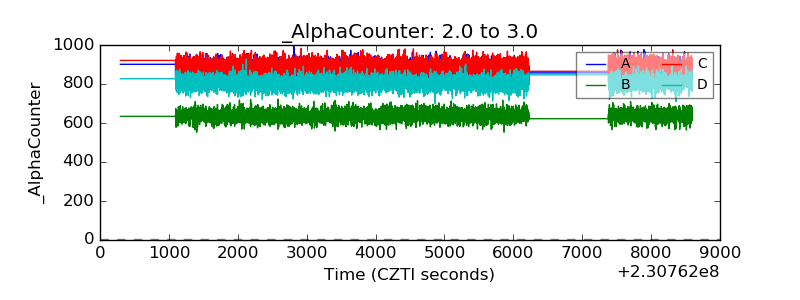 |
| _CPM_Rate | 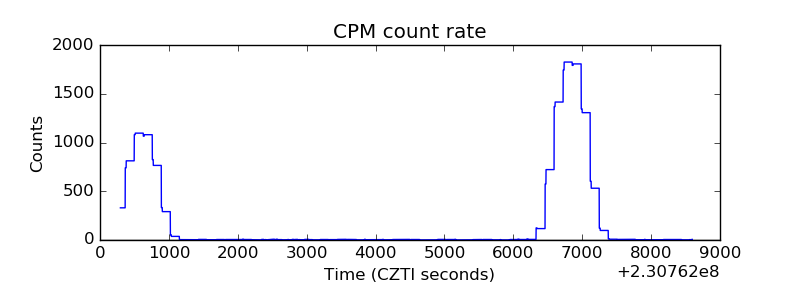 |
| CZT Counter | 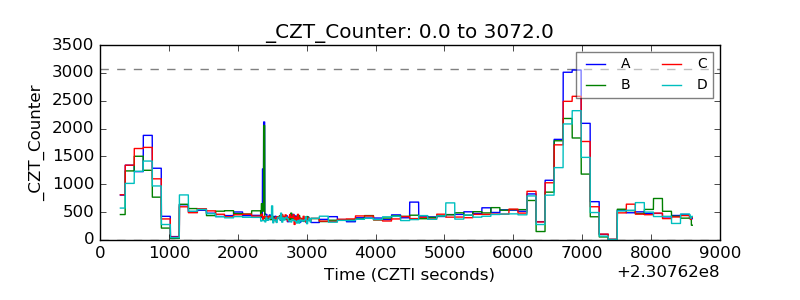 |
| +2.5 Volts monitor |  |
| +5 Volts monitor |  |
| _ROLL_ROT | 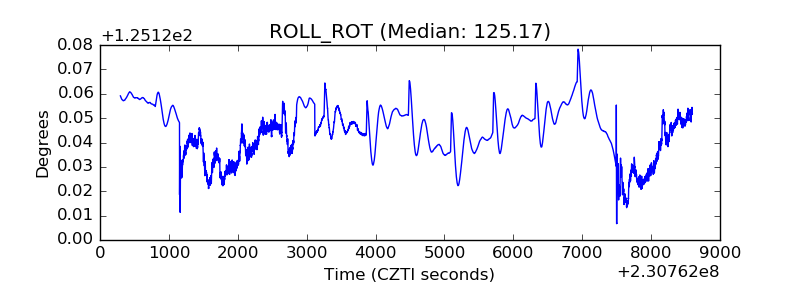 |
| _Roll_DEC | 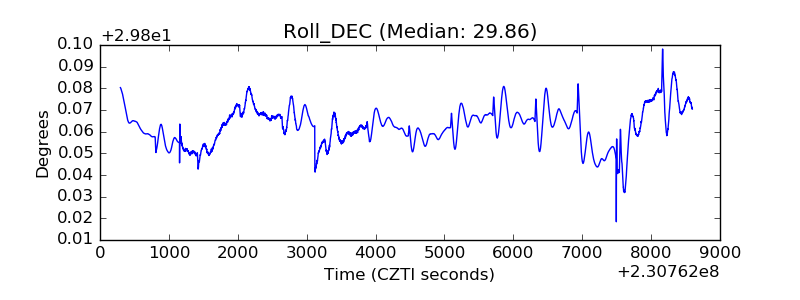 |
| _Roll_RA |  |
| Veto Counter | 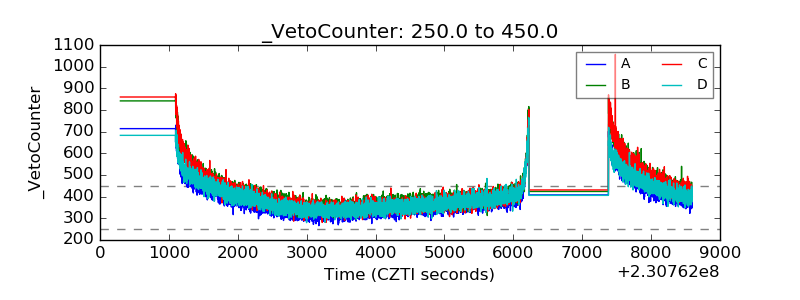 |