| Param | Original file | Final file |
|---|---|---|
| Filename | modeM0/AS1G07_060T01_9000001200_08509cztM0_level2.evt | modeM0/AS1G07_060T01_9000001200_08509cztM0_level2_quad_clean.evt |
| Size (bytes) | 419,158,080 | 89,153,280 |
| Size | 399.7 MB | 85.0 MB |
| Events in quadrant A | 3,076,841 | 567,815 |
| Events in quadrant B | 3,253,984 | 580,416 |
| Events in quadrant C | 2,890,679 | 567,375 |
| Events in quadrant D | 3,042,138 | 542,552 |
| Mode SS | |||
|---|---|---|---|
| Quadrant | BADHDUFLAG | Total packets | Discarded packets |
| A | 0 | 132 | 0 |
| B | 0 | 132 | 0 |
| C | 0 | 132 | 0 |
| D | 0 | 132 | 0 |
| Mode M0 | |||
|---|---|---|---|
| Quadrant | BADHDUFLAG | Total packets | Discarded packets |
| A | 0 | 13399 | 5 |
| B | 0 | 13841 | 5 |
| C | 0 | 12990 | 4 |
| D | 0 | 13673 | 2 |
| Mode M9 | |||
|---|---|---|---|
| Quadrant | BADHDUFLAG | Total packets | Discarded packets |
| A | 0 | 23 | 0 |
| B | 0 | 23 | 0 |
| C | 0 | 23 | 0 |
| D | 0 | 23 | 0 |
| Quadrant | Total seconds | Saturated seconds | Saturation percentage |
|---|---|---|---|
| A | 6324 | 66 | 1.043643% |
| B | 6324 | 69 | 1.091082% |
| C | 6324 | 23 | 0.363694% |
| D | 6325 | 20 | 0.316206% |
Noise dominated data is calculated using 1-second bins in cleaned event files. If a bin has >2000 counts, and if more than 50% of those come from <1% of pixels, then it is considered to be noise-dominated and hence unusable.
| Quadrant | # 1 sec bins | Bins with >0 counts | Bins with >2000 counts | High rate bins dominated by noise | Noise dominated (total time) | Noise dominated (detector-on time) | Marked lightcurve |
|---|---|---|---|---|---|---|---|
| A | 8715 | 6327 | 24 | 24 | 0.28% | 0.38% | 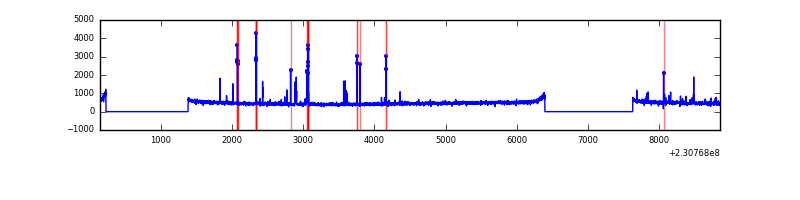 |
| B | 8715 | 6327 | 21 | 21 | 0.24% | 0.33% | 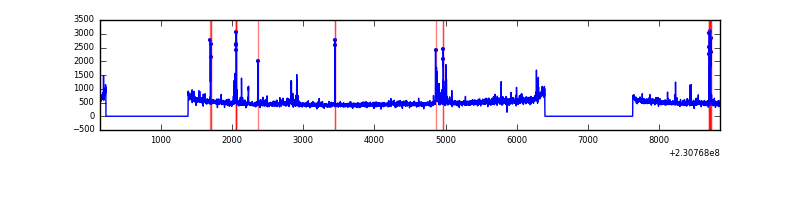 |
| C | 8715 | 6327 | 0 | 0 | 0.00% | 0.00% |  |
| D | 8715 | 6327 | 1 | 1 | 0.01% | 0.02% | 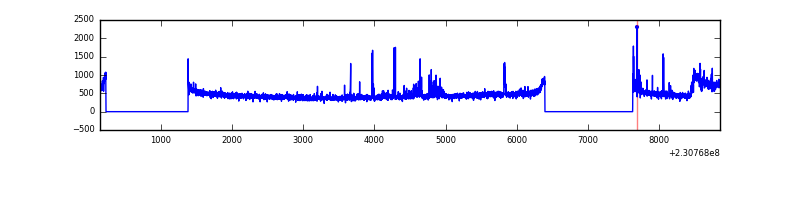 |
Top three noisy pixels from each quadrant. If the there are fewer than three noisy pixels in the level2.evt file, extra rows are filled as -1
| Pixel properties | Quadrant properties | ||||||
|---|---|---|---|---|---|---|---|
| Quadrant | DetID | PixID | Counts | Sigma | Mean | Median | Sigma |
| A | 5 | 16 | 155833 | 1000.63 | 757 | 741 | 155.0 |
| A | 0 | 226 | 6966 | 40.16 | 757 | 741 | 155.0 |
| A | 12 | 194 | 6511 | 37.23 | 757 | 741 | 155.0 |
| B | 15 | 255 | 85911 | 589.64 | 765 | 749 | 144.4 |
| B | 0 | 214 | 73628 | 504.59 | 765 | 749 | 144.4 |
| B | 10 | 252 | 43099 | 293.22 | 765 | 749 | 144.4 |
| C | 13 | 61 | 5499 | 27.54 | 740 | 744 | 172.7 |
| C | 8 | 222 | 2973 | 12.91 | 740 | 744 | 172.7 |
| C | 12 | 4 | 1790 | 6.06 | 740 | 744 | 172.7 |
| D | 13 | 105 | 129334 | 727.95 | 726 | 709 | 176.7 |
| D | 2 | 136 | 74694 | 418.72 | 726 | 709 | 176.7 |
| D | 13 | 169 | 29064 | 160.47 | 726 | 709 | 176.7 |
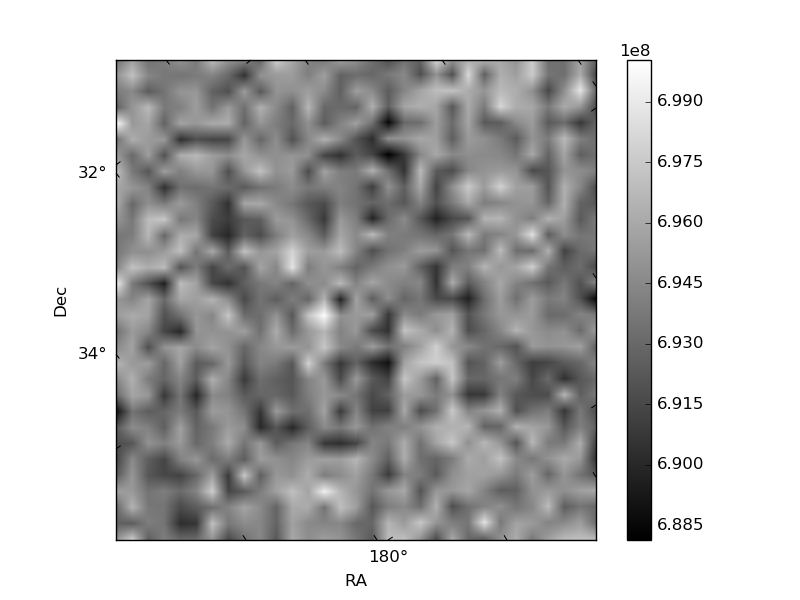
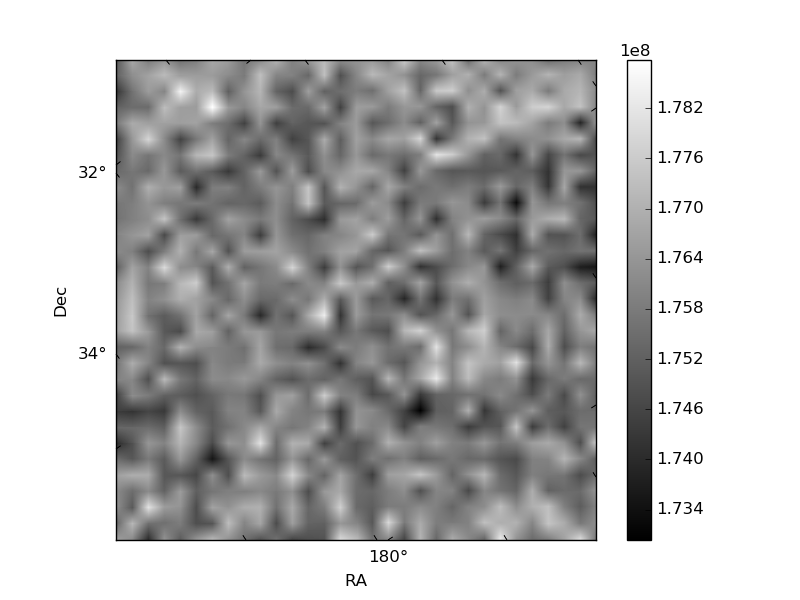
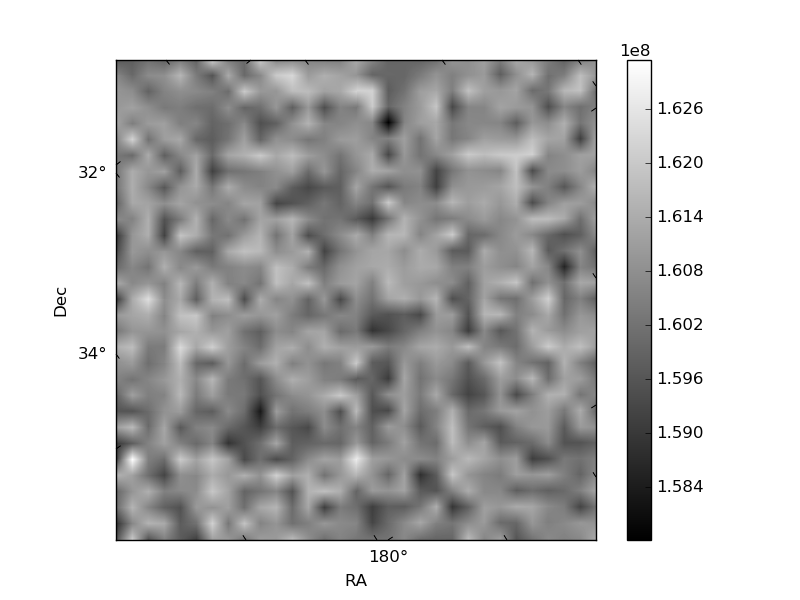
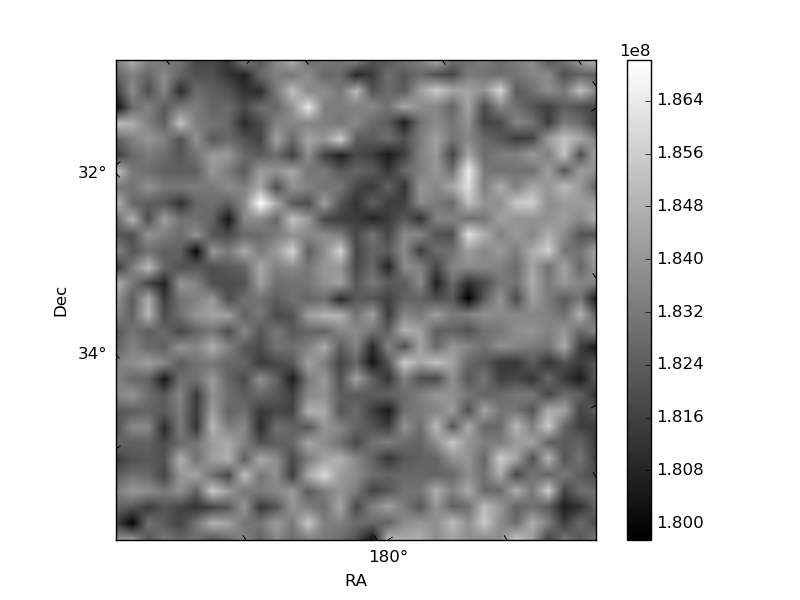
Histogram calculated using DETX and DETY for each event in the final _common_clean file
| Quadrant A | 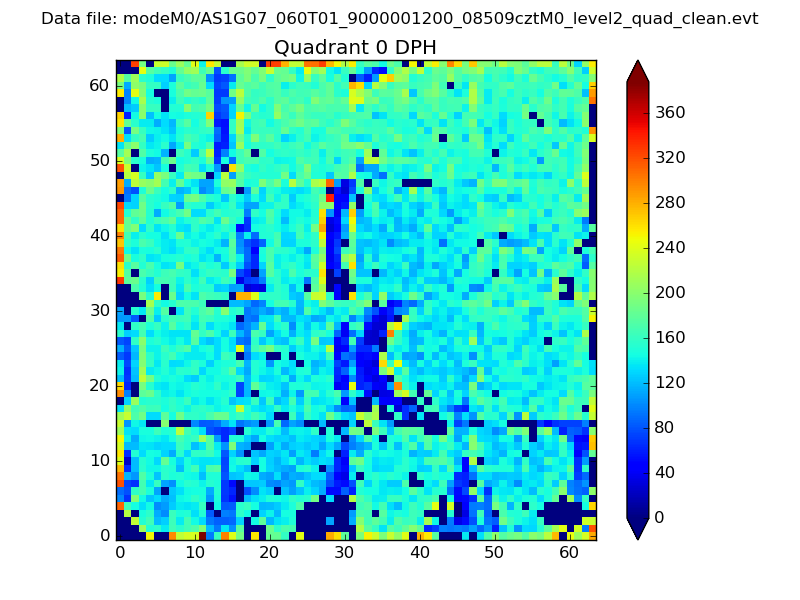 |
 |
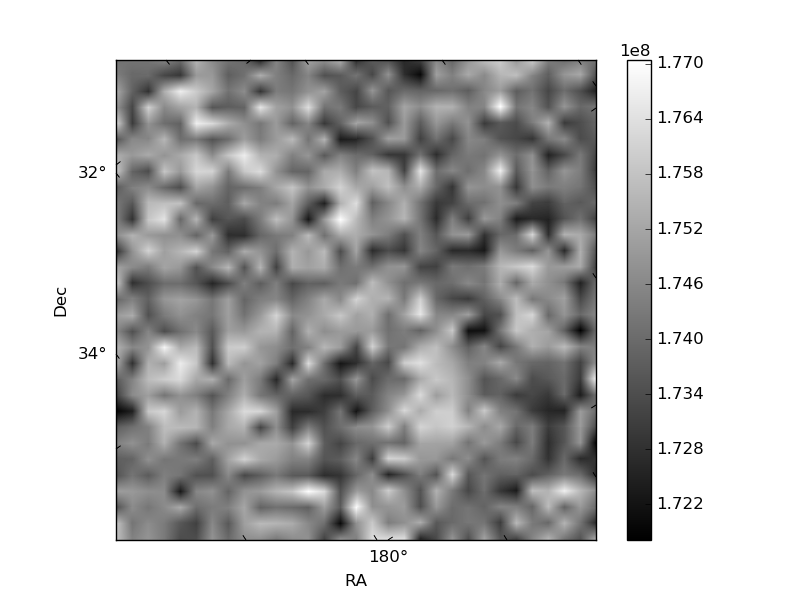
Quadrant B |
|---|---|---|---|
| Quadrant D |  |
 |
Quadrant C |
| Plot type | Count rate plots | Images |
|---|---|---|
| Comparison with Poisson distribution Blue bars denote a histogram of data divided into 1 sec bins. Red curve is a Poisson curve with rate = median count rate of data. |
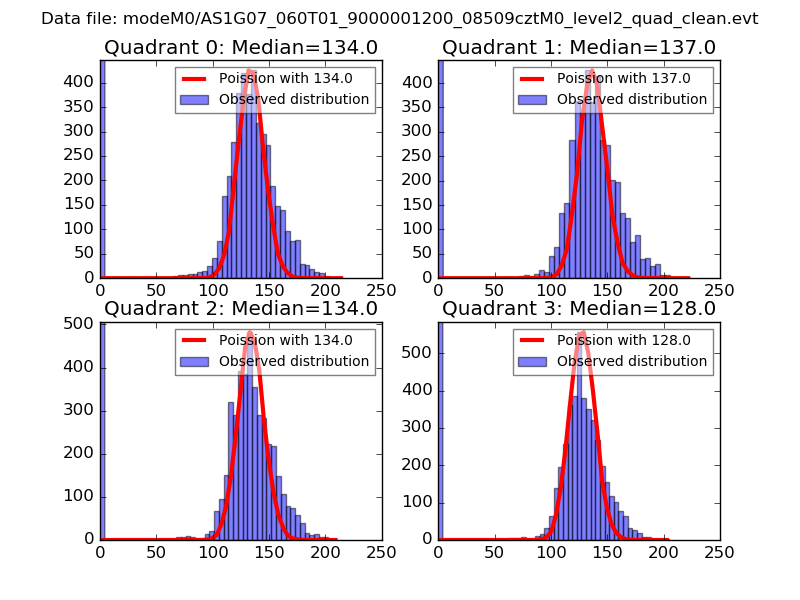 |
 |
| Quadrant-wise count rates Data is divided into 100 sec bins |
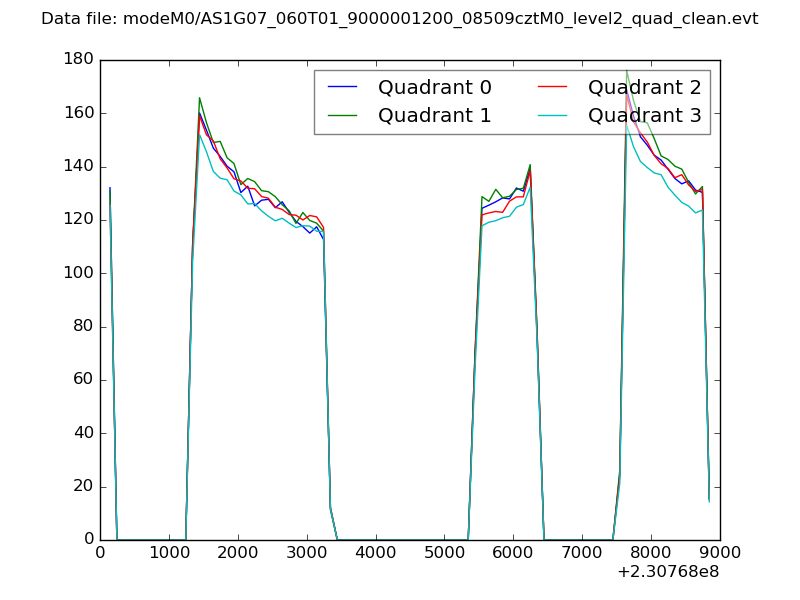 |
|
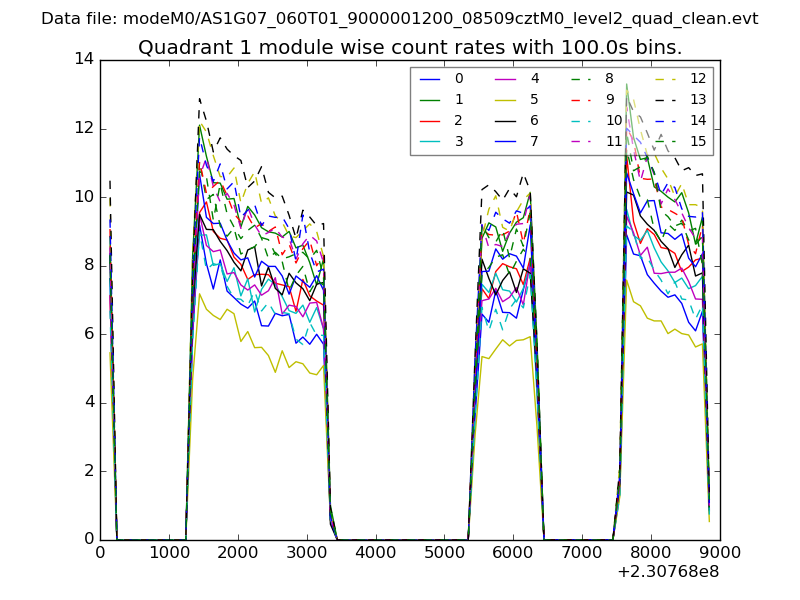
| Module-wise count rates for Quadrant A Data is divided into 100 sec bins |
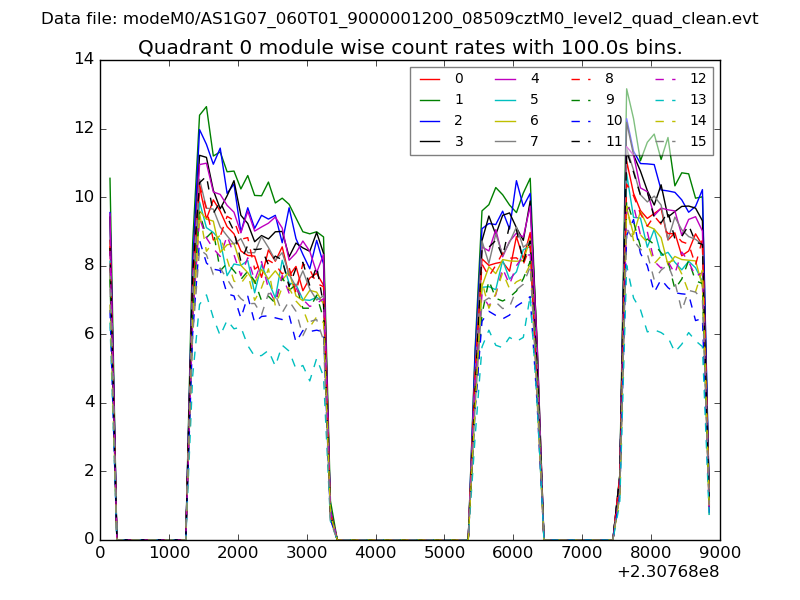 |
 |
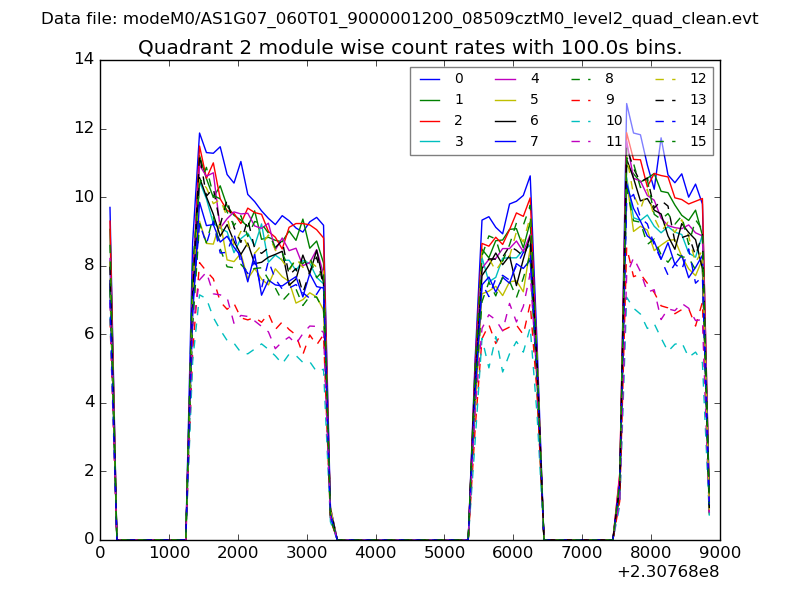
| Module-wise count rates for Quadrant B Data is divided into 100 sec bins |
 |
 |
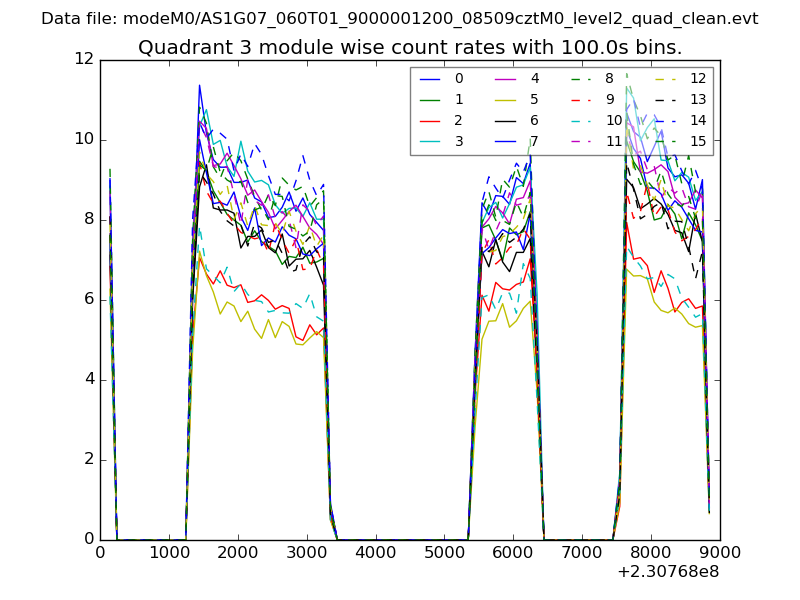
| Module-wise count rates for Quadrant C Data is divided into 100 sec bins |
 |
 |
| Module-wise count rates for Quadrant D Data is divided into 100 sec bins |
 |
 |
| Parameter | Plot |
|---|---|
| CZT HV Monitor |  |
| D_VDD | 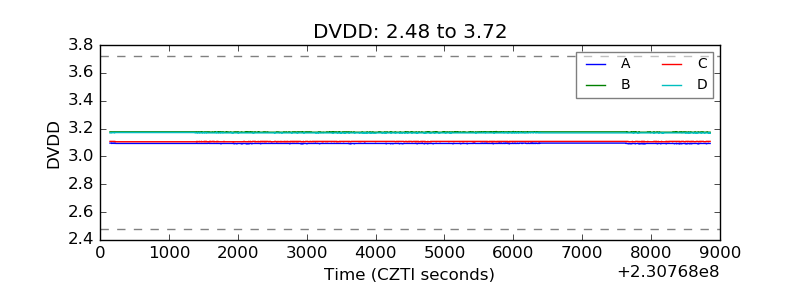 |
| Temperature 1 | 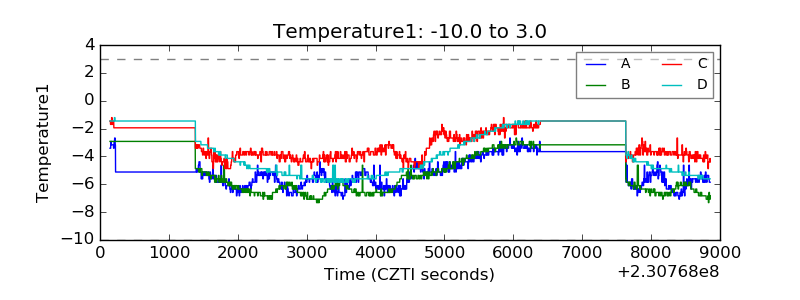 |
| Veto HV Monitor | 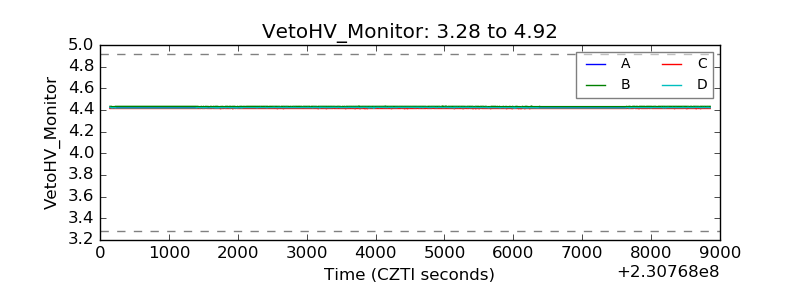 |
| Veto LLD | 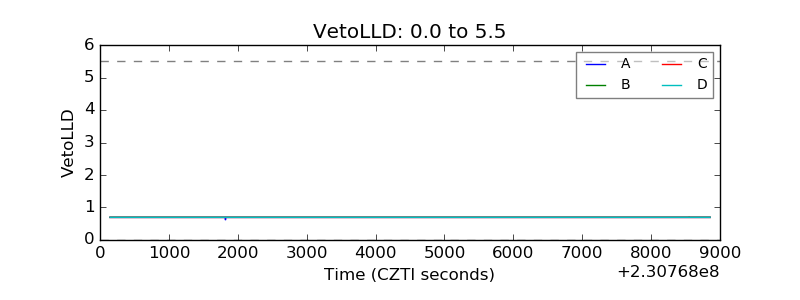 |
| Alpha Counter | 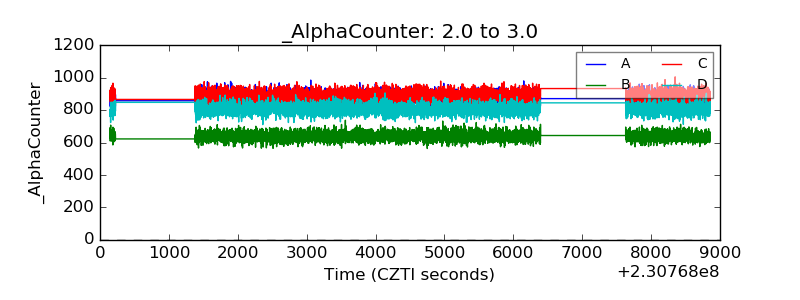 |
| _CPM_Rate | 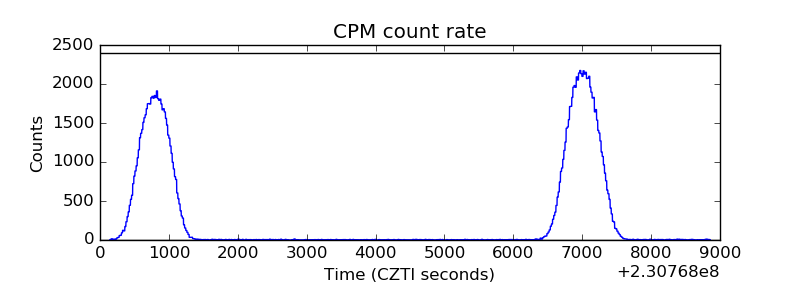 |
| CZT Counter |  |
| +2.5 Volts monitor |  |
| +5 Volts monitor |  |
| _ROLL_ROT | 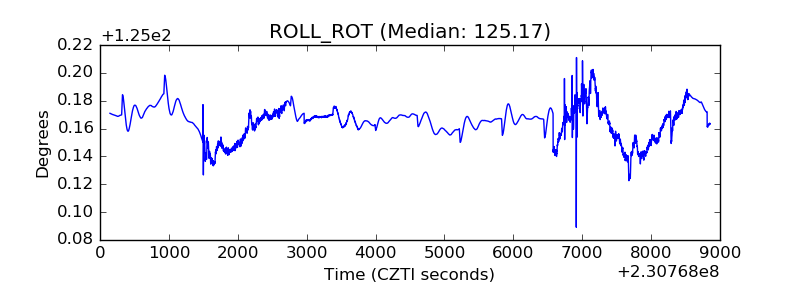 |
| _Roll_DEC | 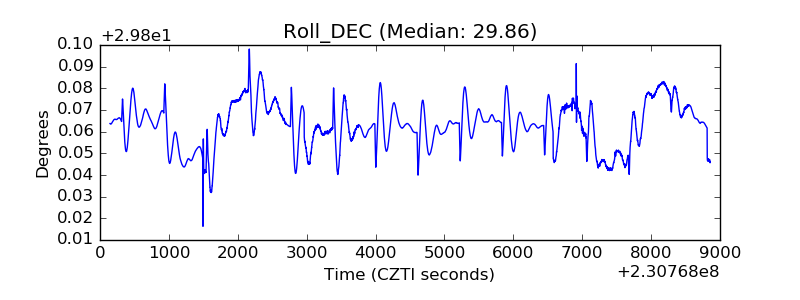 |
| _Roll_RA | 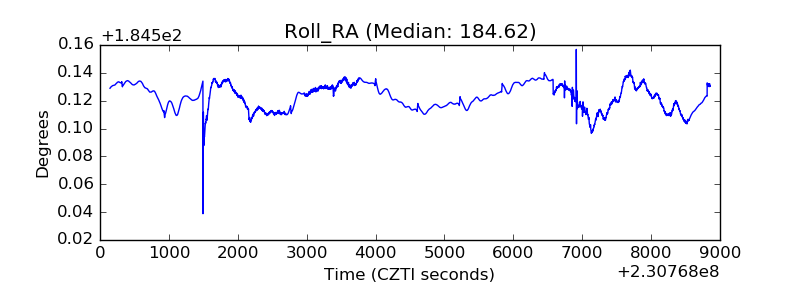 |
| Veto Counter | 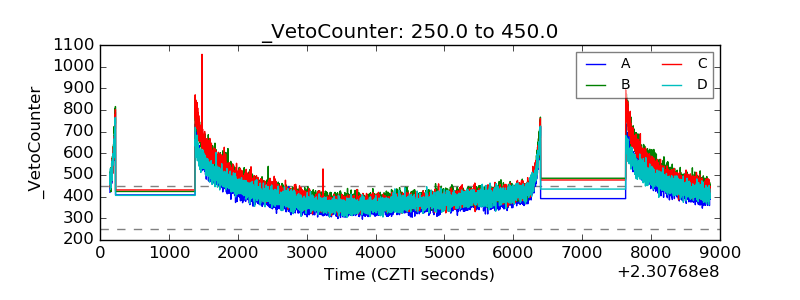 |