| Param | Original file | Final file |
|---|---|---|
| Filename | modeM0/AS1G07_060T01_9000001200_08511cztM0_level2.evt | modeM0/AS1G07_060T01_9000001200_08511cztM0_level2_quad_clean.evt |
| Size (bytes) | 749,085,120 | 120,170,880 |
| Size | 714.4 MB | 114.6 MB |
| Events in quadrant A | 4,918,106 | 751,211 |
| Events in quadrant B | 5,147,698 | 763,914 |
| Events in quadrant C | 4,676,896 | 742,669 |
| Events in quadrant D | 7,247,297 | 669,713 |
| Mode SS | |||
|---|---|---|---|
| Quadrant | BADHDUFLAG | Total packets | Discarded packets |
| A | 0 | 212 | 0 |
| B | 0 | 212 | 2 |
| C | 0 | 212 | 4 |
| D | 0 | 212 | 0 |
| Mode M0 | |||
|---|---|---|---|
| Quadrant | BADHDUFLAG | Total packets | Discarded packets |
| A | 0 | 21715 | 258 |
| B | 0 | 22084 | 204 |
| C | 0 | 21190 | 164 |
| D | 0 | 30103 | 1184 |
| Mode M9 | |||
|---|---|---|---|
| Quadrant | BADHDUFLAG | Total packets | Discarded packets |
| A | 0 | 26 | 0 |
| B | 0 | 26 | 0 |
| C | 0 | 26 | 0 |
| D | 0 | 26 | 0 |
| Quadrant | Total seconds | Saturated seconds | Saturation percentage |
|---|---|---|---|
| A | 10277 | 66 | 0.642211% |
| B | 10288 | 113 | 1.098367% |
| C | 10301 | 27 | 0.262110% |
| D | 10201 | 832 | 8.156063% |
Noise dominated data is calculated using 1-second bins in cleaned event files. If a bin has >2000 counts, and if more than 50% of those come from <1% of pixels, then it is considered to be noise-dominated and hence unusable.
| Quadrant | # 1 sec bins | Bins with >0 counts | Bins with >2000 counts | High rate bins dominated by noise | Noise dominated (total time) | Noise dominated (detector-on time) | Marked lightcurve |
|---|---|---|---|---|---|---|---|
| A | 12965 | 10377 | 19 | 19 | 0.15% | 0.18% | 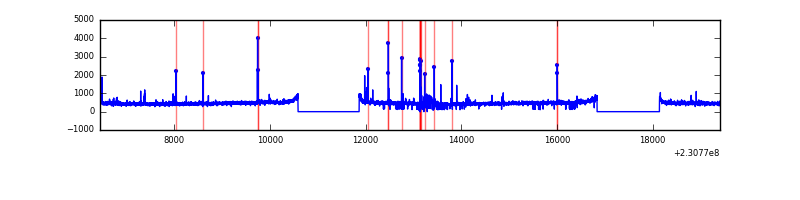 |
| B | 12965 | 10375 | 33 | 33 | 0.25% | 0.32% | 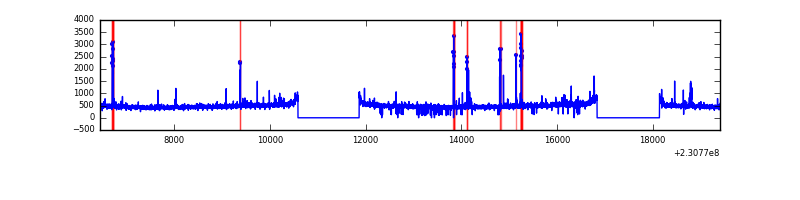 |
| C | 12965 | 10377 | 0 | 0 | 0.00% | 0.00% | 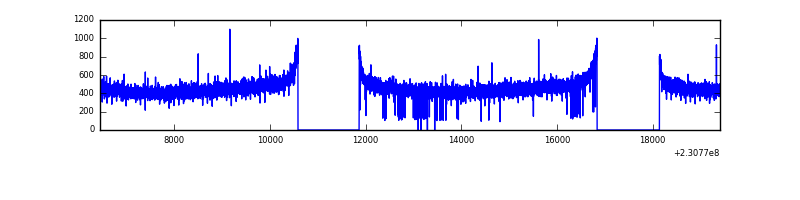 |
| D | 12965 | 10296 | 762 | 762 | 5.88% | 7.40% | 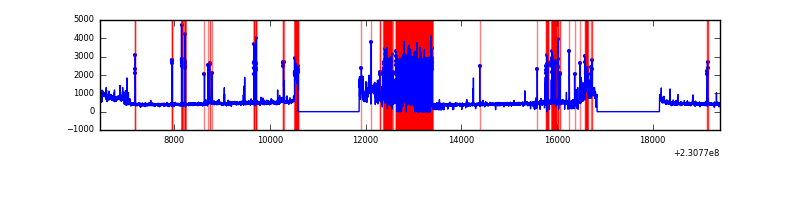 |
Top three noisy pixels from each quadrant. If the there are fewer than three noisy pixels in the level2.evt file, extra rows are filled as -1
| Pixel properties | Quadrant properties | ||||||
|---|---|---|---|---|---|---|---|
| Quadrant | DetID | PixID | Counts | Sigma | Mean | Median | Sigma |
| A | 5 | 16 | 103247 | 411.41 | 1230 | 1203 | 248.0 |
| A | 15 | 236 | 81066 | 321.98 | 1230 | 1203 | 248.0 |
| A | 0 | 226 | 11427 | 41.22 | 1230 | 1203 | 248.0 |
| B | 5 | 255 | 84352 | 355.27 | 1244 | 1221 | 234.0 |
| B | 0 | 214 | 73438 | 308.62 | 1244 | 1221 | 234.0 |
| B | 10 | 16 | 71497 | 300.33 | 1244 | 1221 | 234.0 |
| C | 13 | 61 | 9039 | 28.49 | 1197 | 1204 | 275.0 |
| C | 8 | 222 | 4771 | 12.97 | 1197 | 1204 | 275.0 |
| C | 14 | 67 | 3819 | 9.51 | 1197 | 1204 | 275.0 |
| D | 13 | 105 | 2364436 | 8544.81 | 1130 | 1102 | 276.6 |
| D | 13 | 169 | 260739 | 938.74 | 1130 | 1102 | 276.6 |
| D | 1 | 52 | 226266 | 814.1 | 1130 | 1102 | 276.6 |
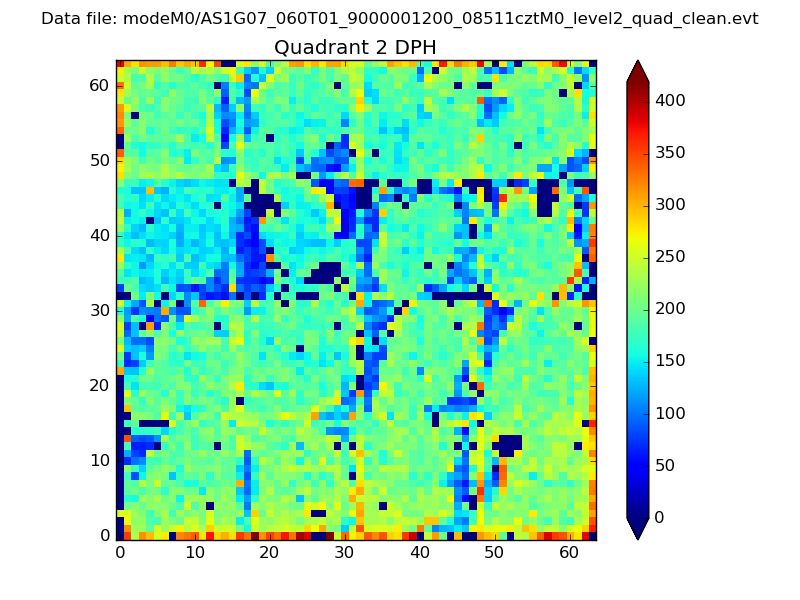
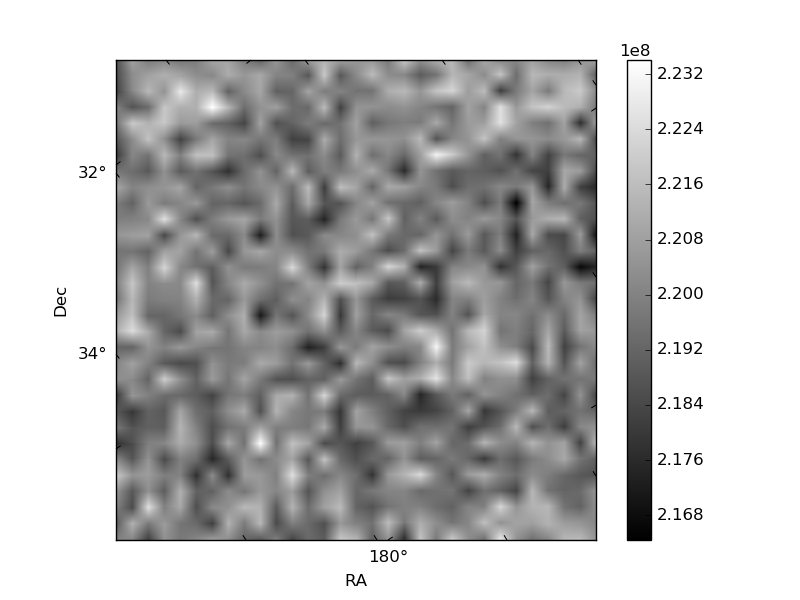
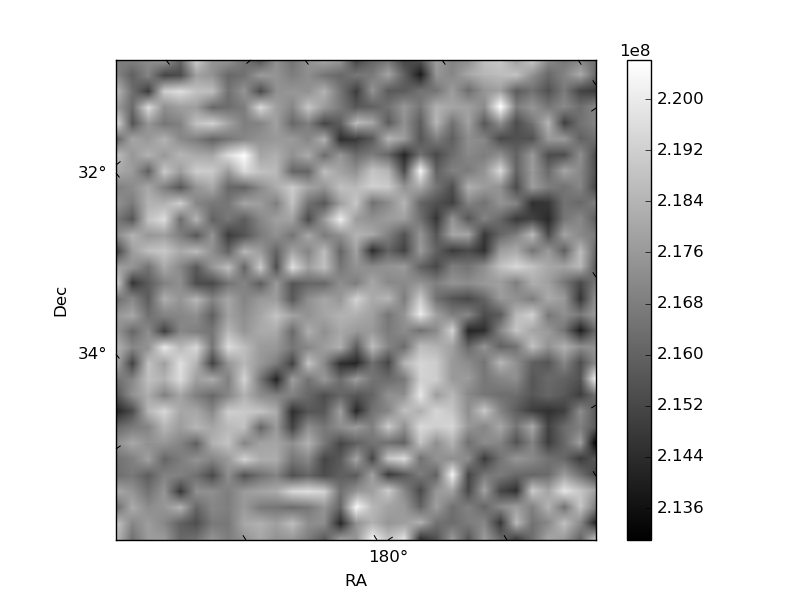
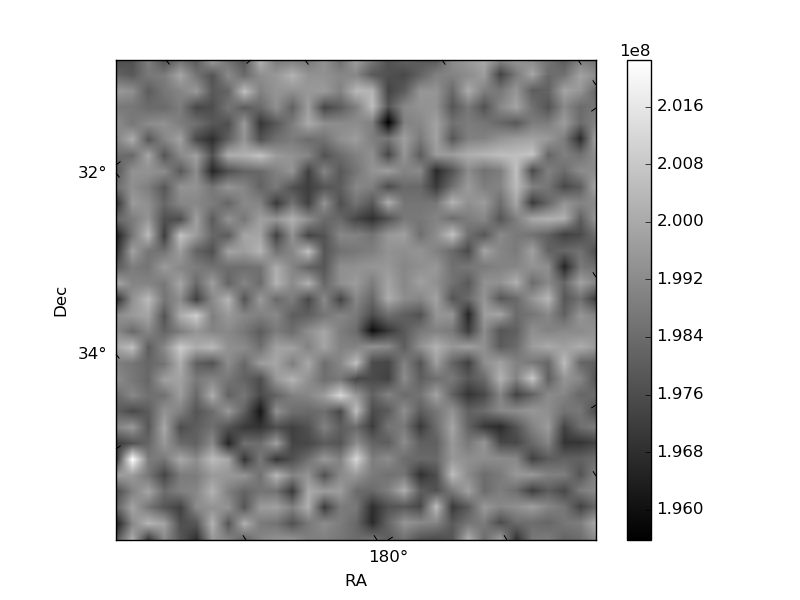
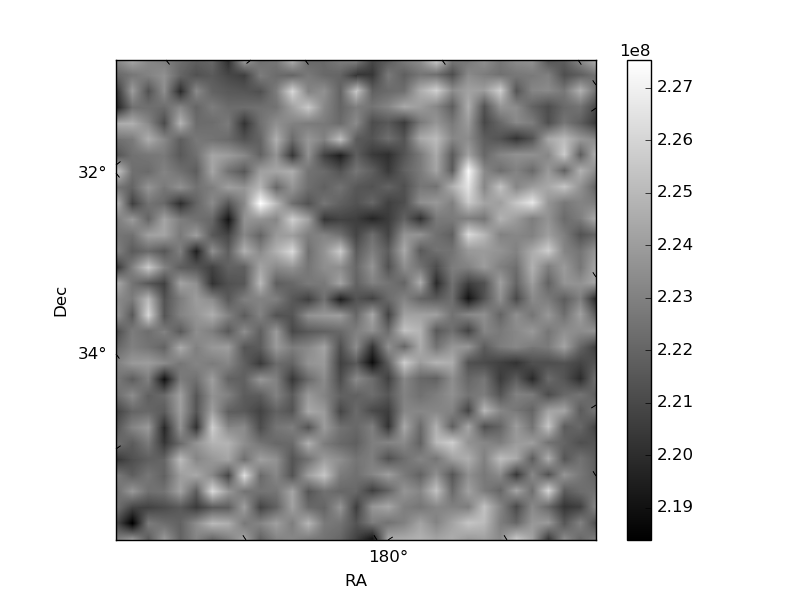
Histogram calculated using DETX and DETY for each event in the final _common_clean file
| Quadrant A | 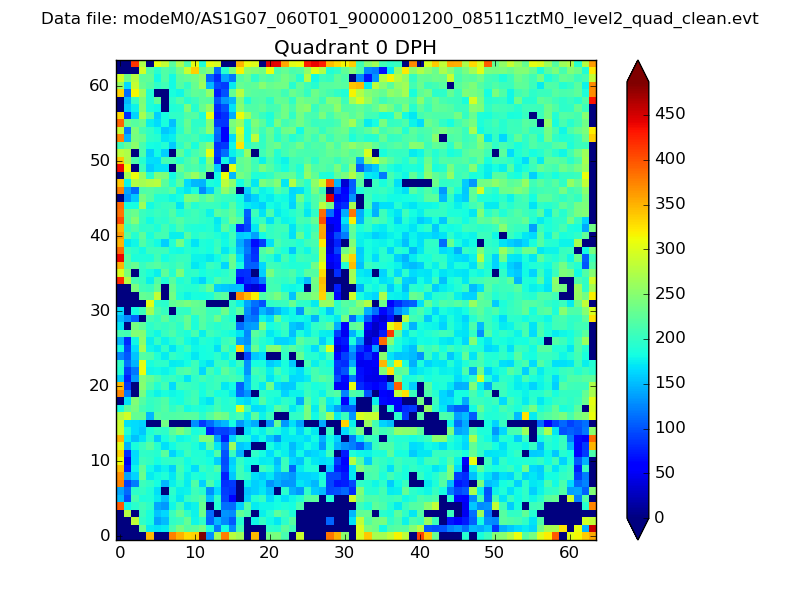 |
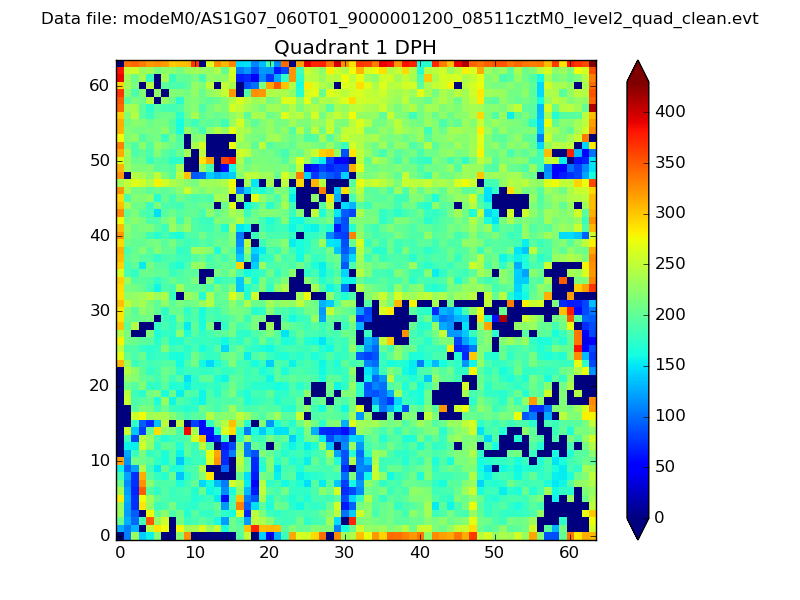 |
Quadrant B |
|---|---|---|---|
| Quadrant D | 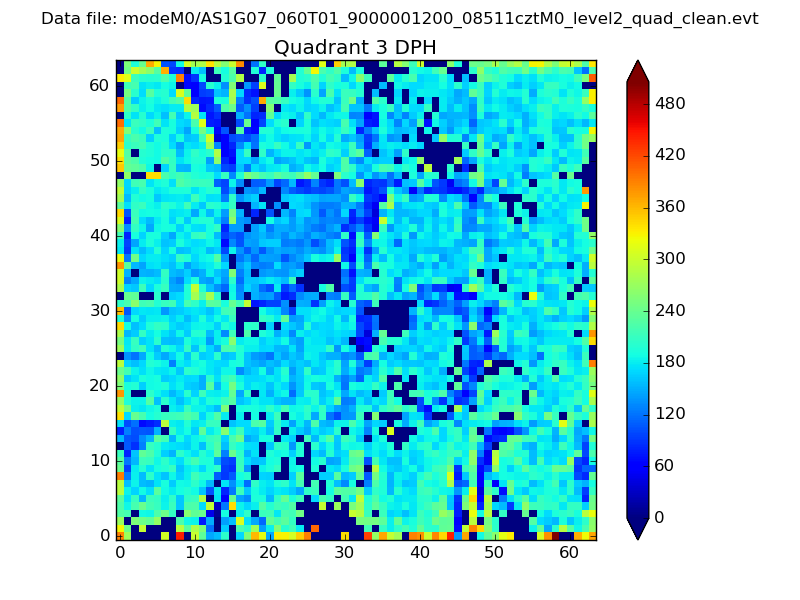 |
 |
Quadrant C |
| Plot type | Count rate plots | Images |
|---|---|---|
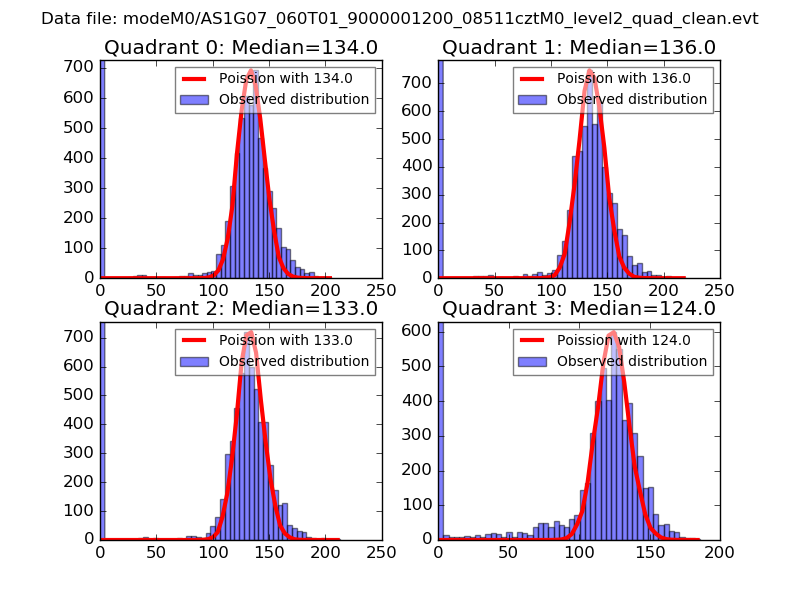
| Comparison with Poisson distribution Blue bars denote a histogram of data divided into 1 sec bins. Red curve is a Poisson curve with rate = median count rate of data. |
 |
 |
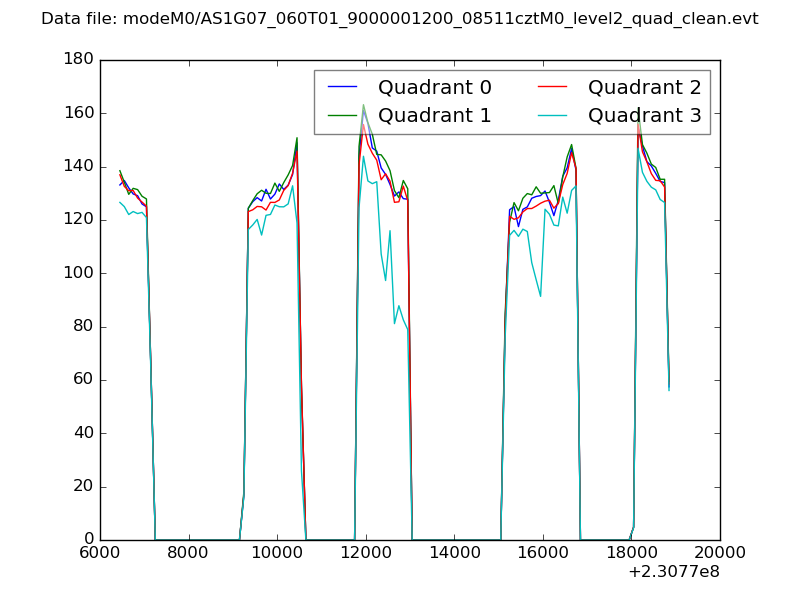
| Quadrant-wise count rates Data is divided into 100 sec bins |
 |
|
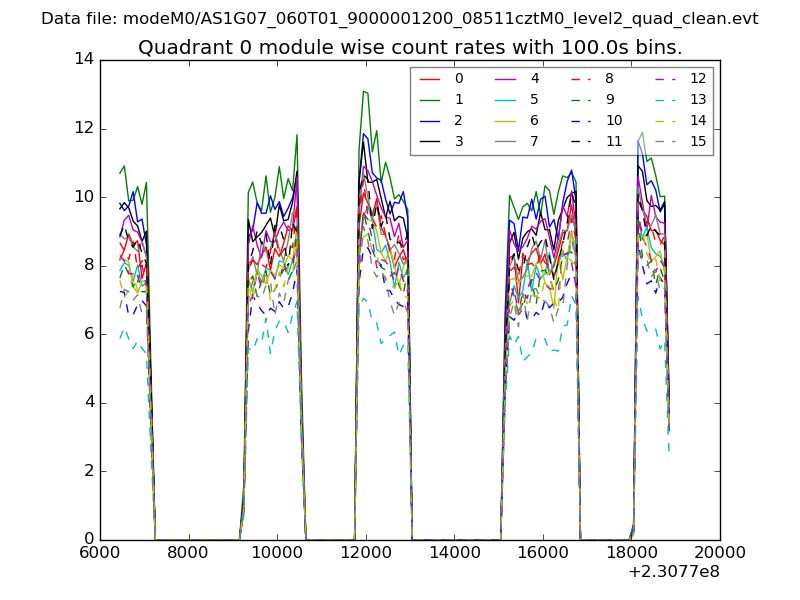
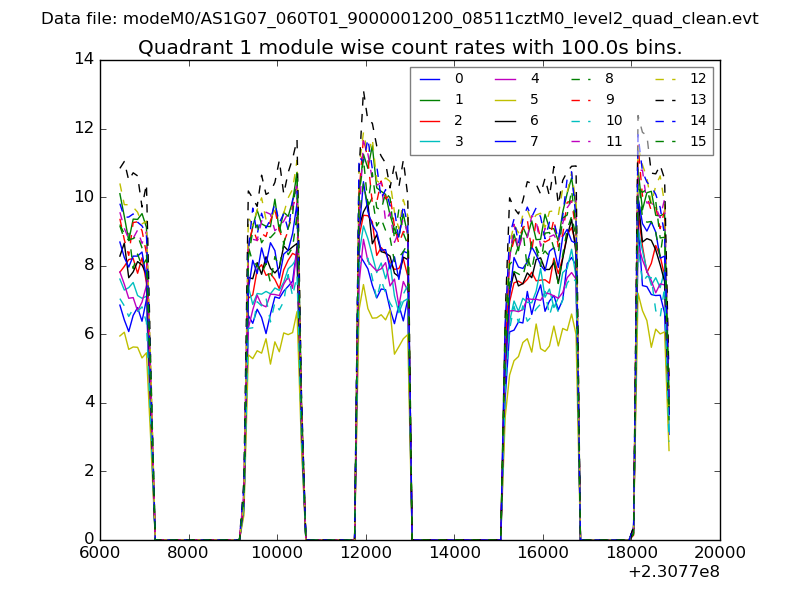
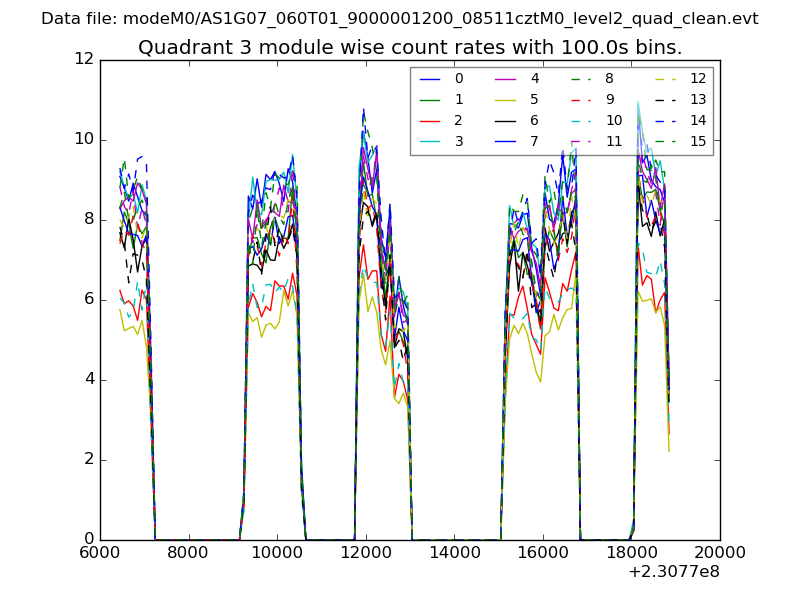
| Module-wise count rates for Quadrant A Data is divided into 100 sec bins |
 |
 |
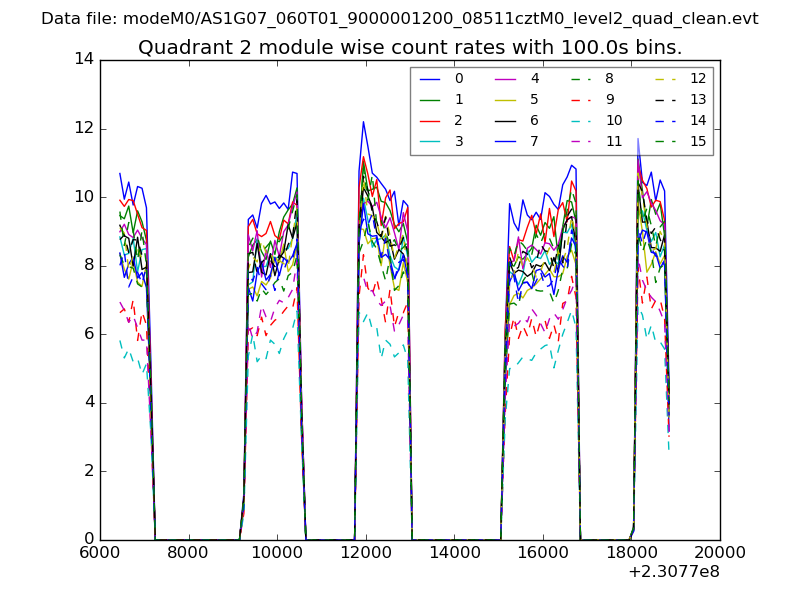
| Module-wise count rates for Quadrant B Data is divided into 100 sec bins |
 |
 |
| Module-wise count rates for Quadrant C Data is divided into 100 sec bins |
 |
 |
| Module-wise count rates for Quadrant D Data is divided into 100 sec bins |
 |
 |
| Parameter | Plot |
|---|---|
| CZT HV Monitor | 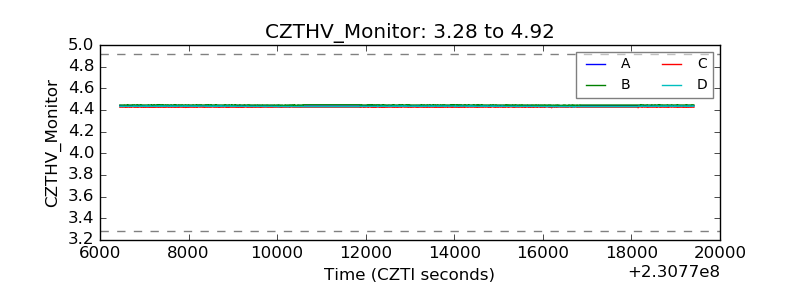 |
| D_VDD | 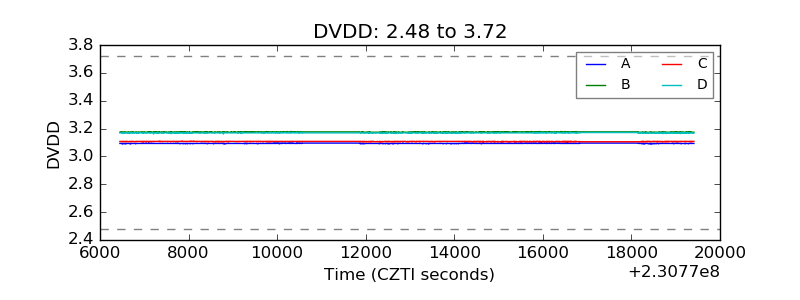 |
| Temperature 1 |  |
| Veto HV Monitor | 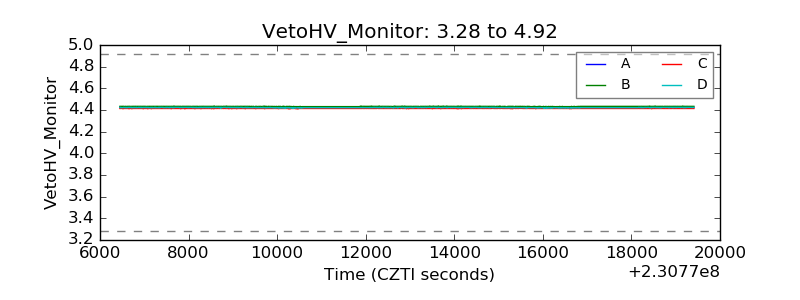 |
| Veto LLD | 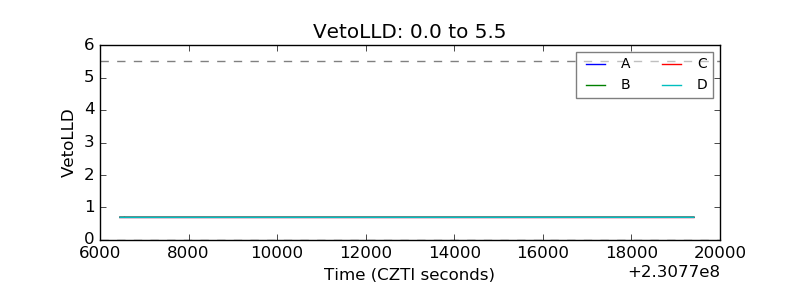 |
| Alpha Counter | 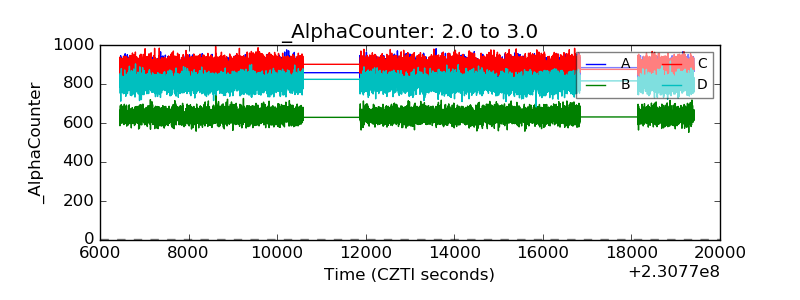 |
| _CPM_Rate | 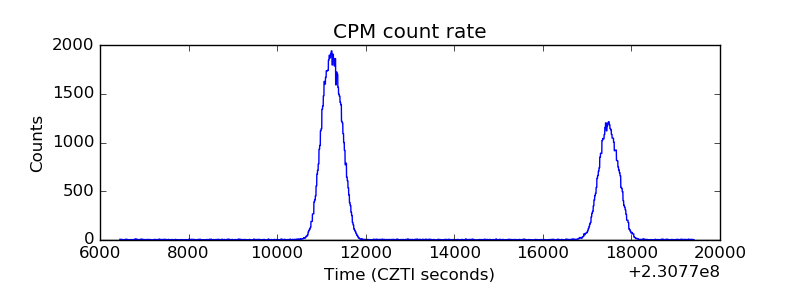 |
| CZT Counter | 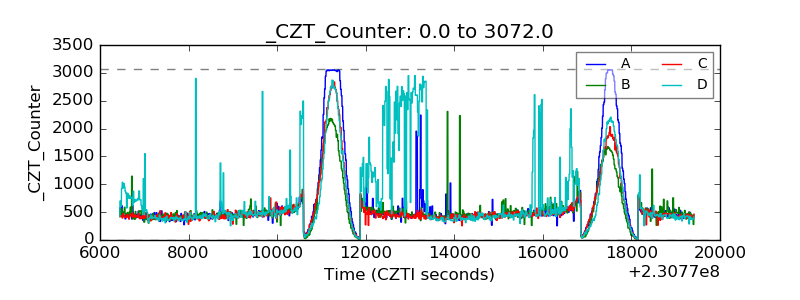 |
| +2.5 Volts monitor |  |
| +5 Volts monitor |  |
| _ROLL_ROT | 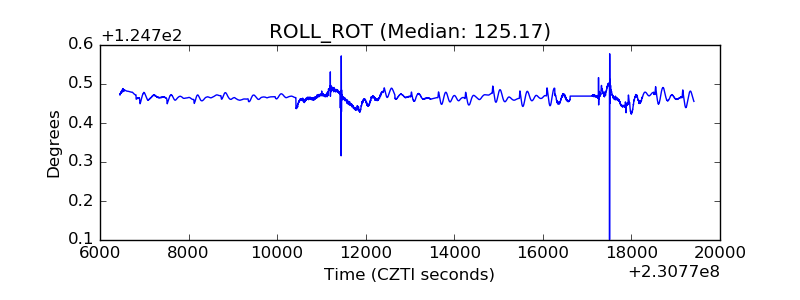 |
| _Roll_DEC | 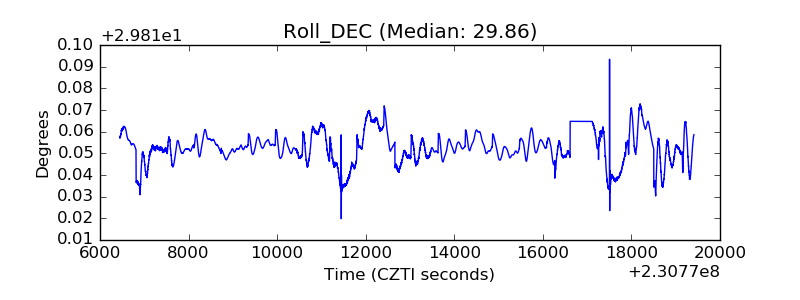 |
| _Roll_RA | 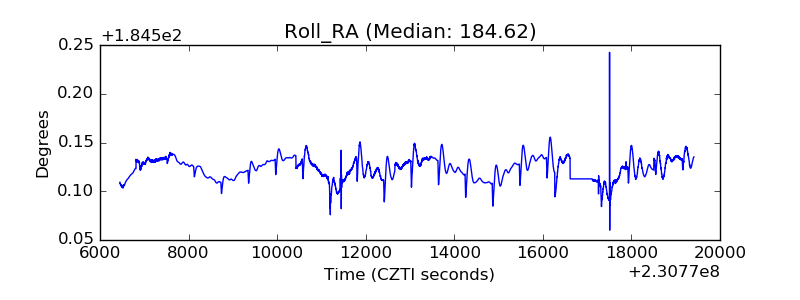 |
| Veto Counter | 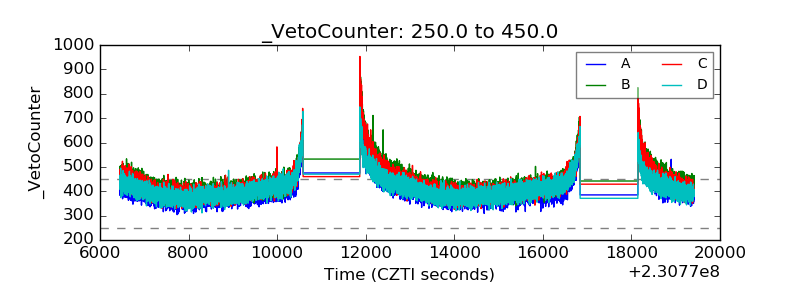 |