| Param | Original file | Final file |
|---|---|---|
| Filename | modeM0/AS1G07_060T01_9000001200_08512cztM0_level2.evt | modeM0/AS1G07_060T01_9000001200_08512cztM0_level2_quad_clean.evt |
| Size (bytes) | 418,498,560 | 72,241,920 |
| Size | 399.1 MB | 68.9 MB |
| Events in quadrant A | 3,018,436 | 440,338 |
| Events in quadrant B | 3,271,711 | 444,837 |
| Events in quadrant C | 2,940,230 | 433,683 |
| Events in quadrant D | 3,003,806 | 417,494 |
| Mode SS | |||
|---|---|---|---|
| Quadrant | BADHDUFLAG | Total packets | Discarded packets |
| A | 0 | 132 | 0 |
| B | 0 | 132 | 0 |
| C | 0 | 132 | 0 |
| D | 0 | 132 | 0 |
| Mode M0 | |||
|---|---|---|---|
| Quadrant | BADHDUFLAG | Total packets | Discarded packets |
| A | 0 | 13316 | 10 |
| B | 0 | 13879 | 4 |
| C | 0 | 13236 | 11 |
| D | 0 | 13605 | 5 |
| Mode M9 | |||
|---|---|---|---|
| Quadrant | BADHDUFLAG | Total packets | Discarded packets |
| A | 0 | 20 | 0 |
| B | 0 | 20 | 0 |
| C | 0 | 20 | 0 |
| D | 0 | 21 | 0 |
| Quadrant | Total seconds | Saturated seconds | Saturation percentage |
|---|---|---|---|
| A | 6462 | 69 | 1.067781% |
| B | 6464 | 117 | 1.810025% |
| C | 6461 | 36 | 0.557189% |
| D | 6464 | 63 | 0.974629% |
Noise dominated data is calculated using 1-second bins in cleaned event files. If a bin has >2000 counts, and if more than 50% of those come from <1% of pixels, then it is considered to be noise-dominated and hence unusable.
| Quadrant | # 1 sec bins | Bins with >0 counts | Bins with >2000 counts | High rate bins dominated by noise | Noise dominated (total time) | Noise dominated (detector-on time) | Marked lightcurve |
|---|---|---|---|---|---|---|---|
| A | 7605 | 6466 | 2 | 2 | 0.03% | 0.03% | 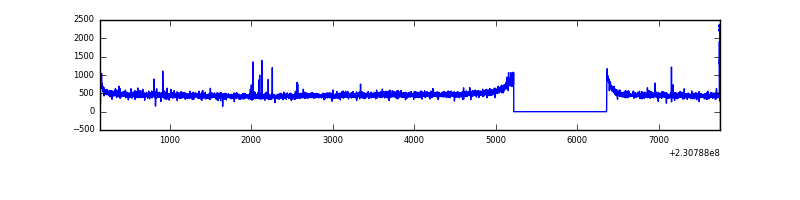 |
| B | 7605 | 6466 | 28 | 28 | 0.37% | 0.43% | 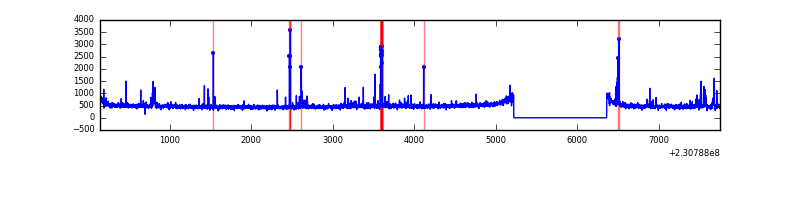 |
| C | 7605 | 6466 | 0 | 0 | 0.00% | 0.00% | 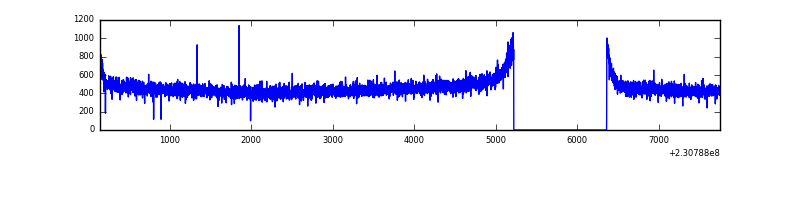 |
| D | 7605 | 6466 | 28 | 28 | 0.37% | 0.43% | 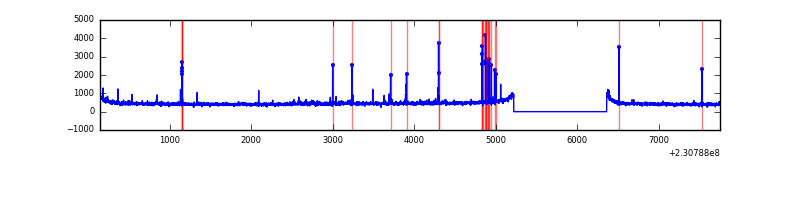 |
Top three noisy pixels from each quadrant. If the there are fewer than three noisy pixels in the level2.evt file, extra rows are filled as -1
| Pixel properties | Quadrant properties | ||||||
|---|---|---|---|---|---|---|---|
| Quadrant | DetID | PixID | Counts | Sigma | Mean | Median | Sigma |
| A | 5 | 16 | 23577 | 144.87 | 777 | 760 | 157.5 |
| A | 0 | 226 | 7197 | 40.87 | 777 | 760 | 157.5 |
| A | 12 | 194 | 6731 | 37.91 | 777 | 760 | 157.5 |
| B | 10 | 16 | 114782 | 766.09 | 780 | 762 | 148.8 |
| B | 15 | 255 | 47877 | 316.56 | 780 | 762 | 148.8 |
| B | 0 | 214 | 43333 | 286.03 | 780 | 762 | 148.8 |
| C | 13 | 61 | 5682 | 28.26 | 752 | 756 | 174.3 |
| C | 14 | 67 | 2869 | 12.12 | 752 | 756 | 174.3 |
| C | 7 | 238 | 2751 | 11.44 | 752 | 756 | 174.3 |
| D | 1 | 52 | 72011 | 384.65 | 742 | 723 | 185.3 |
| D | 13 | 169 | 22622 | 118.16 | 742 | 723 | 185.3 |
| D | 2 | 234 | 19320 | 100.35 | 742 | 723 | 185.3 |
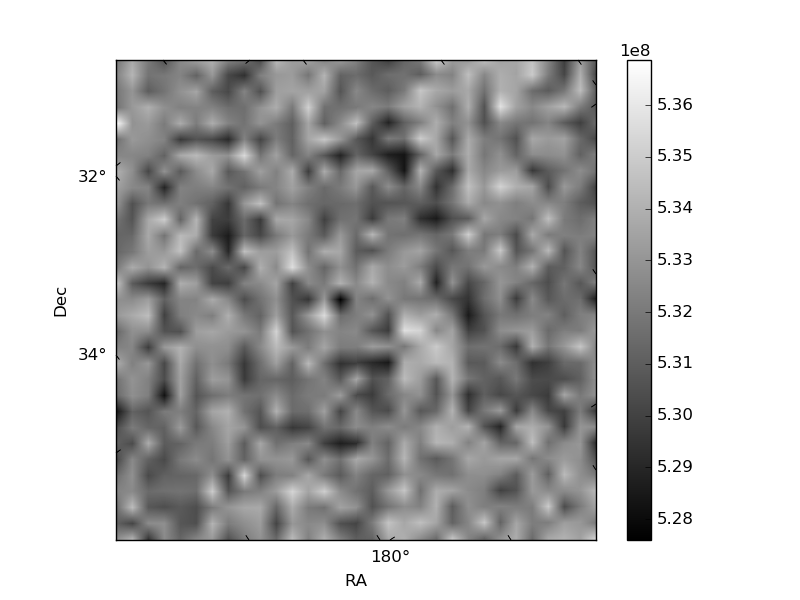
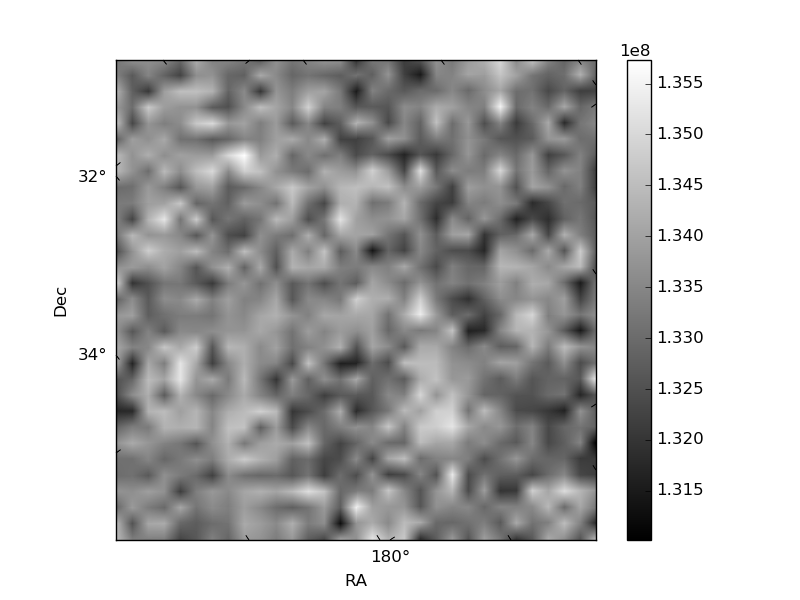
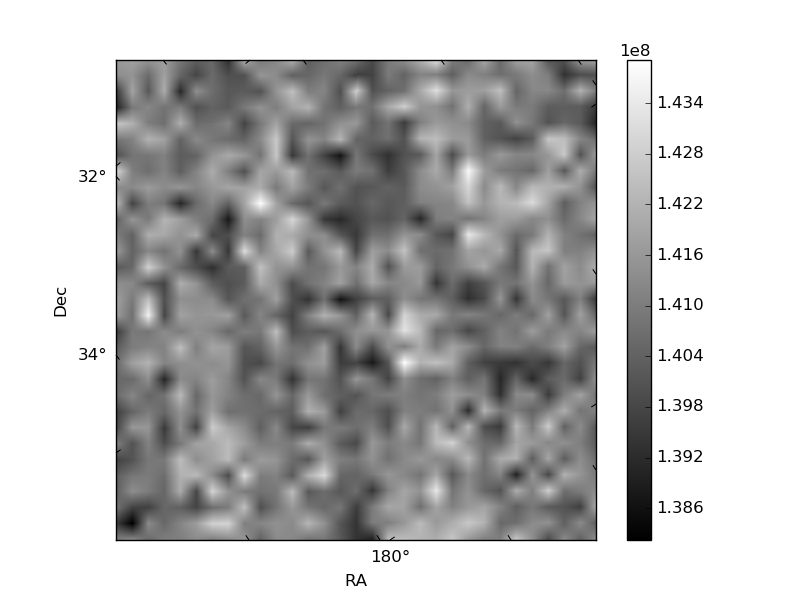
Histogram calculated using DETX and DETY for each event in the final _common_clean file
| Quadrant A | 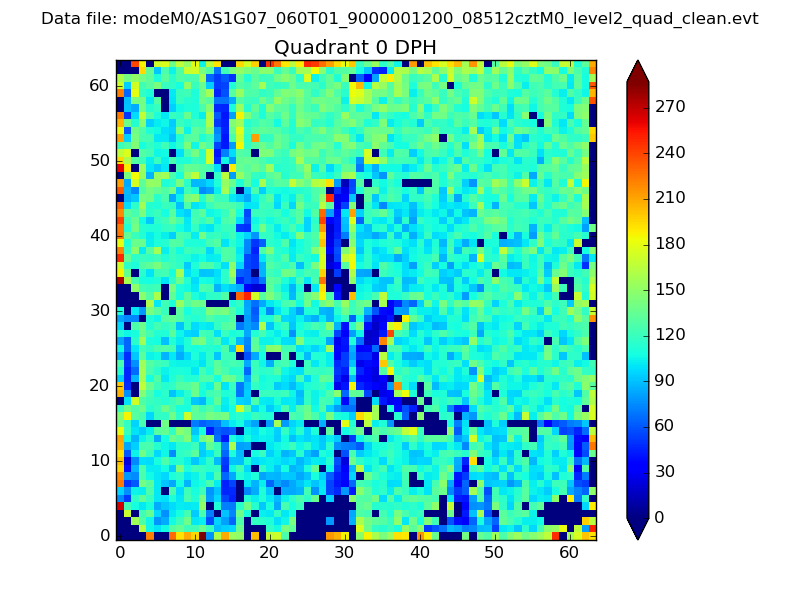 |
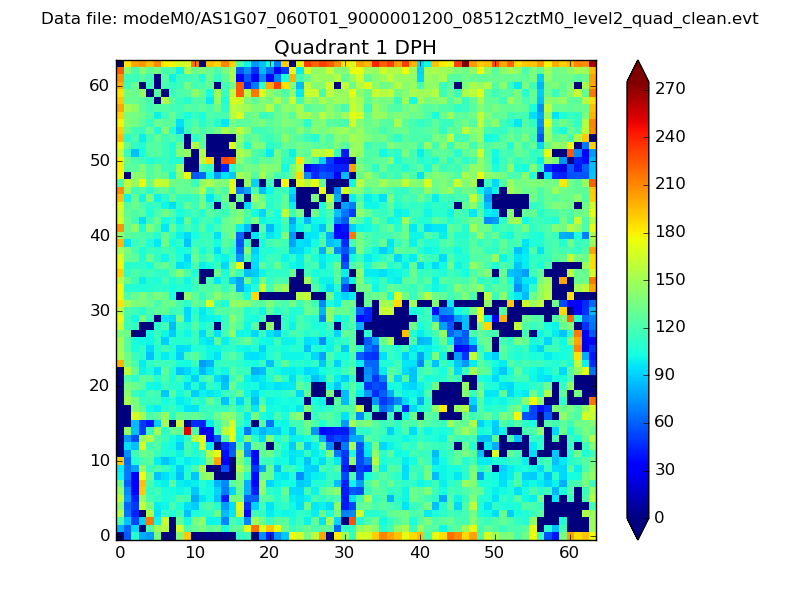 |
Quadrant B |
|---|---|---|---|
| Quadrant D | 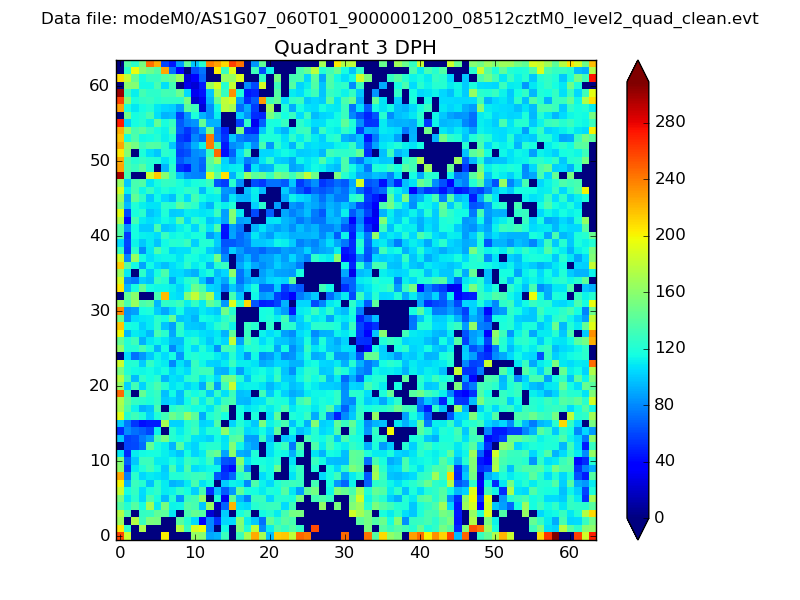 |
 |
Quadrant C |
| Plot type | Count rate plots | Images |
|---|---|---|
| Comparison with Poisson distribution Blue bars denote a histogram of data divided into 1 sec bins. Red curve is a Poisson curve with rate = median count rate of data. |
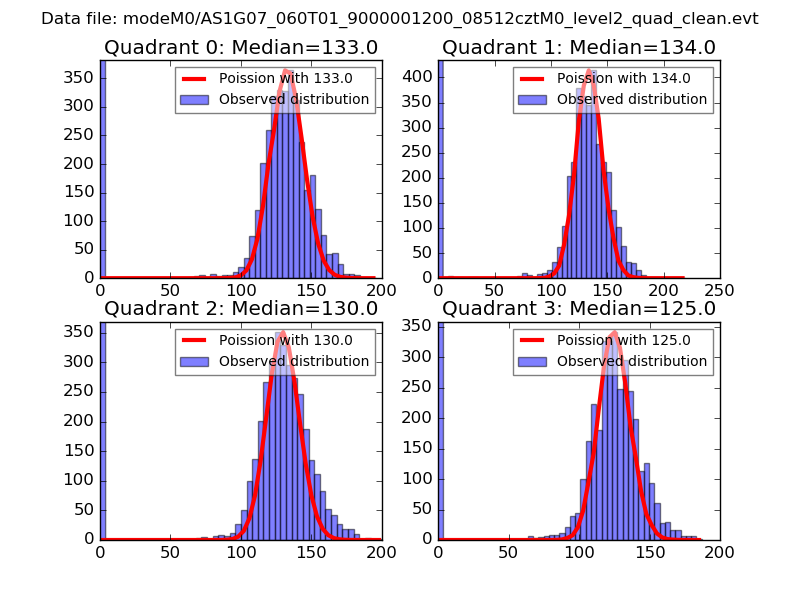 |
 |
| Quadrant-wise count rates Data is divided into 100 sec bins |
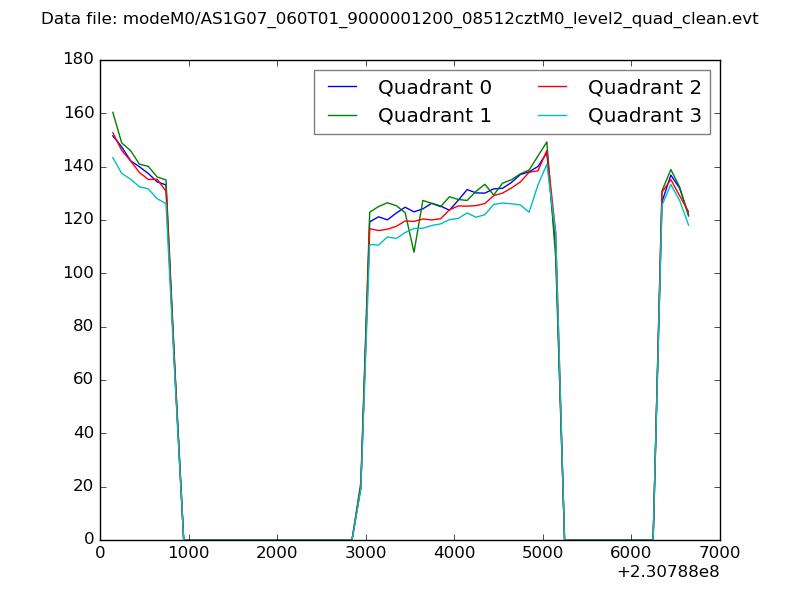 |
|
| Module-wise count rates for Quadrant A Data is divided into 100 sec bins |
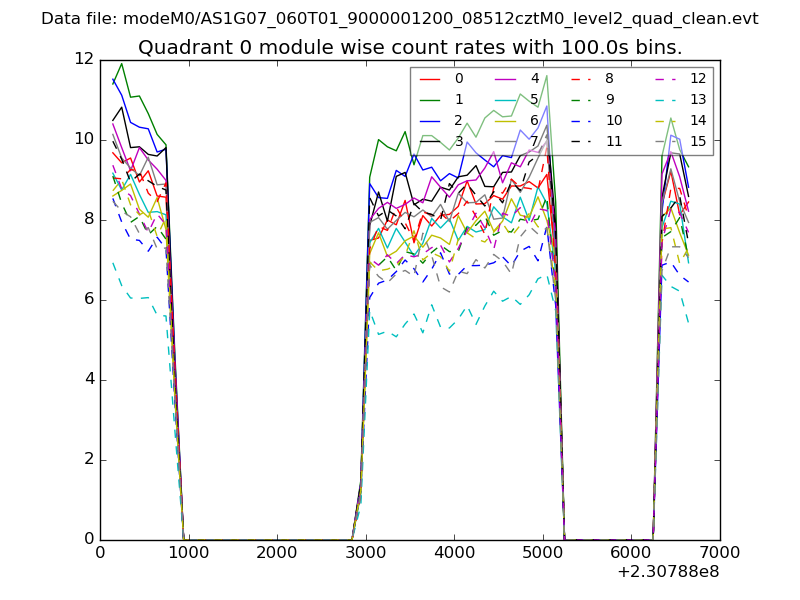 |
 |
| Module-wise count rates for Quadrant B Data is divided into 100 sec bins |
 |
 |
| Module-wise count rates for Quadrant C Data is divided into 100 sec bins |
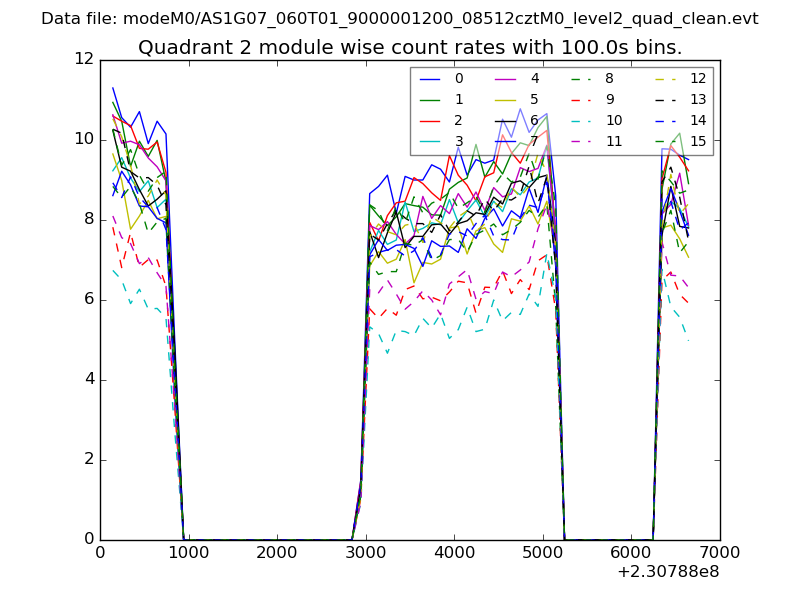 |
 |
| Module-wise count rates for Quadrant D Data is divided into 100 sec bins |
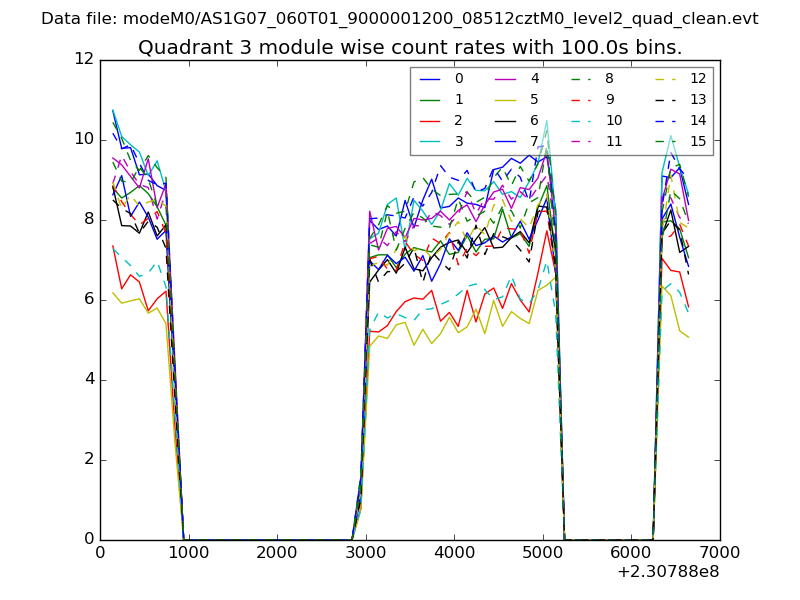 |
 |
| Parameter | Plot |
|---|---|
| CZT HV Monitor | 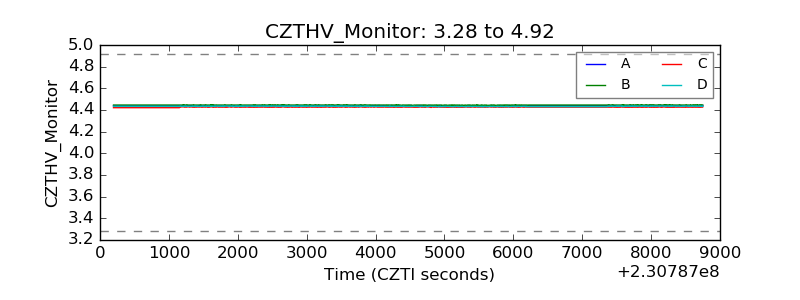 |
| D_VDD | 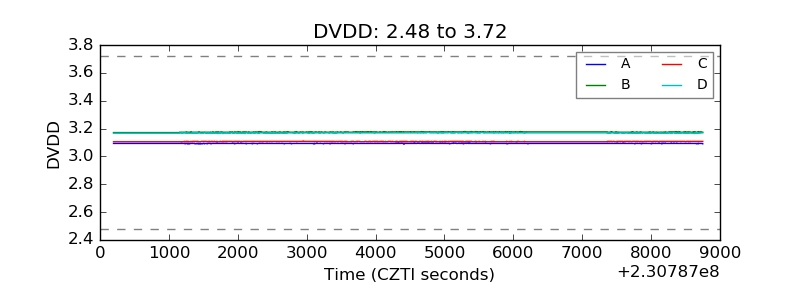 |
| Temperature 1 | 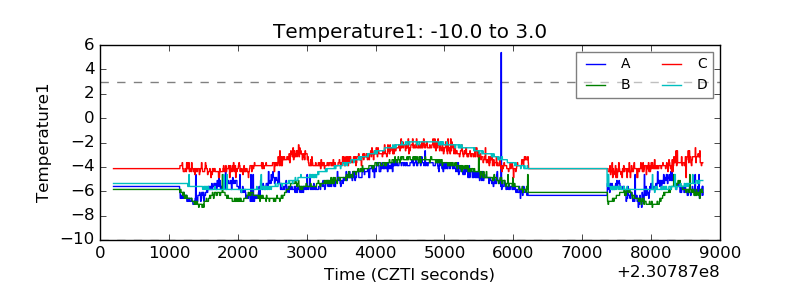 |
| Veto HV Monitor | 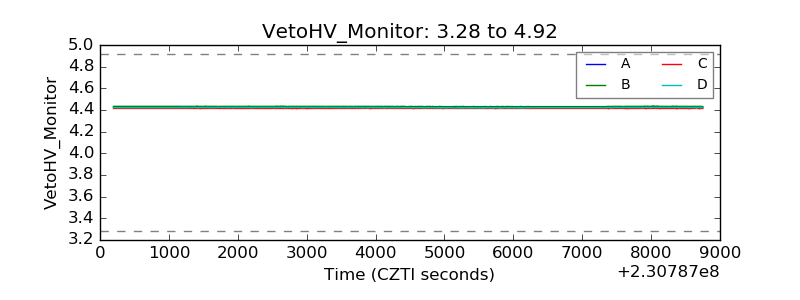 |
| Veto LLD | 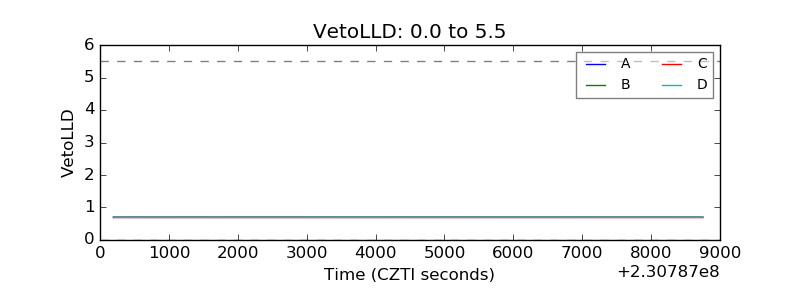 |
| Alpha Counter | 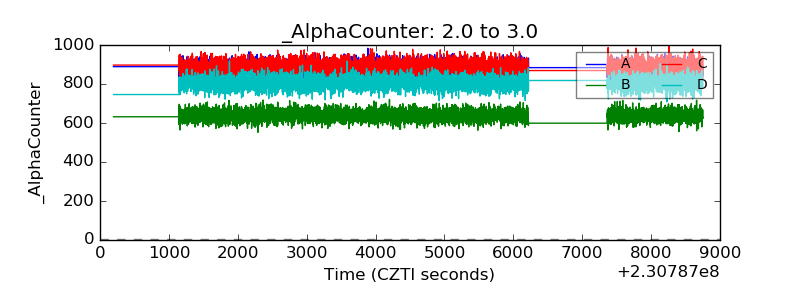 |
| _CPM_Rate | 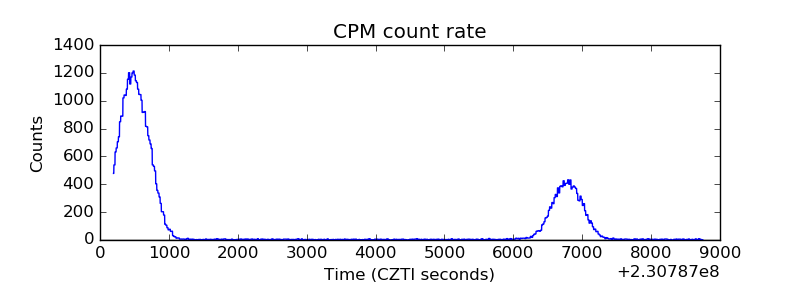 |
| CZT Counter | 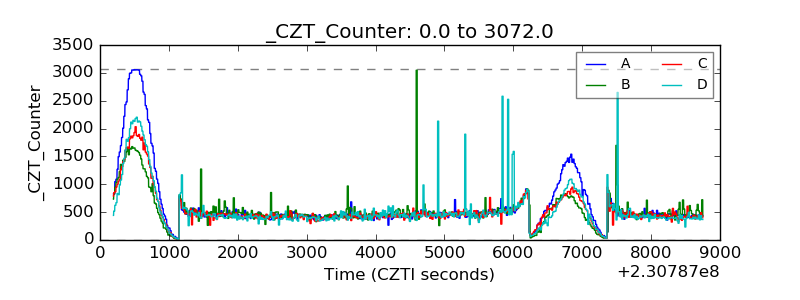 |
| +2.5 Volts monitor |  |
| +5 Volts monitor |  |
| _ROLL_ROT | 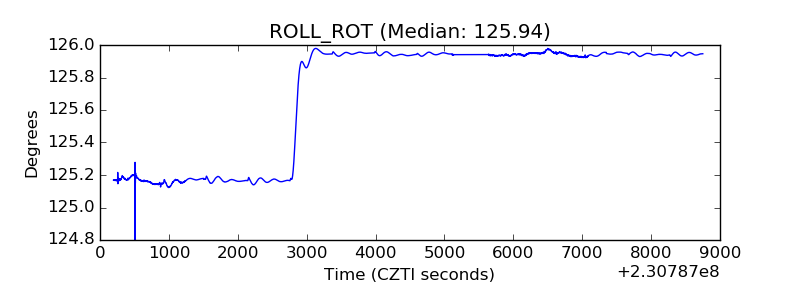 |
| _Roll_DEC | 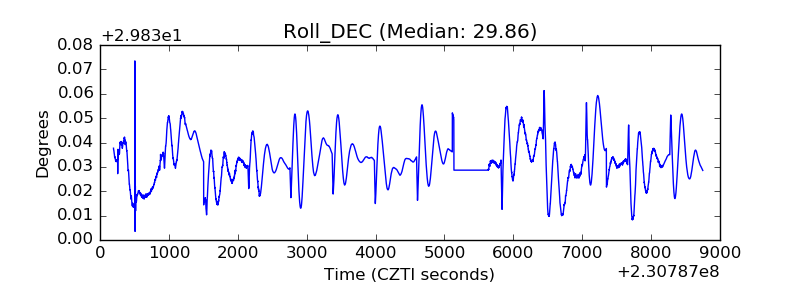 |
| _Roll_RA |  |
| Veto Counter | 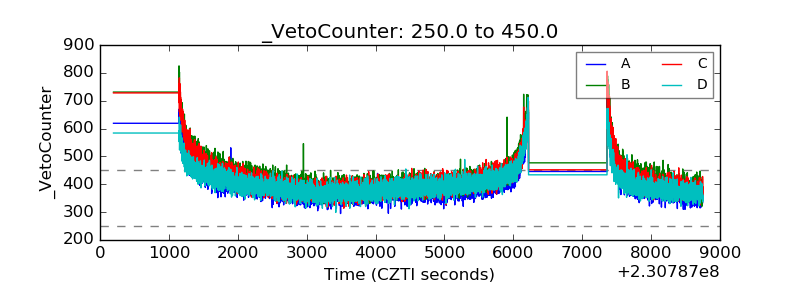 |