| Param | Original file | Final file |
|---|---|---|
| Filename | modeM0/AS1G07_060T01_9000001200_08514cztM0_level2.evt | modeM0/AS1G07_060T01_9000001200_08514cztM0_level2_quad_clean.evt |
| Size (bytes) | 517,570,560 | 79,102,080 |
| Size | 493.6 MB | 75.4 MB |
| Events in quadrant A | 3,593,598 | 472,386 |
| Events in quadrant B | 4,327,451 | 467,249 |
| Events in quadrant C | 3,486,945 | 473,564 |
| Events in quadrant D | 3,752,832 | 455,765 |
| Mode SS | |||
|---|---|---|---|
| Quadrant | BADHDUFLAG | Total packets | Discarded packets |
| A | 0 | 154 | 0 |
| B | 0 | 154 | 0 |
| C | 0 | 154 | 0 |
| D | 0 | 154 | 0 |
| Mode M0 | |||
|---|---|---|---|
| Quadrant | BADHDUFLAG | Total packets | Discarded packets |
| A | 0 | 15948 | 3 |
| B | 0 | 17936 | 4 |
| C | 0 | 15810 | 2 |
| D | 0 | 16763 | 2 |
| Mode M9 | |||
|---|---|---|---|
| Quadrant | BADHDUFLAG | Total packets | Discarded packets |
| A | 0 | 12 | 0 |
| B | 0 | 12 | 0 |
| C | 0 | 12 | 0 |
| D | 0 | 12 | 0 |
| Quadrant | Total seconds | Saturated seconds | Saturation percentage |
|---|---|---|---|
| A | 7563 | 283 | 3.741901% |
| B | 7562 | 456 | 6.030151% |
| C | 7563 | 177 | 2.340341% |
| D | 7563 | 295 | 3.900569% |
Noise dominated data is calculated using 1-second bins in cleaned event files. If a bin has >2000 counts, and if more than 50% of those come from <1% of pixels, then it is considered to be noise-dominated and hence unusable.
| Quadrant | # 1 sec bins | Bins with >0 counts | Bins with >2000 counts | High rate bins dominated by noise | Noise dominated (total time) | Noise dominated (detector-on time) | Marked lightcurve |
|---|---|---|---|---|---|---|---|
| A | 8723 | 7563 | 9 | 9 | 0.10% | 0.12% | 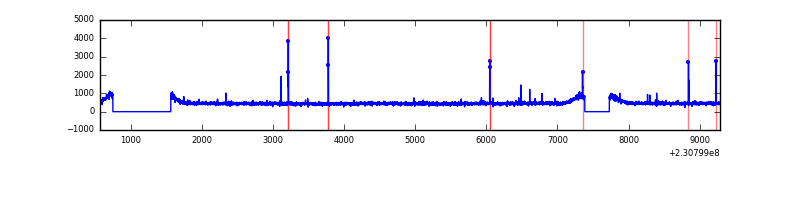 |
| B | 8723 | 7564 | 109 | 109 | 1.25% | 1.44% | 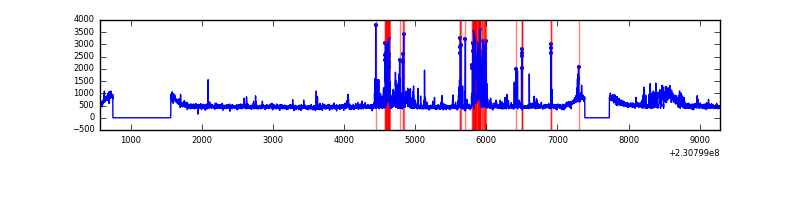 |
| C | 8723 | 7565 | 0 | 0 | 0.00% | 0.00% |  |
| D | 8723 | 7564 | 103 | 103 | 1.18% | 1.36% | 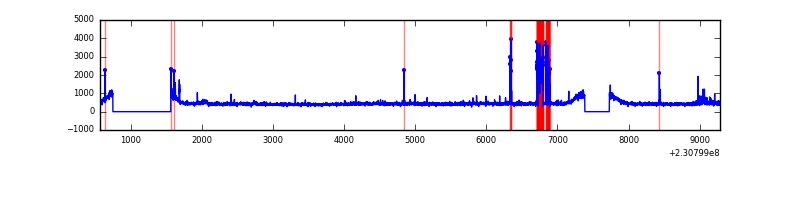 |
Top three noisy pixels from each quadrant. If the there are fewer than three noisy pixels in the level2.evt file, extra rows are filled as -1
| Pixel properties | Quadrant properties | ||||||
|---|---|---|---|---|---|---|---|
| Quadrant | DetID | PixID | Counts | Sigma | Mean | Median | Sigma |
| A | 5 | 16 | 50789 | 262.88 | 917 | 894 | 189.8 |
| A | 1 | 162 | 9401 | 44.82 | 917 | 894 | 189.8 |
| A | 0 | 226 | 8542 | 40.29 | 917 | 894 | 189.8 |
| B | 10 | 16 | 550908 | 3085.3 | 912 | 889 | 178.3 |
| B | 5 | 255 | 185557 | 1035.89 | 912 | 889 | 178.3 |
| B | 12 | 111 | 20545 | 110.26 | 912 | 889 | 178.3 |
| C | 13 | 61 | 6909 | 28.94 | 890 | 893 | 207.9 |
| C | 8 | 128 | 6013 | 24.63 | 890 | 893 | 207.9 |
| C | 8 | 222 | 4612 | 17.89 | 890 | 893 | 207.9 |
| D | 8 | 230 | 255352 | 1131.18 | 882 | 858 | 225.0 |
| D | 1 | 52 | 49983 | 218.35 | 882 | 858 | 225.0 |
| D | 13 | 105 | 41869 | 182.29 | 882 | 858 | 225.0 |
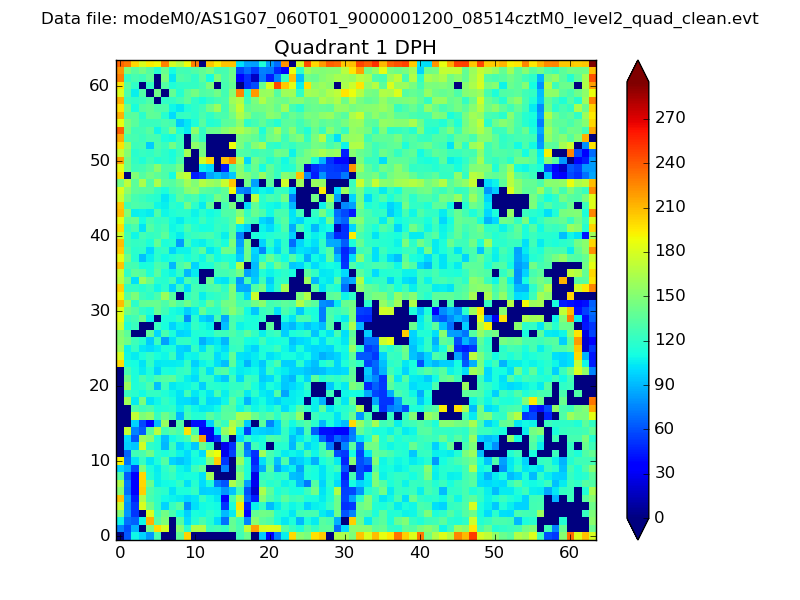
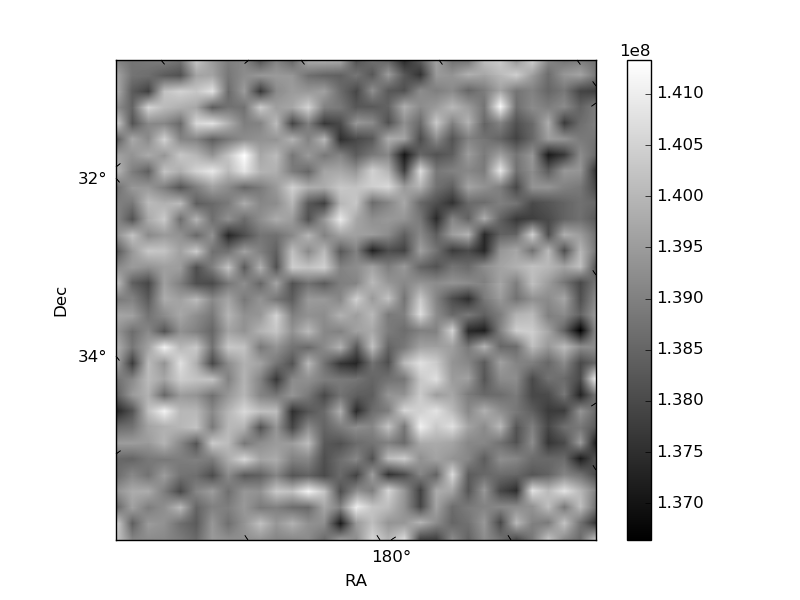
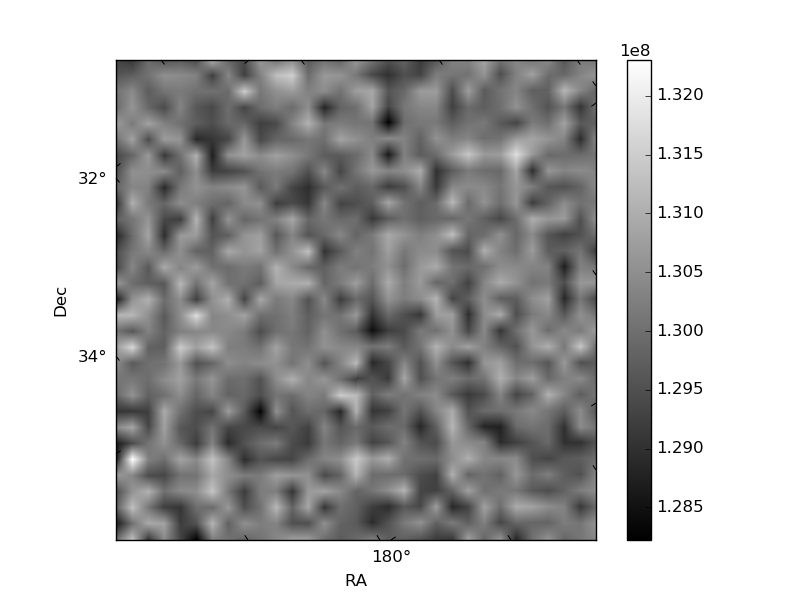
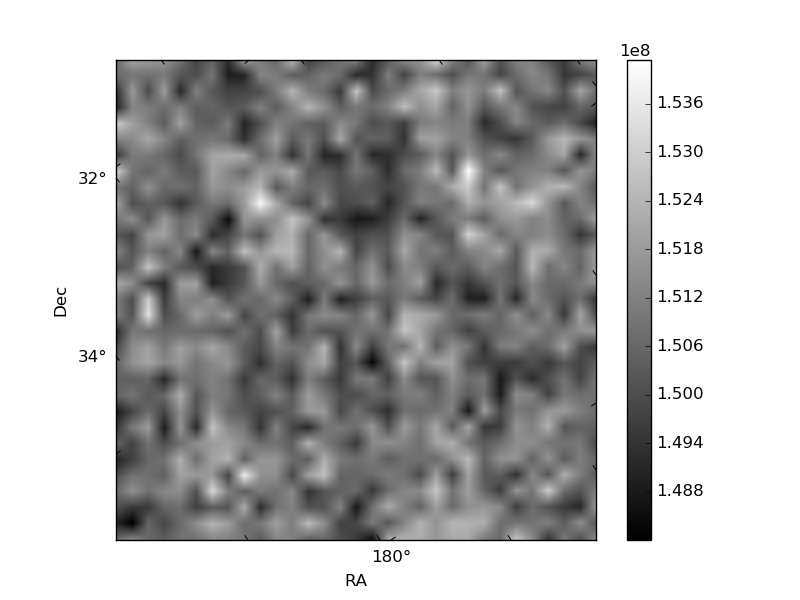
Histogram calculated using DETX and DETY for each event in the final _common_clean file
| Quadrant A | 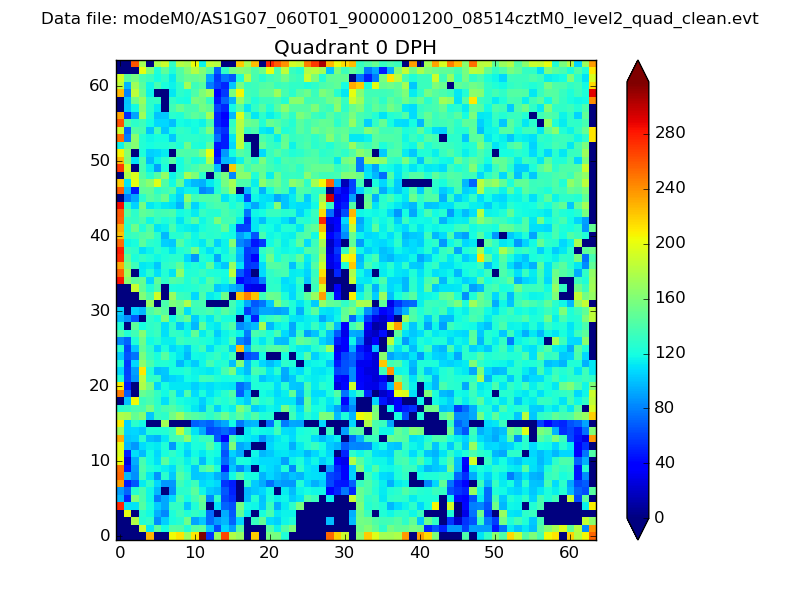 |
 |
Quadrant B |
|---|---|---|---|
| Quadrant D | 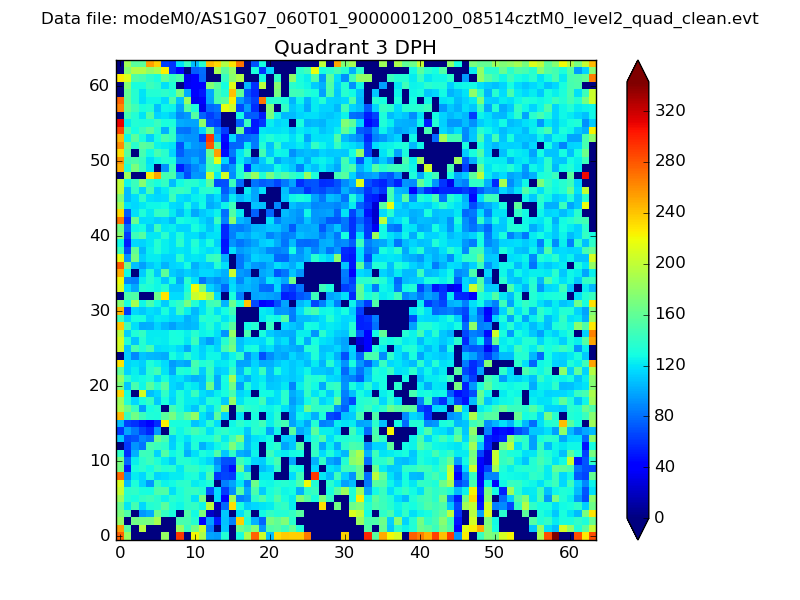 |
 |
Quadrant C |
| Plot type | Count rate plots | Images |
|---|---|---|
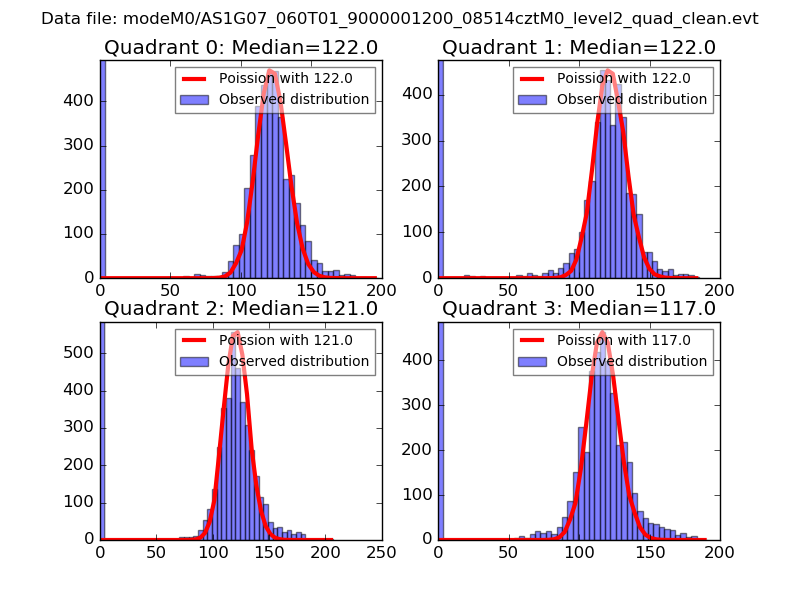
| Comparison with Poisson distribution Blue bars denote a histogram of data divided into 1 sec bins. Red curve is a Poisson curve with rate = median count rate of data. |
 |
 |
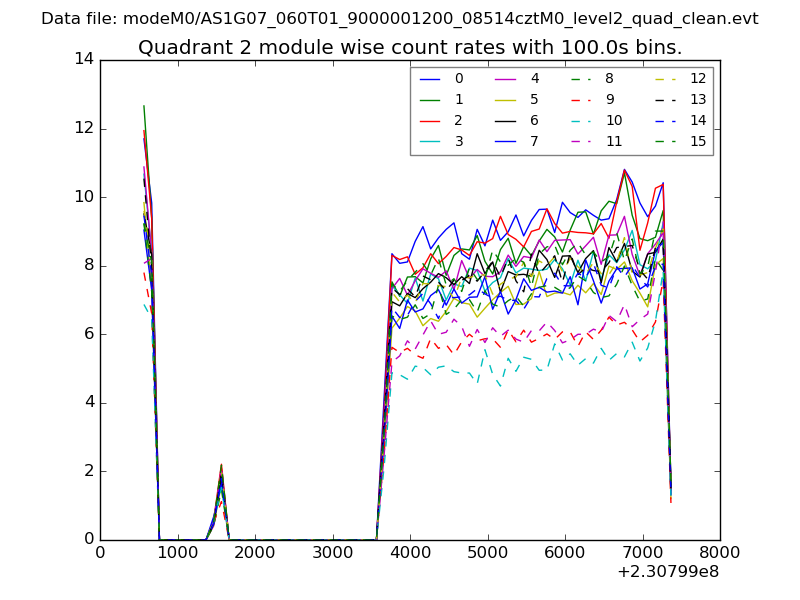
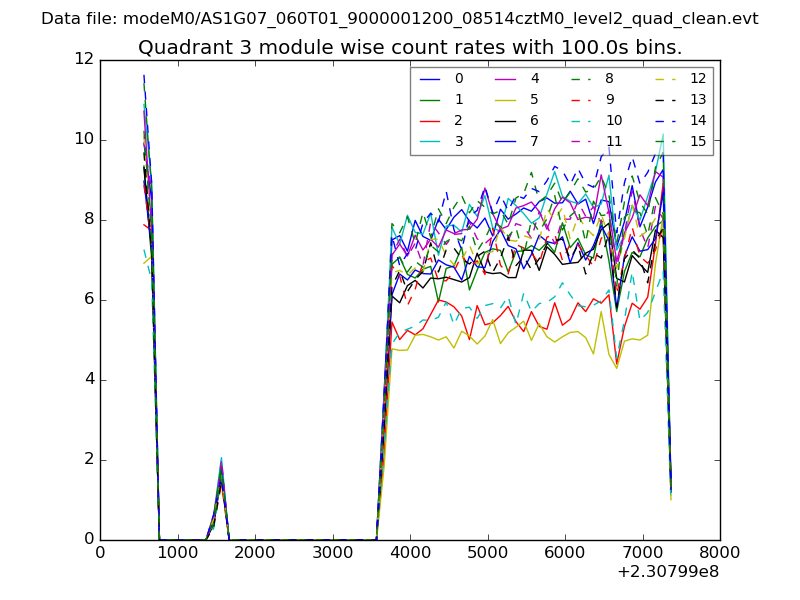
| Quadrant-wise count rates Data is divided into 100 sec bins |
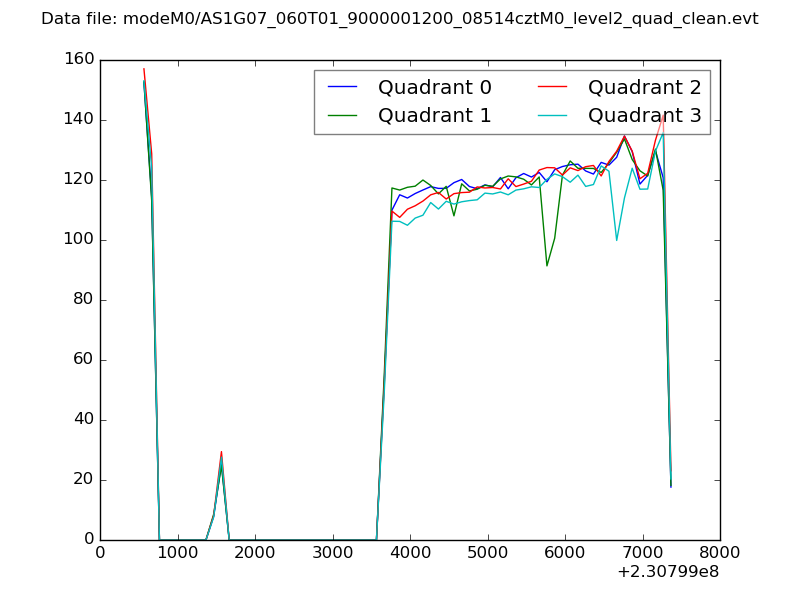 |
|
| Module-wise count rates for Quadrant A Data is divided into 100 sec bins |
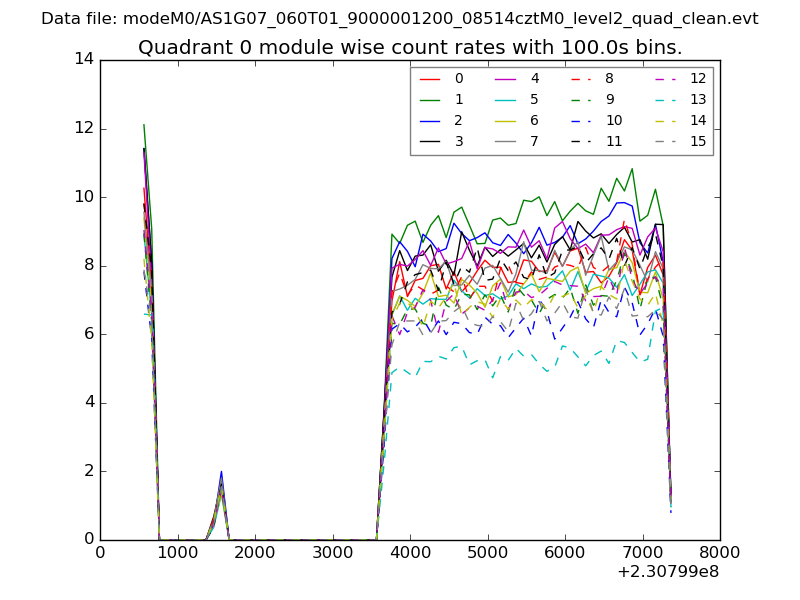 |
 |
| Module-wise count rates for Quadrant B Data is divided into 100 sec bins |
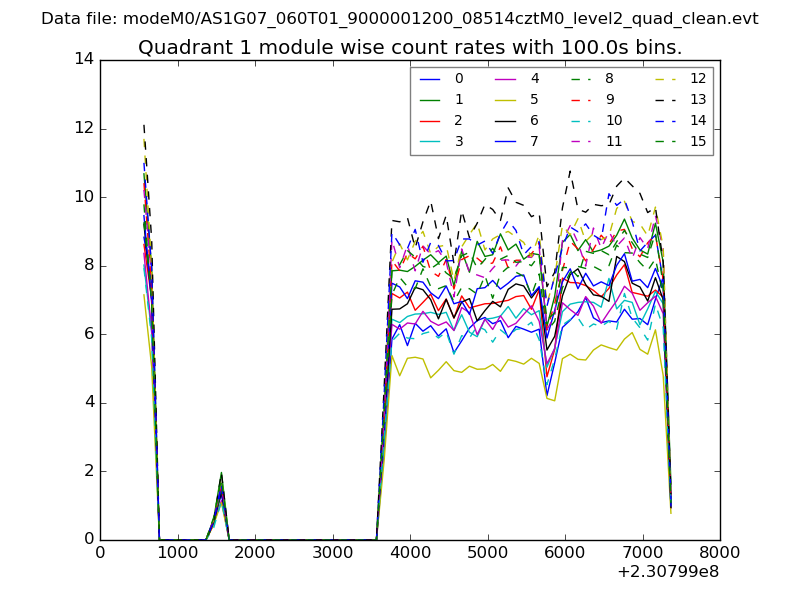 |
 |
| Module-wise count rates for Quadrant C Data is divided into 100 sec bins |
 |
 |
| Module-wise count rates for Quadrant D Data is divided into 100 sec bins |
 |
 |
| Parameter | Plot |
|---|---|
| CZT HV Monitor | 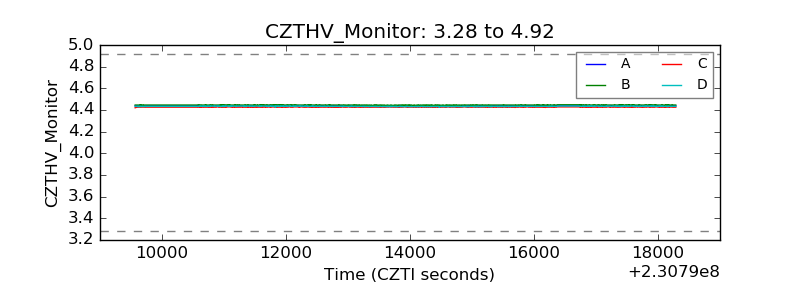 |
| D_VDD | 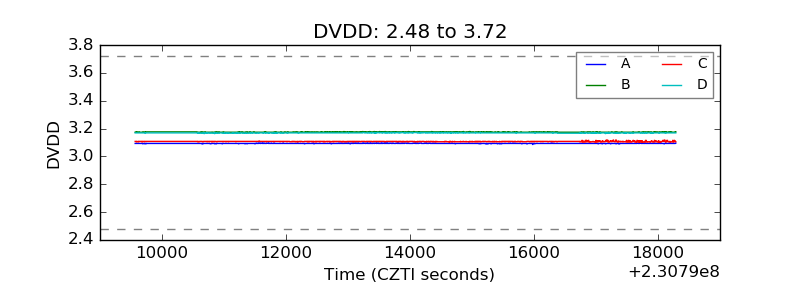 |
| Temperature 1 | 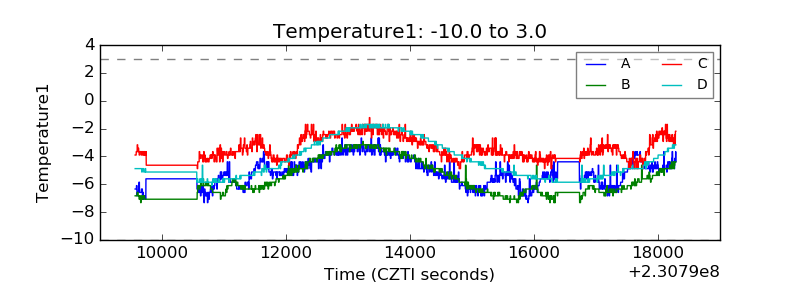 |
| Veto HV Monitor | 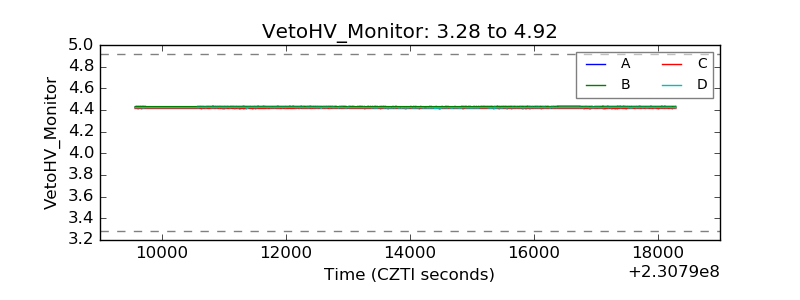 |
| Veto LLD | 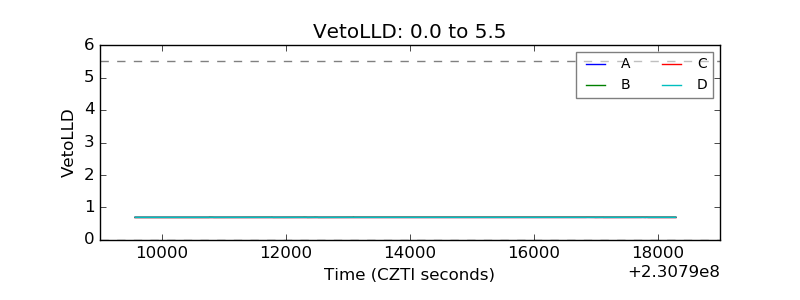 |
| Alpha Counter | 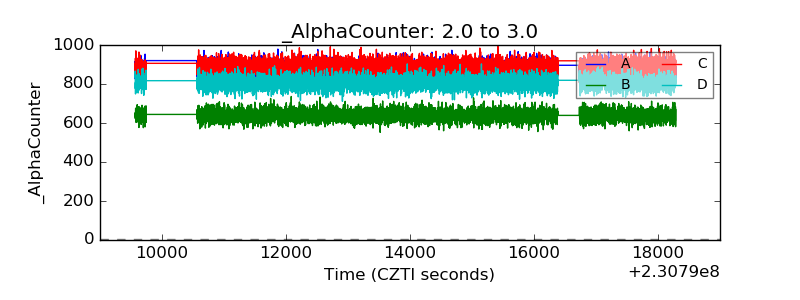 |
| _CPM_Rate | 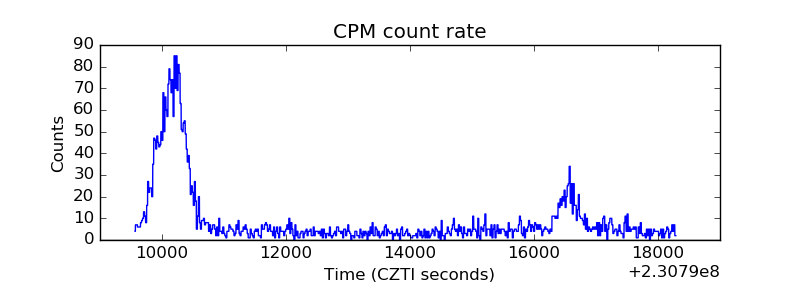 |
| CZT Counter |  |
| +2.5 Volts monitor |  |
| +5 Volts monitor |  |
| _ROLL_ROT | 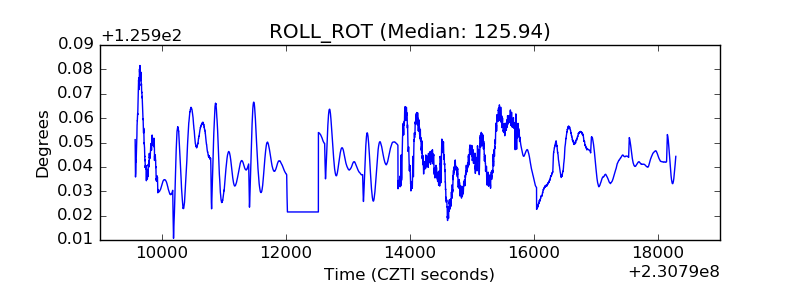 |
| _Roll_DEC | 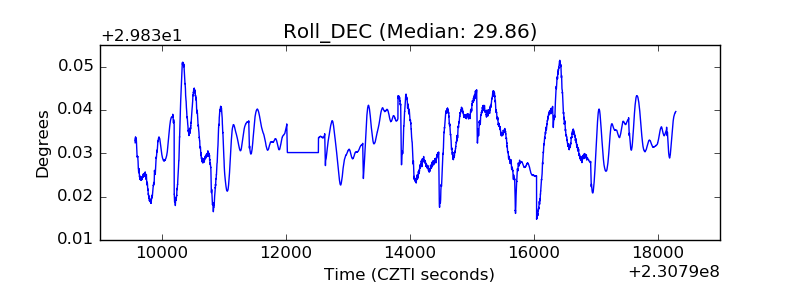 |
| _Roll_RA | 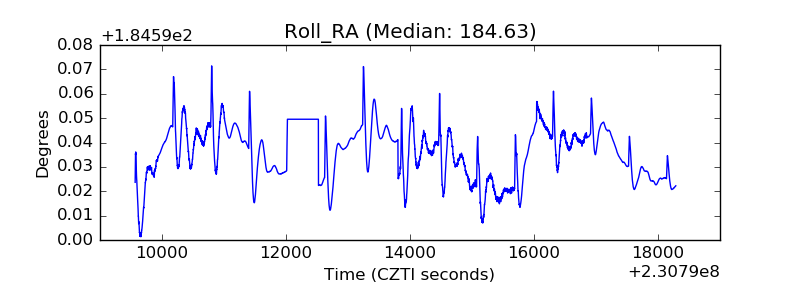 |
| Veto Counter | 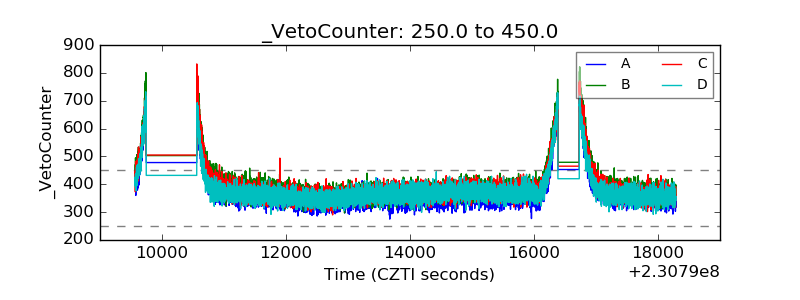 |