| Param | Original file | Final file |
|---|---|---|
| Filename | modeM0/AS1G07_060T01_9000001200_08515cztM0_level2.evt | modeM0/AS1G07_060T01_9000001200_08515cztM0_level2_quad_clean.evt |
| Size (bytes) | 541,402,560 | 85,737,600 |
| Size | 516.3 MB | 81.8 MB |
| Events in quadrant A | 3,906,077 | 515,641 |
| Events in quadrant B | 4,358,544 | 511,695 |
| Events in quadrant C | 3,736,937 | 511,638 |
| Events in quadrant D | 3,846,271 | 496,623 |
| Mode SS | |||
|---|---|---|---|
| Quadrant | BADHDUFLAG | Total packets | Discarded packets |
| A | 0 | 170 | 6 |
| B | 0 | 170 | 6 |
| C | 0 | 170 | 8 |
| D | 0 | 170 | 6 |
| Mode M0 | |||
|---|---|---|---|
| Quadrant | BADHDUFLAG | Total packets | Discarded packets |
| A | 0 | 18127 | 835 |
| B | 0 | 19318 | 1078 |
| C | 0 | 17696 | 813 |
| D | 0 | 18258 | 844 |
| Mode M9 | |||
|---|---|---|---|
| Quadrant | BADHDUFLAG | Total packets | Discarded packets |
| A | 0 | 5 | 0 |
| B | 0 | 5 | 0 |
| C | 0 | 5 | 0 |
| D | 0 | 5 | 0 |
| Quadrant | Total seconds | Saturated seconds | Saturation percentage |
|---|---|---|---|
| A | 8076 | 410 | 5.076771% |
| B | 8026 | 458 | 5.706454% |
| C | 8085 | 251 | 3.104515% |
| D | 8072 | 315 | 3.902379% |
Noise dominated data is calculated using 1-second bins in cleaned event files. If a bin has >2000 counts, and if more than 50% of those come from <1% of pixels, then it is considered to be noise-dominated and hence unusable.
| Quadrant | # 1 sec bins | Bins with >0 counts | Bins with >2000 counts | High rate bins dominated by noise | Noise dominated (total time) | Noise dominated (detector-on time) | Marked lightcurve |
|---|---|---|---|---|---|---|---|
| A | 8824 | 8291 | 17 | 17 | 0.19% | 0.21% | 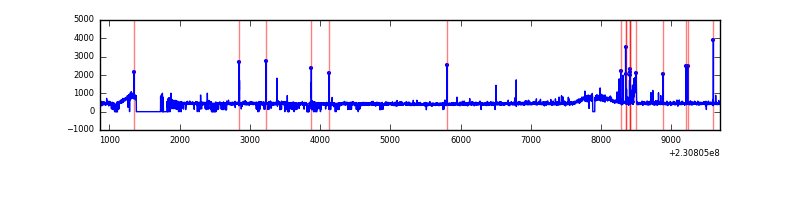 |
| B | 8824 | 8259 | 37 | 37 | 0.42% | 0.45% | 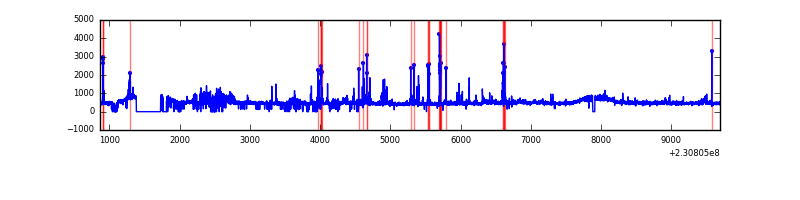 |
| C | 8824 | 8315 | 0 | 0 | 0.00% | 0.00% | 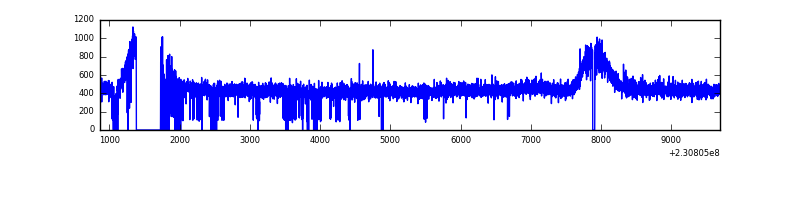 |
| D | 8824 | 8307 | 47 | 47 | 0.53% | 0.57% | 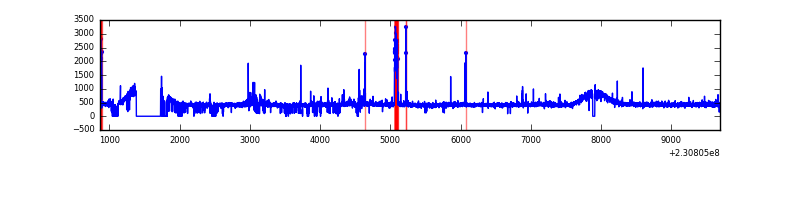 |
Top three noisy pixels from each quadrant. If the there are fewer than three noisy pixels in the level2.evt file, extra rows are filled as -1
| Pixel properties | Quadrant properties | ||||||
|---|---|---|---|---|---|---|---|
| Quadrant | DetID | PixID | Counts | Sigma | Mean | Median | Sigma |
| A | 5 | 16 | 147153 | 724.41 | 973 | 947 | 201.8 |
| A | 12 | 194 | 8897 | 39.39 | 973 | 947 | 201.8 |
| A | 0 | 226 | 8861 | 39.21 | 973 | 947 | 201.8 |
| B | 5 | 255 | 261746 | 1369.3 | 969 | 943 | 190.5 |
| B | 10 | 16 | 252862 | 1322.66 | 969 | 943 | 190.5 |
| B | 0 | 214 | 26757 | 135.53 | 969 | 943 | 190.5 |
| C | 8 | 128 | 16049 | 67.9 | 950 | 952 | 222.3 |
| C | 13 | 61 | 7282 | 28.47 | 950 | 952 | 222.3 |
| C | 8 | 112 | 7178 | 28.0 | 950 | 952 | 222.3 |
| D | 7 | 71 | 126484 | 523.4 | 941 | 916 | 239.9 |
| D | 1 | 52 | 50602 | 207.1 | 941 | 916 | 239.9 |
| D | 8 | 230 | 33543 | 136.0 | 941 | 916 | 239.9 |
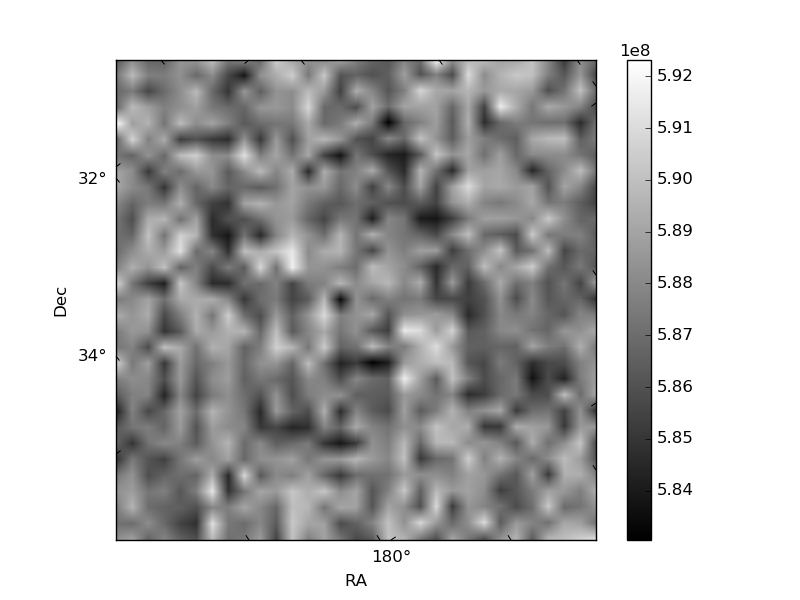
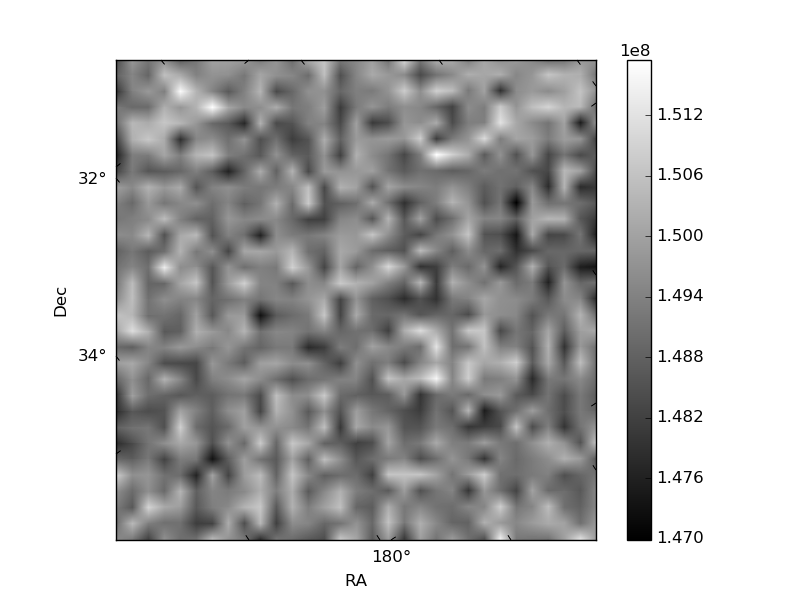
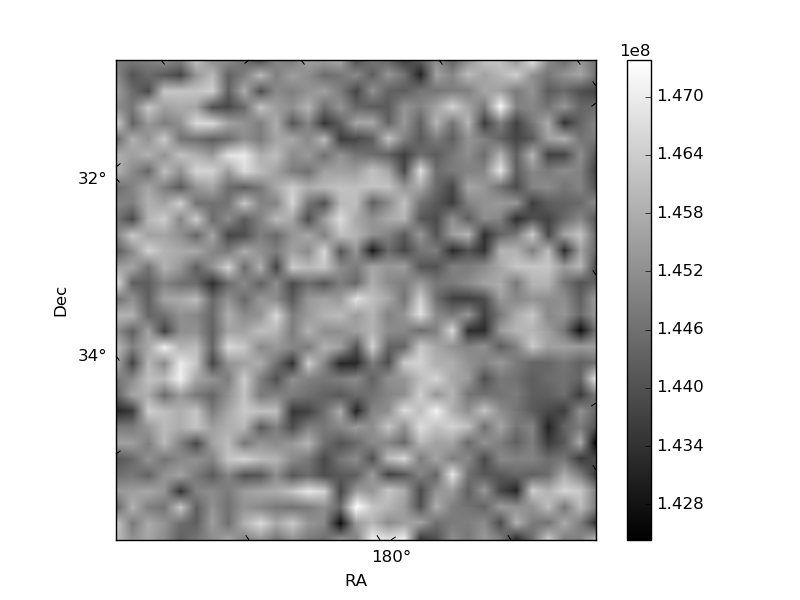
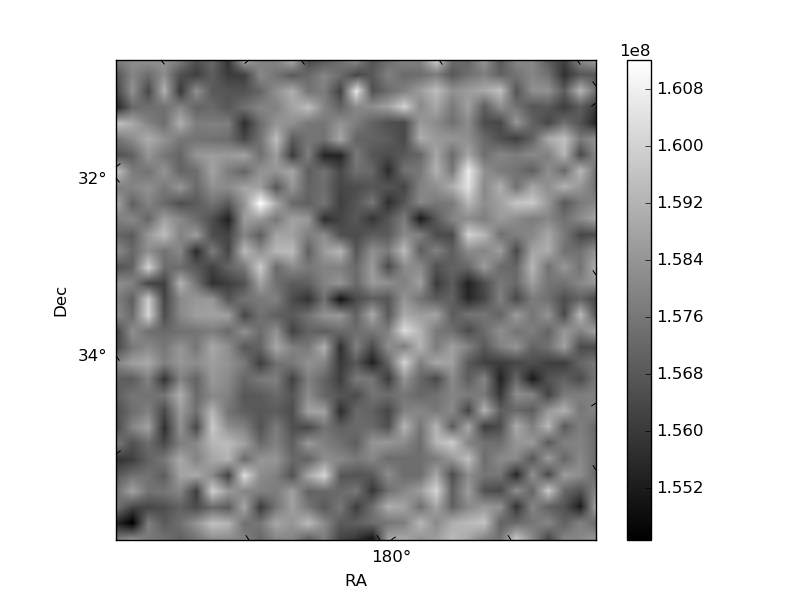
Histogram calculated using DETX and DETY for each event in the final _common_clean file
| Quadrant A | 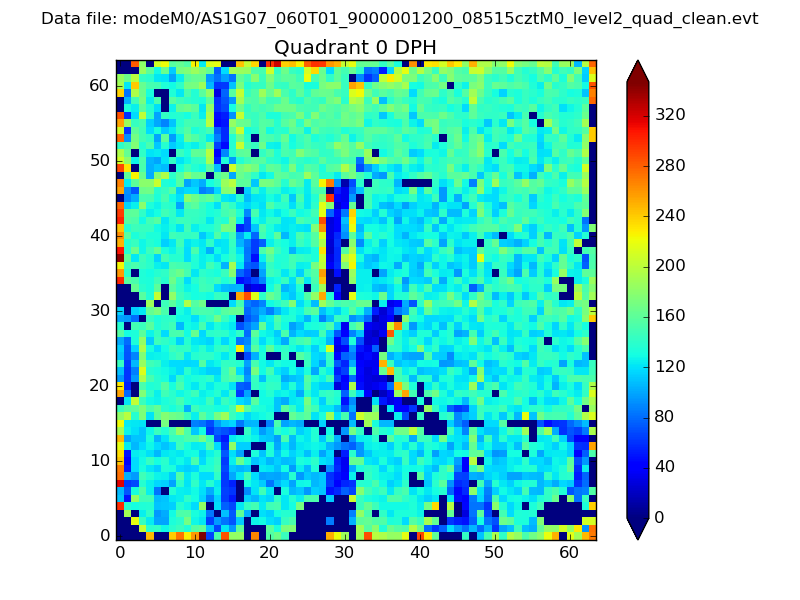 |
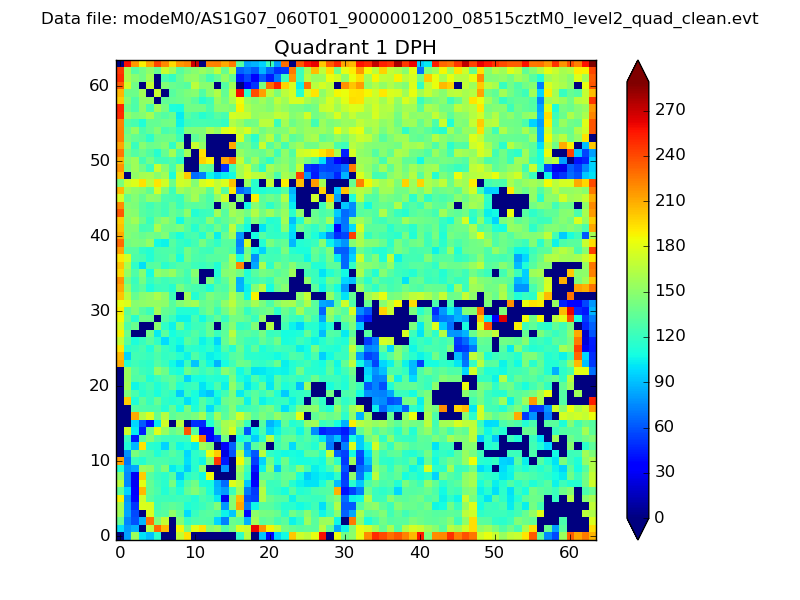 |
Quadrant B |
|---|---|---|---|
| Quadrant D | 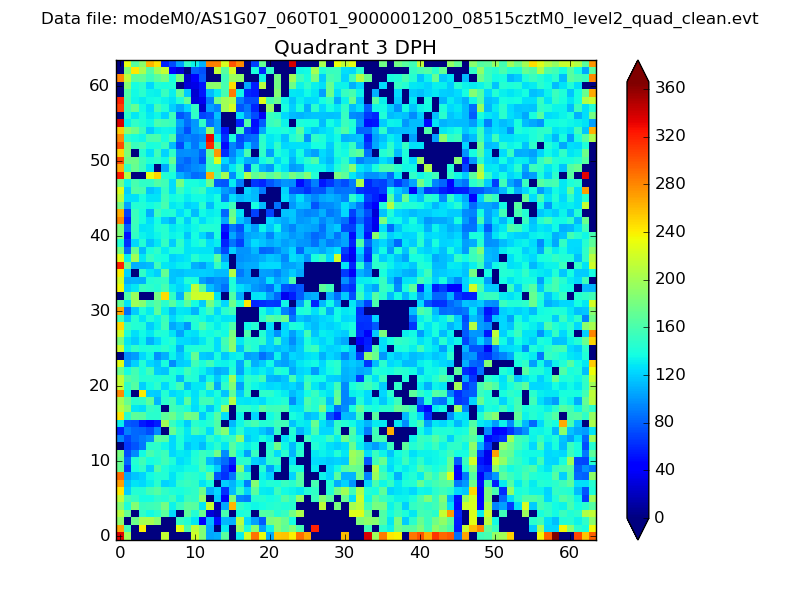 |
 |
Quadrant C |
| Plot type | Count rate plots | Images |
|---|---|---|
| Comparison with Poisson distribution Blue bars denote a histogram of data divided into 1 sec bins. Red curve is a Poisson curve with rate = median count rate of data. |
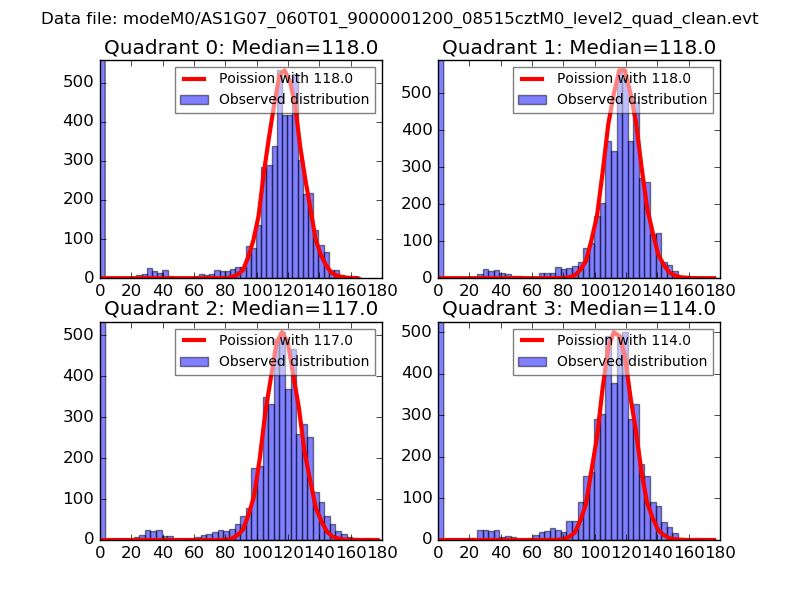 |
 |
| Quadrant-wise count rates Data is divided into 100 sec bins |
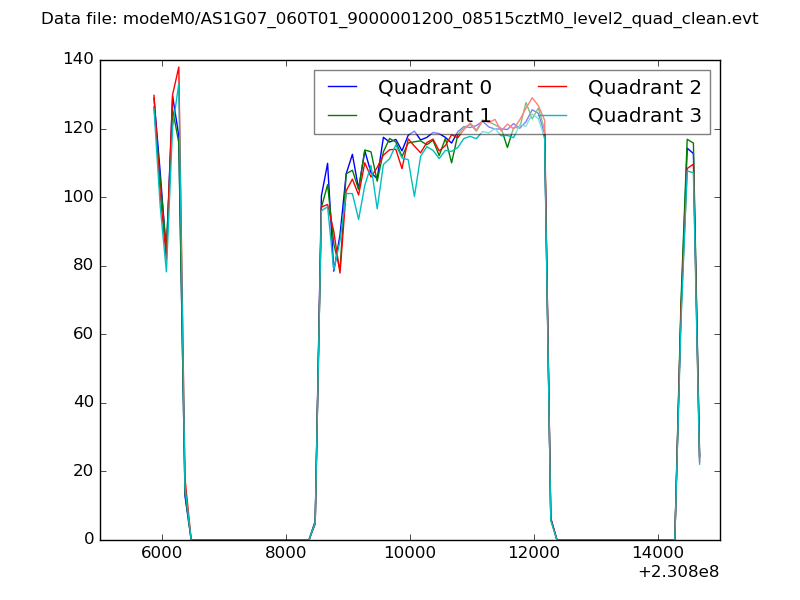 |
|
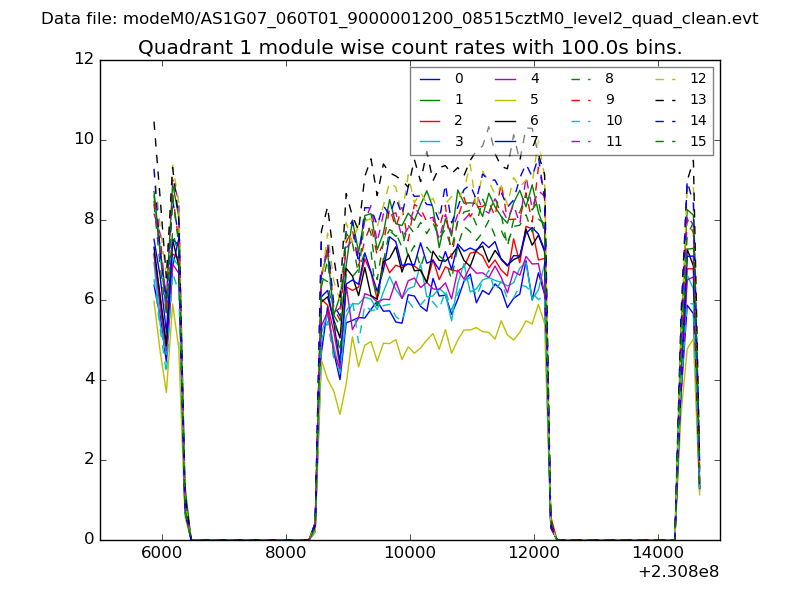
| Module-wise count rates for Quadrant A Data is divided into 100 sec bins |
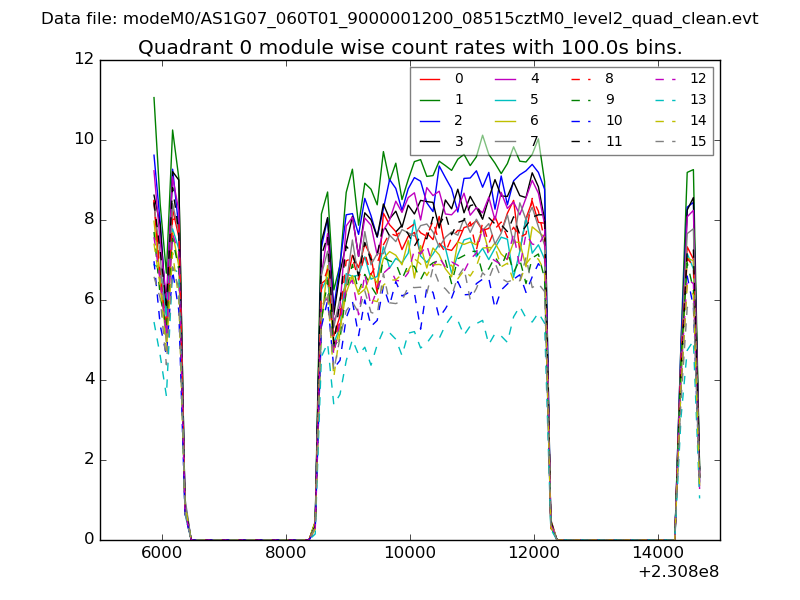 |
 |
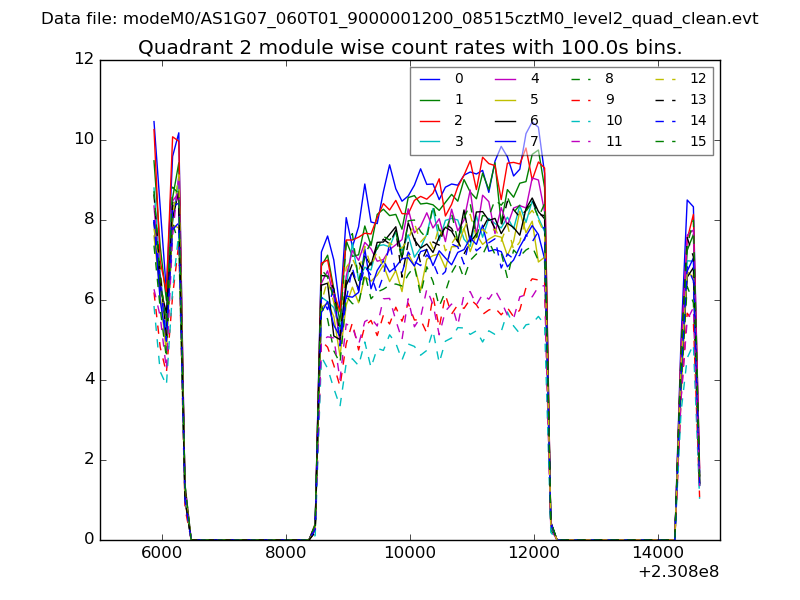
| Module-wise count rates for Quadrant B Data is divided into 100 sec bins |
 |
 |
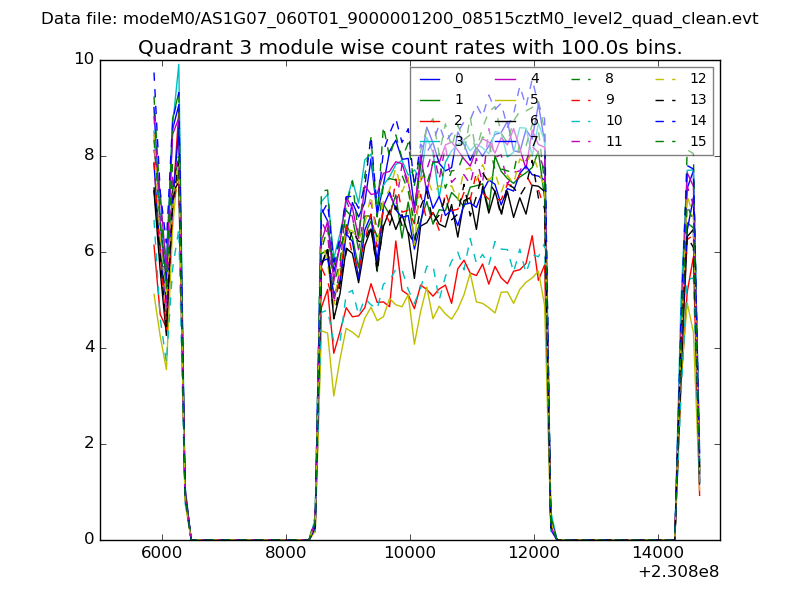
| Module-wise count rates for Quadrant C Data is divided into 100 sec bins |
 |
 |
| Module-wise count rates for Quadrant D Data is divided into 100 sec bins |
 |
 |
| Parameter | Plot |
|---|---|
| CZT HV Monitor | 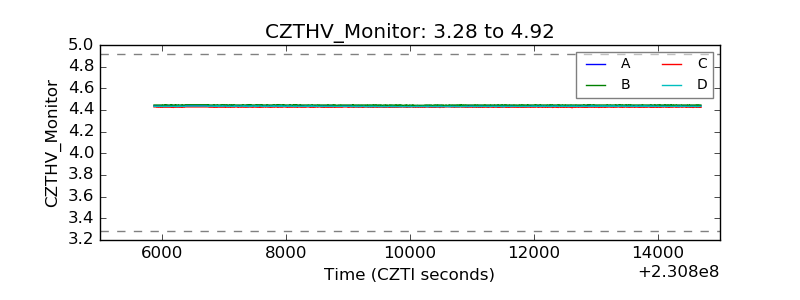 |
| D_VDD |  |
| Temperature 1 | 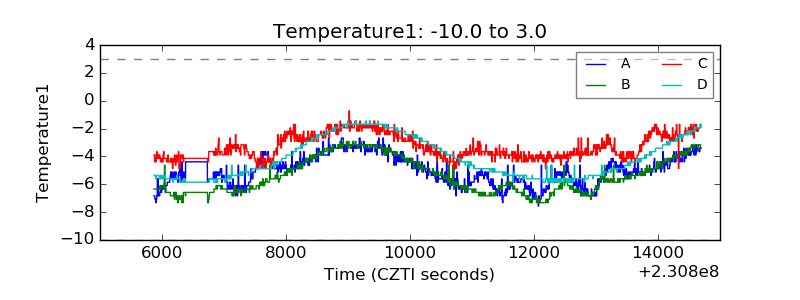 |
| Veto HV Monitor | 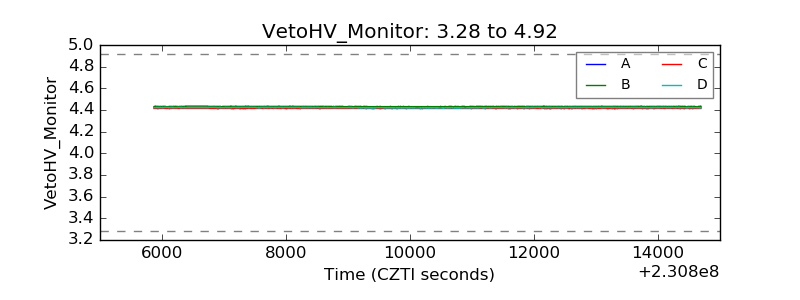 |
| Veto LLD | 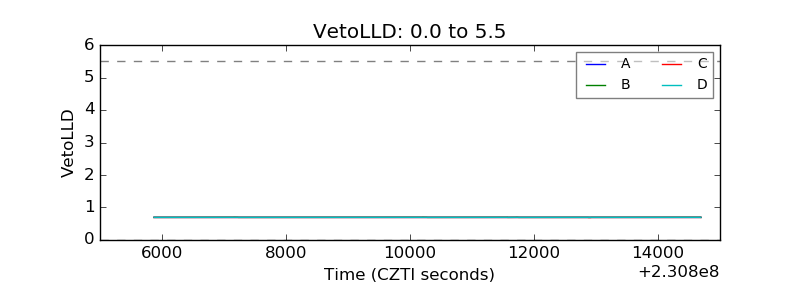 |
| Alpha Counter | 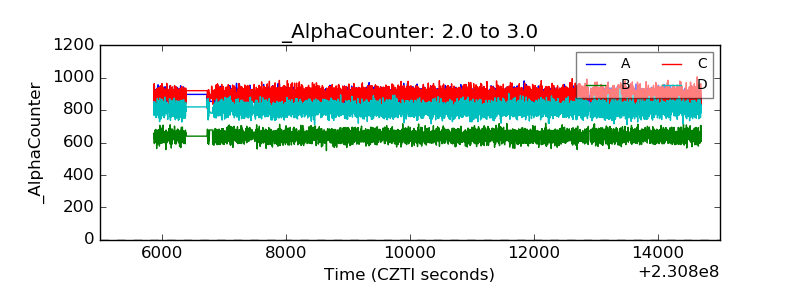 |
| _CPM_Rate | 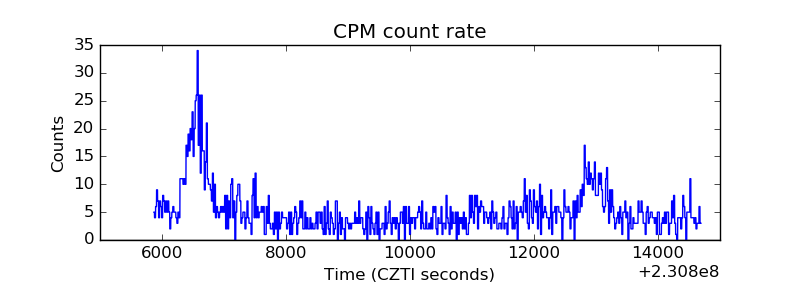 |
| CZT Counter | 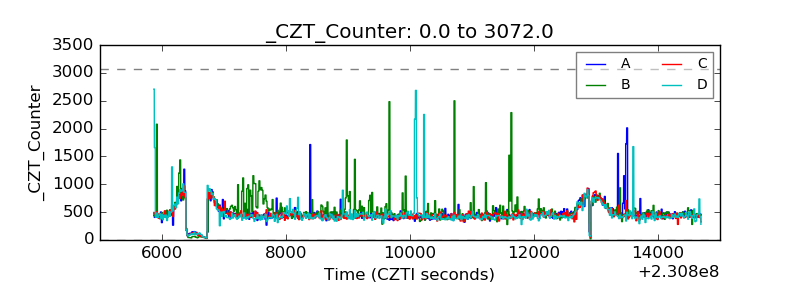 |
| +2.5 Volts monitor |  |
| +5 Volts monitor |  |
| _ROLL_ROT | 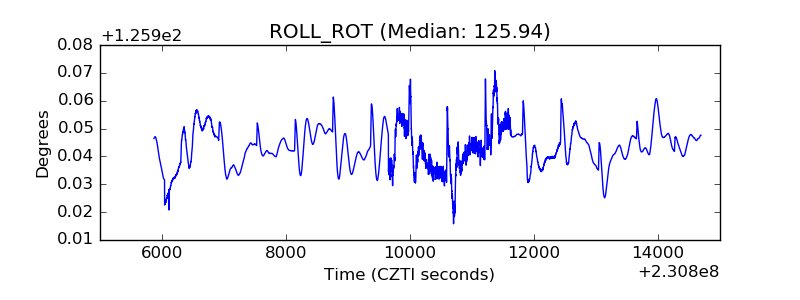 |
| _Roll_DEC | 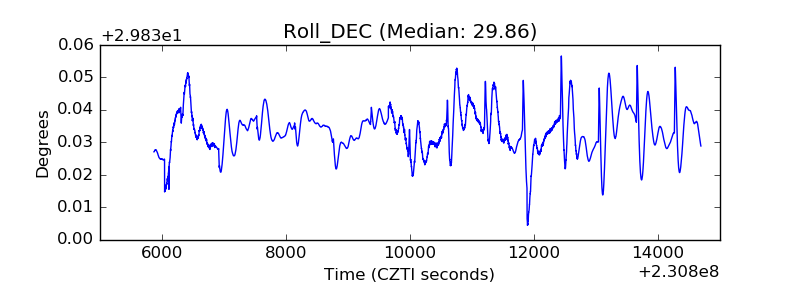 |
| _Roll_RA | 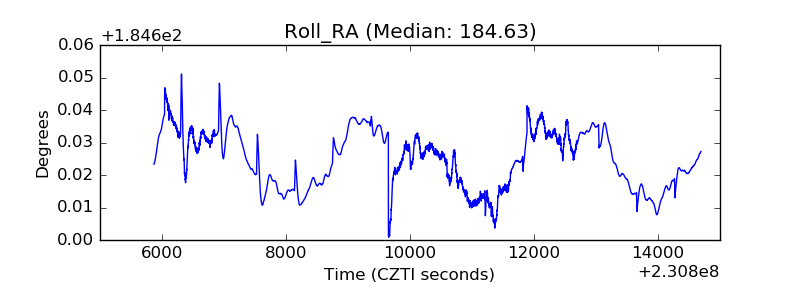 |
| Veto Counter | 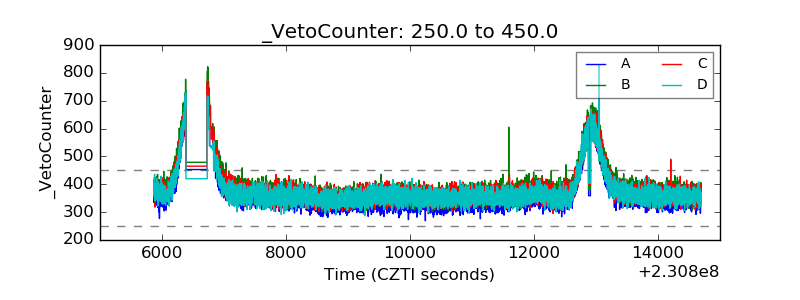 |