| Param | Original file | Final file |
|---|---|---|
| Filename | modeM0/AS1G07_060T01_9000001200_08516cztM0_level2.evt | modeM0/AS1G07_060T01_9000001200_08516cztM0_level2_quad_clean.evt |
| Size (bytes) | 520,185,600 | 86,855,040 |
| Size | 496.1 MB | 82.8 MB |
| Events in quadrant A | 3,850,421 | 525,595 |
| Events in quadrant B | 4,097,982 | 525,688 |
| Events in quadrant C | 3,628,208 | 518,582 |
| Events in quadrant D | 3,634,390 | 505,315 |
| Mode SS | |||
|---|---|---|---|
| Quadrant | BADHDUFLAG | Total packets | Discarded packets |
| A | 0 | 162 | 0 |
| B | 0 | 162 | 0 |
| C | 0 | 162 | 0 |
| D | 0 | 162 | 0 |
| Mode M0 | |||
|---|---|---|---|
| Quadrant | BADHDUFLAG | Total packets | Discarded packets |
| A | 0 | 17058 | 24 |
| B | 0 | 17456 | 15 |
| C | 0 | 16535 | 20 |
| D | 0 | 16718 | 17 |
| Mode M9 | |||
|---|---|---|---|
| Quadrant | BADHDUFLAG | Total packets | Discarded packets |
| A | 0 | 1 | 0 |
| B | 0 | 1 | 0 |
| C | 0 | 1 | 0 |
| D | 0 | 1 | 0 |
| Quadrant | Total seconds | Saturated seconds | Saturation percentage |
|---|---|---|---|
| A | 7978 | 358 | 4.487340% |
| B | 7983 | 377 | 4.722535% |
| C | 7979 | 230 | 2.882567% |
| D | 7981 | 242 | 3.032201% |
Noise dominated data is calculated using 1-second bins in cleaned event files. If a bin has >2000 counts, and if more than 50% of those come from <1% of pixels, then it is considered to be noise-dominated and hence unusable.
| Quadrant | # 1 sec bins | Bins with >0 counts | Bins with >2000 counts | High rate bins dominated by noise | Noise dominated (total time) | Noise dominated (detector-on time) | Marked lightcurve |
|---|---|---|---|---|---|---|---|
| A | 8123 | 7985 | 30 | 30 | 0.37% | 0.38% | 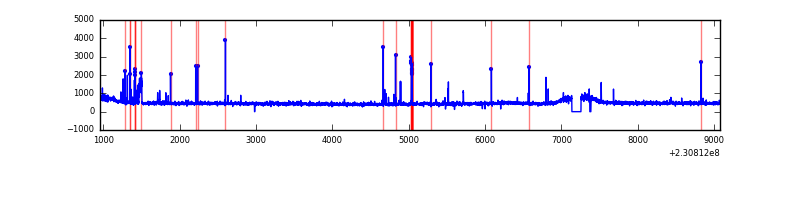 |
| B | 8123 | 7990 | 47 | 47 | 0.58% | 0.59% | 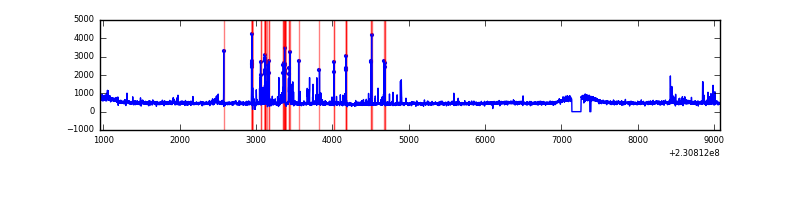 |
| C | 8123 | 7988 | 0 | 0 | 0.00% | 0.00% | 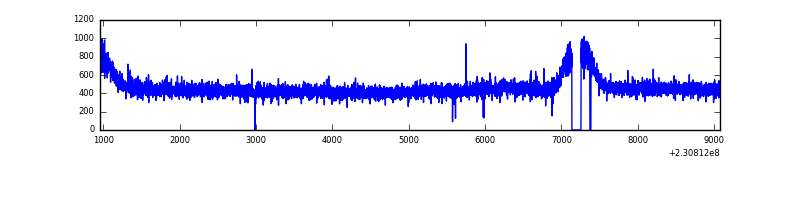 |
| D | 8123 | 7989 | 4 | 4 | 0.05% | 0.05% | 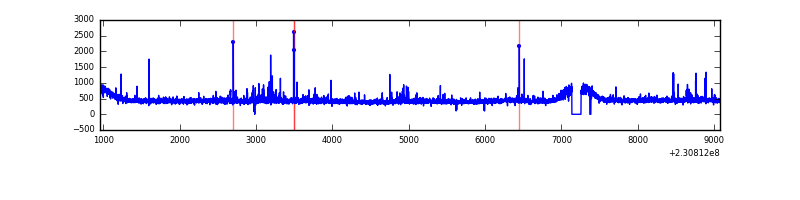 |
Top three noisy pixels from each quadrant. If the there are fewer than three noisy pixels in the level2.evt file, extra rows are filled as -1
| Pixel properties | Quadrant properties | ||||||
|---|---|---|---|---|---|---|---|
| Quadrant | DetID | PixID | Counts | Sigma | Mean | Median | Sigma |
| A | 5 | 16 | 149227 | 755.45 | 953 | 931 | 196.3 |
| A | 15 | 174 | 32060 | 158.58 | 953 | 931 | 196.3 |
| A | 0 | 226 | 8934 | 40.77 | 953 | 931 | 196.3 |
| B | 10 | 16 | 278675 | 1498.36 | 953 | 926 | 185.4 |
| B | 5 | 255 | 31301 | 163.86 | 953 | 926 | 185.4 |
| B | 0 | 214 | 24368 | 126.46 | 953 | 926 | 185.4 |
| C | 13 | 61 | 7021 | 28.02 | 929 | 930 | 217.3 |
| C | 8 | 222 | 3262 | 10.73 | 929 | 930 | 217.3 |
| C | 3 | 202 | 2364 | 6.6 | 929 | 930 | 217.3 |
| D | 1 | 52 | 59689 | 262.34 | 921 | 899 | 224.1 |
| D | 9 | 64 | 31968 | 138.64 | 921 | 899 | 224.1 |
| D | 2 | 234 | 29487 | 127.57 | 921 | 899 | 224.1 |
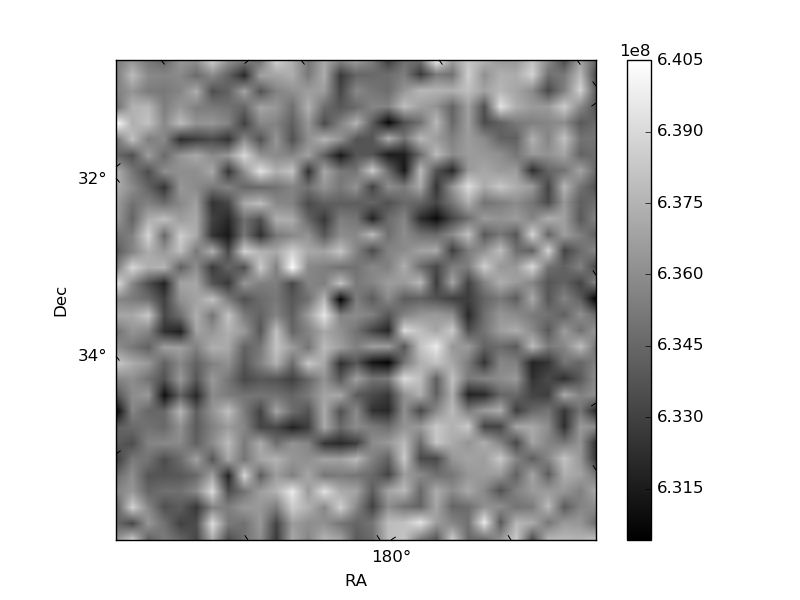
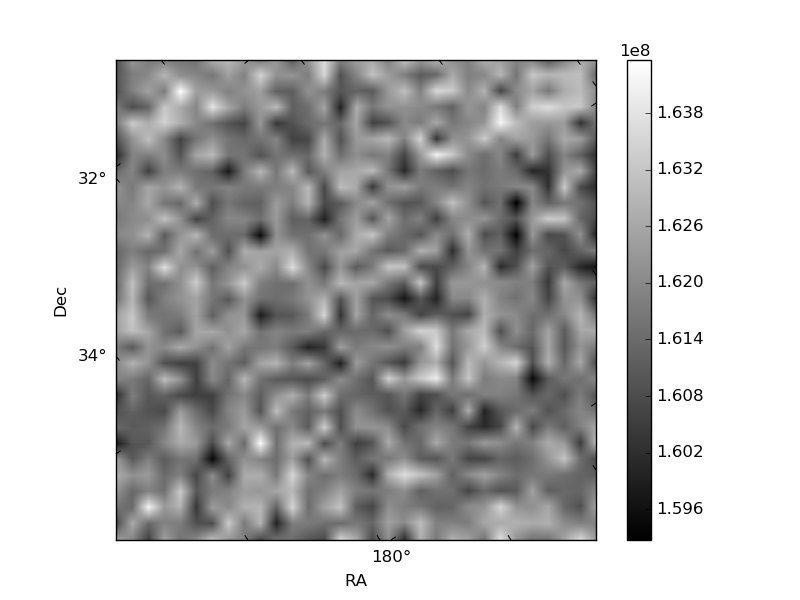
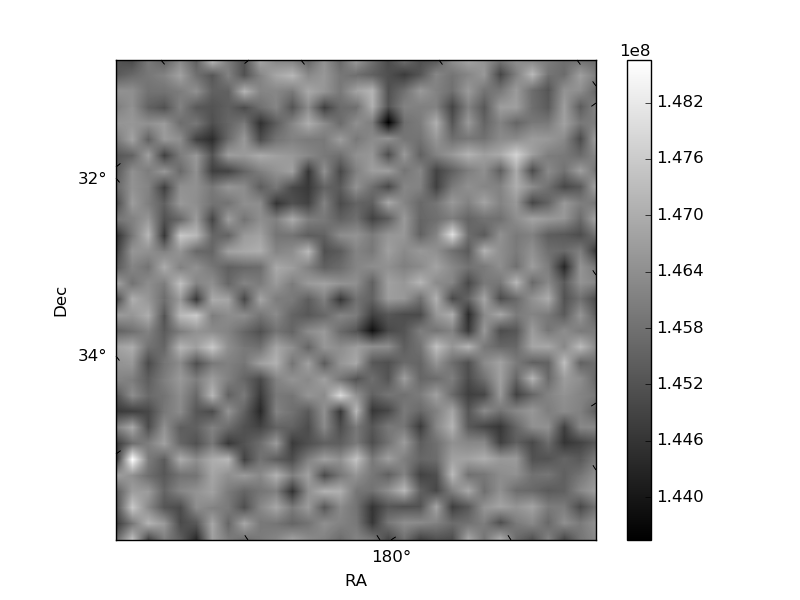
Histogram calculated using DETX and DETY for each event in the final _common_clean file
| Quadrant A | 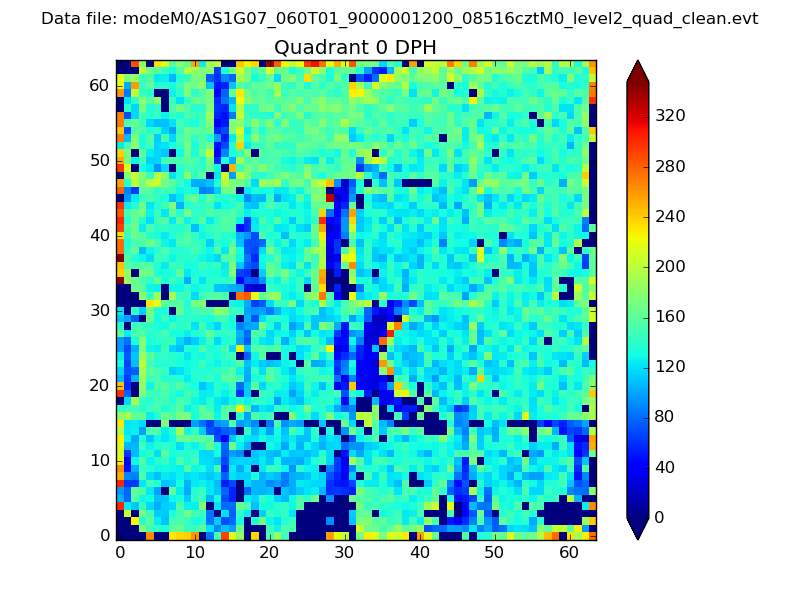 |
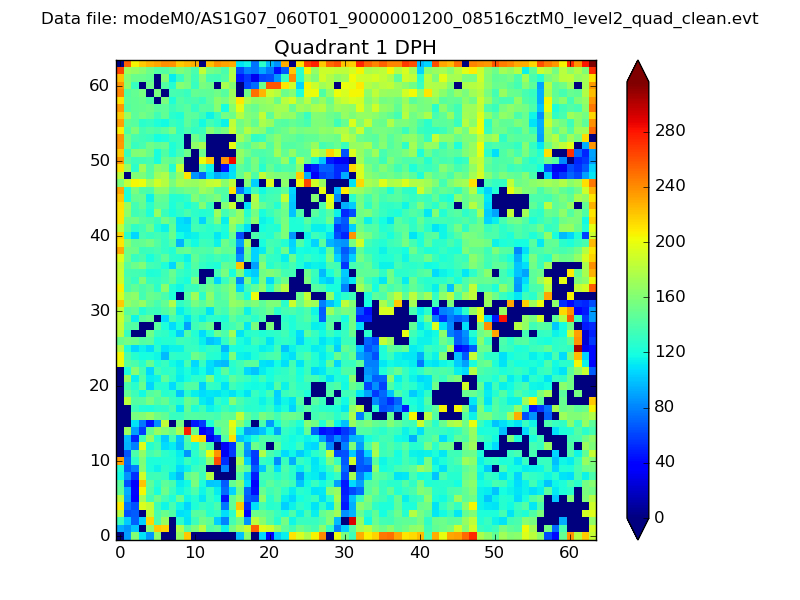 |
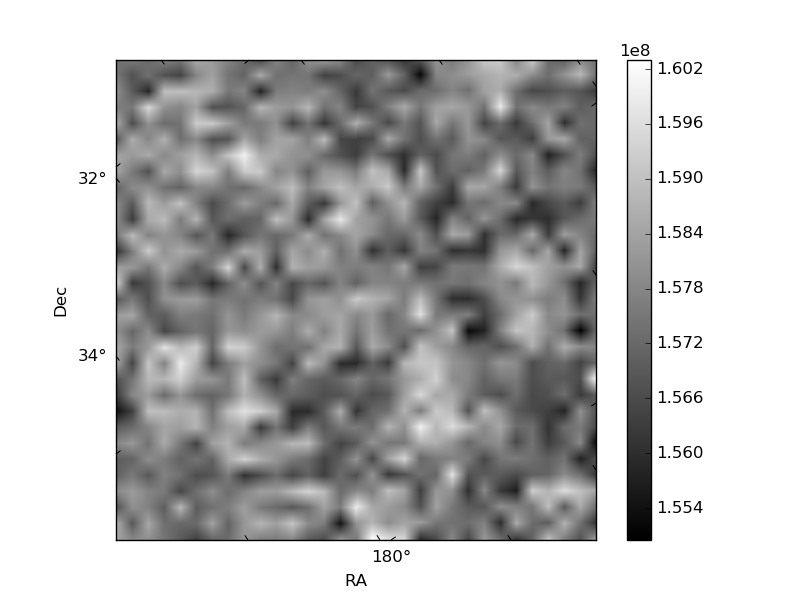
Quadrant B |
|---|---|---|---|
| Quadrant D | 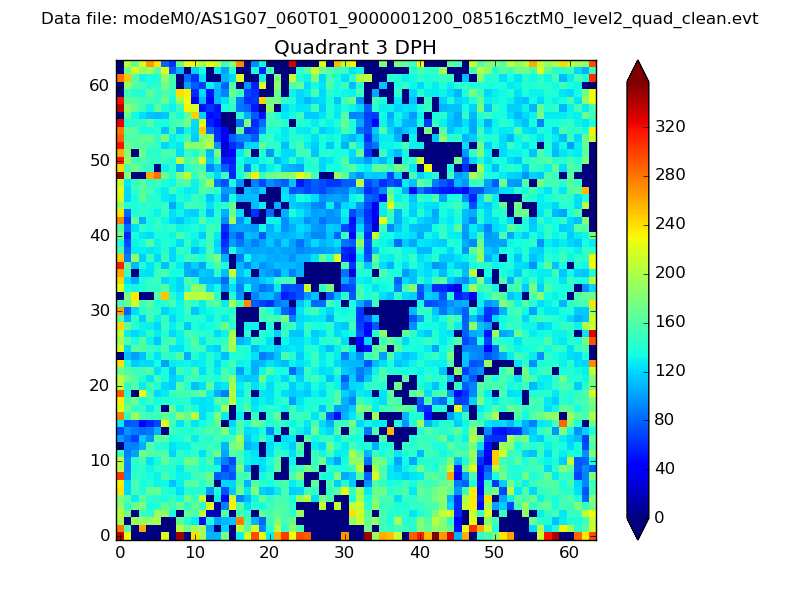 |
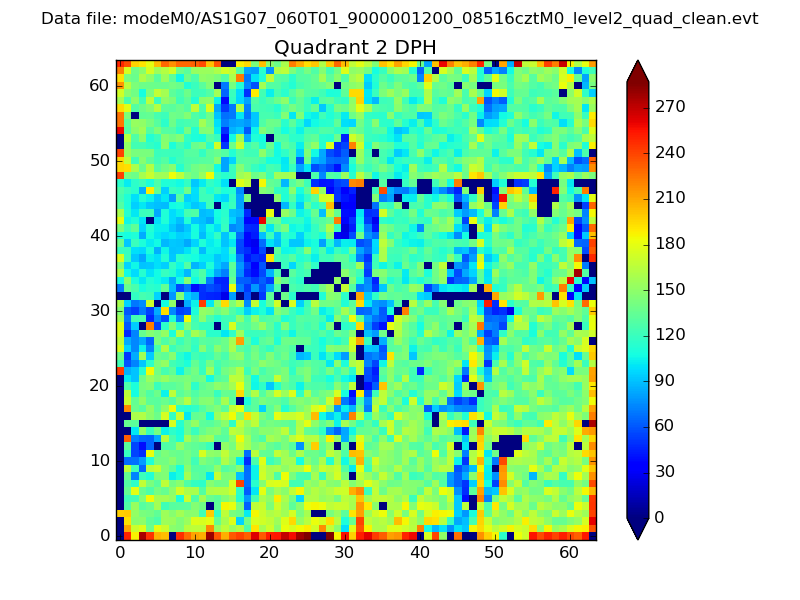 |
Quadrant C |
| Plot type | Count rate plots | Images |
|---|---|---|
| Comparison with Poisson distribution Blue bars denote a histogram of data divided into 1 sec bins. Red curve is a Poisson curve with rate = median count rate of data. |
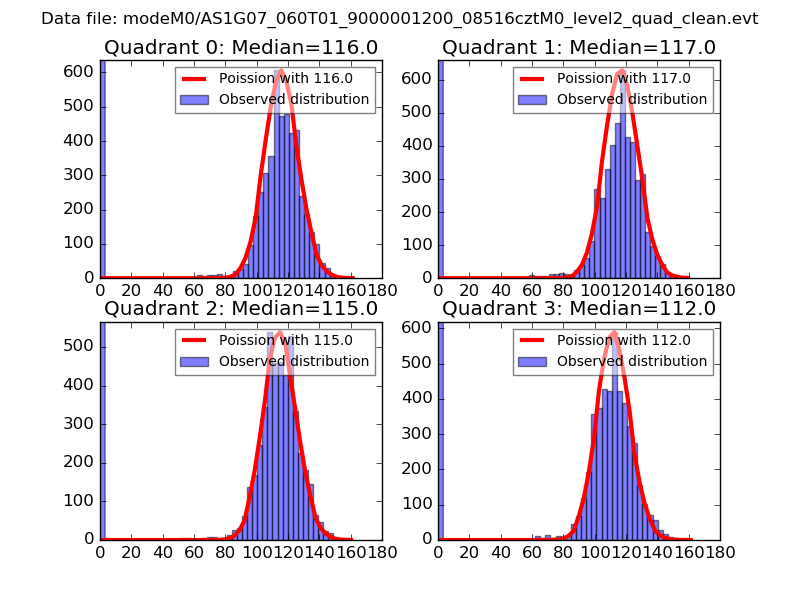 |
 |
| Quadrant-wise count rates Data is divided into 100 sec bins |
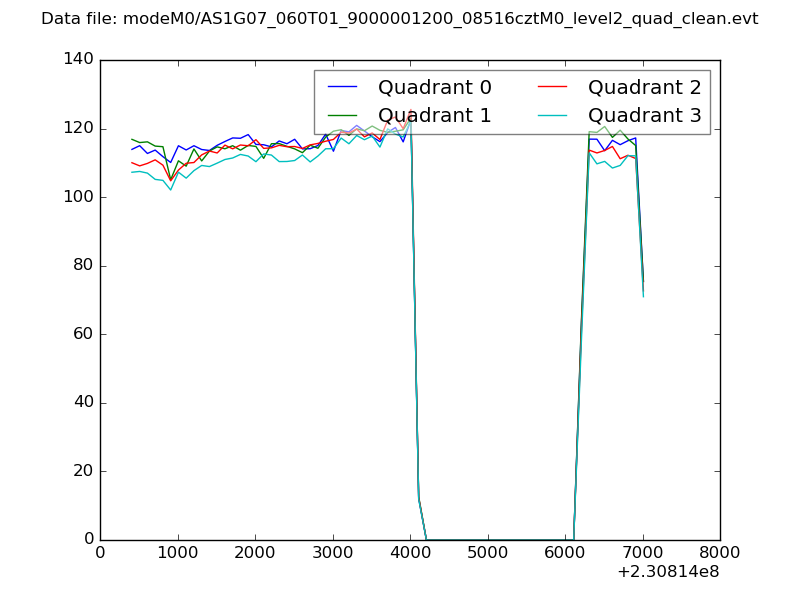 |
|
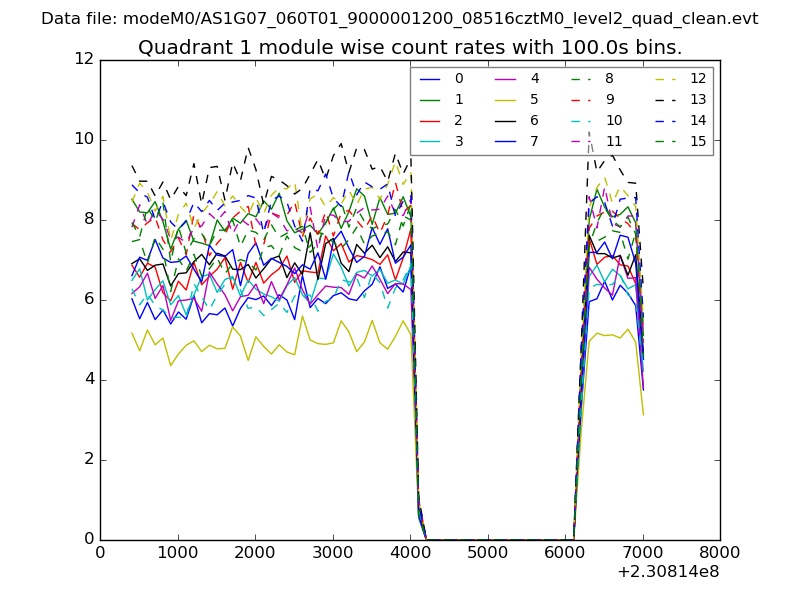
| Module-wise count rates for Quadrant A Data is divided into 100 sec bins |
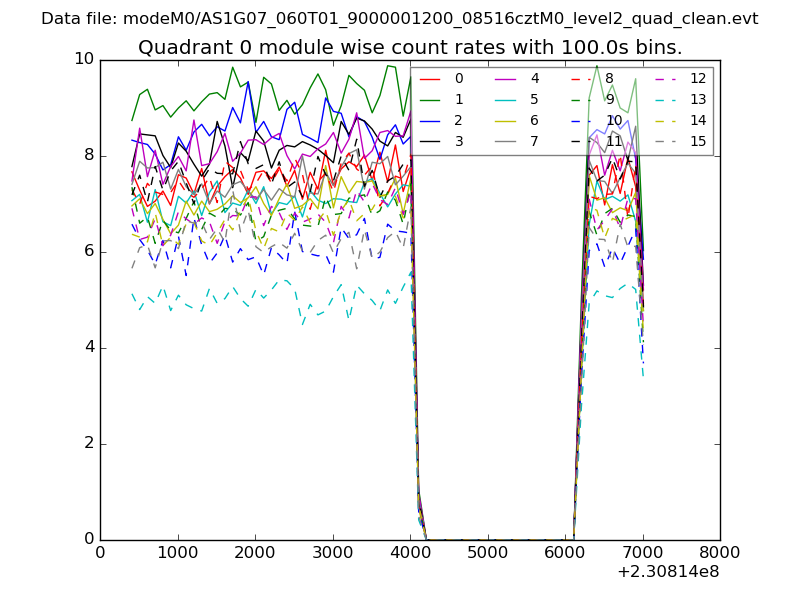 |
 |
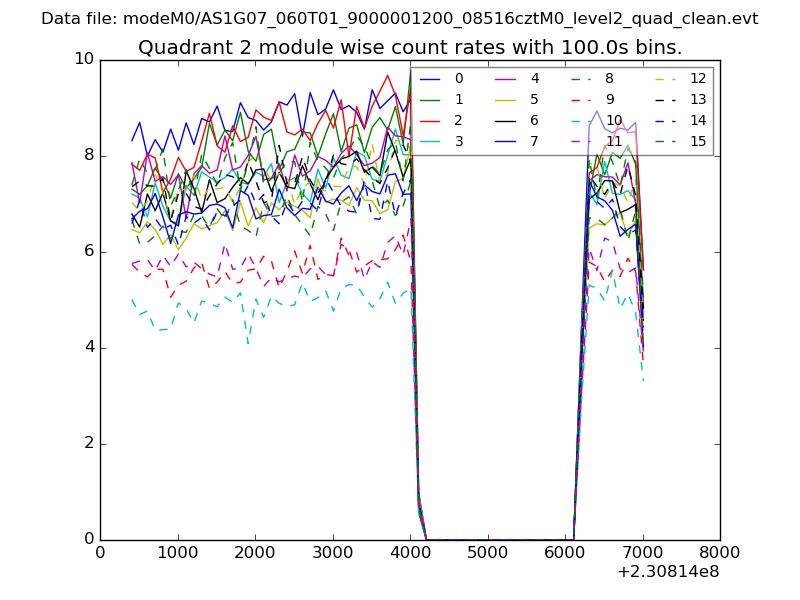
| Module-wise count rates for Quadrant B Data is divided into 100 sec bins |
 |
 |
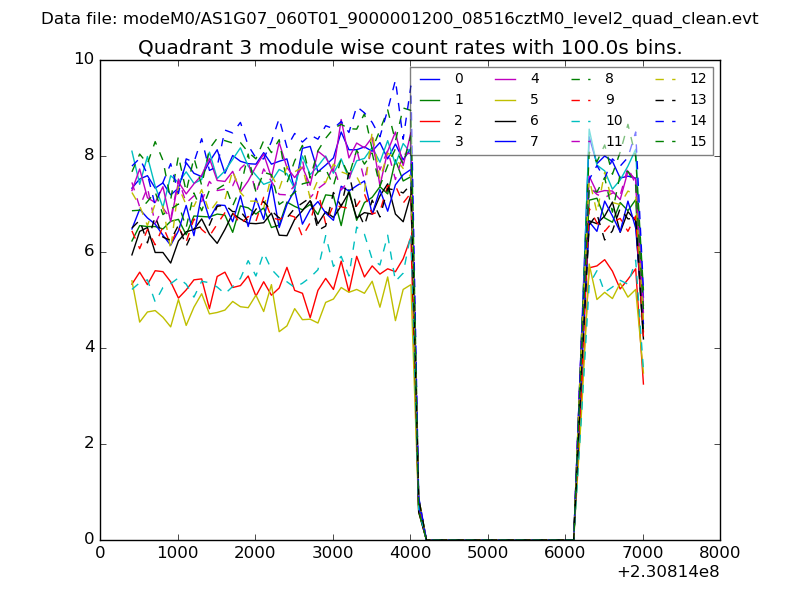
| Module-wise count rates for Quadrant C Data is divided into 100 sec bins |
 |
 |
| Module-wise count rates for Quadrant D Data is divided into 100 sec bins |
 |
 |
| Parameter | Plot |
|---|---|
| CZT HV Monitor | 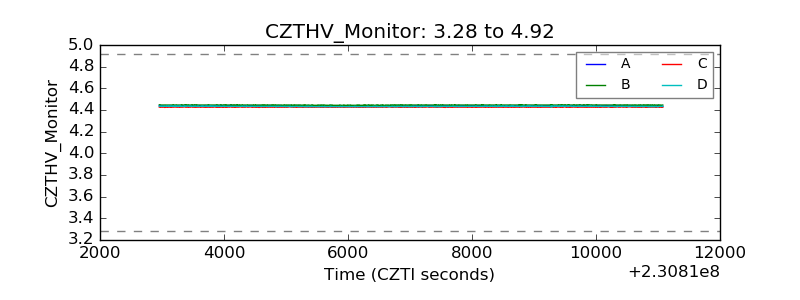 |
| D_VDD | 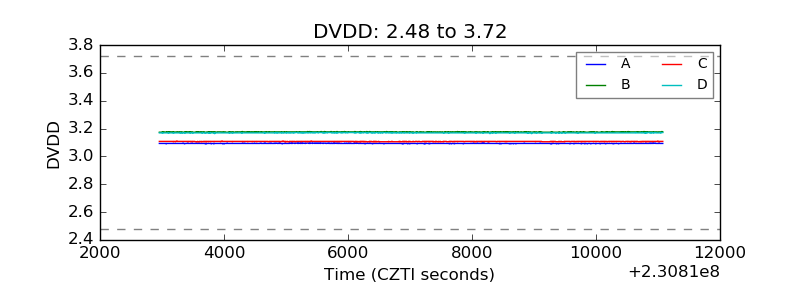 |
| Temperature 1 | 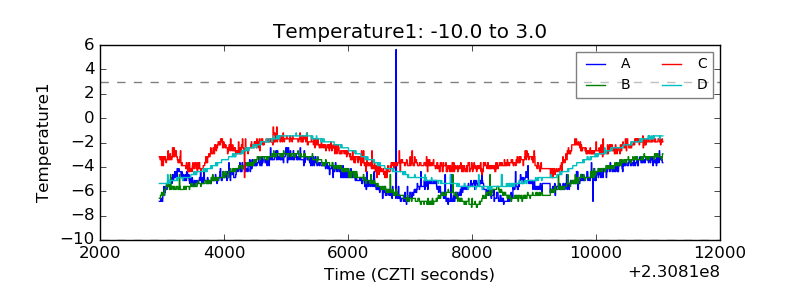 |
| Veto HV Monitor | 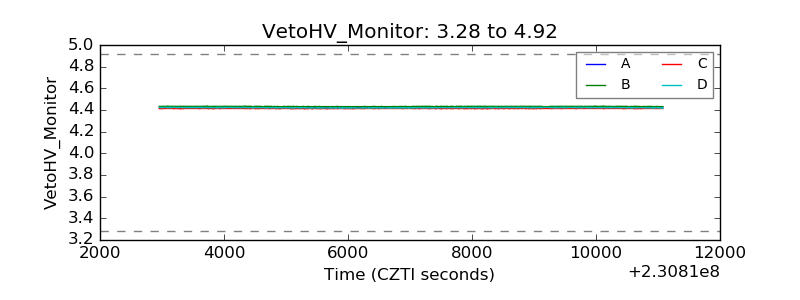 |
| Veto LLD | 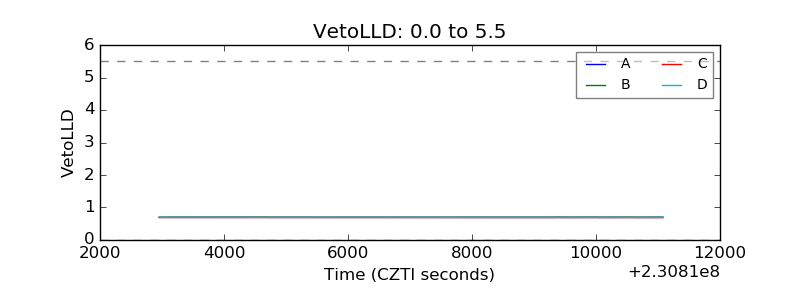 |
| Alpha Counter | 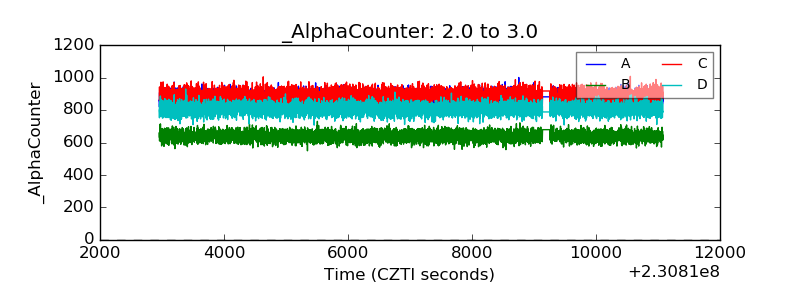 |
| _CPM_Rate | 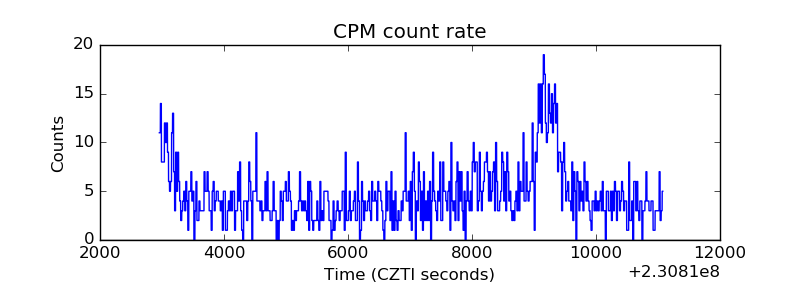 |
| CZT Counter | 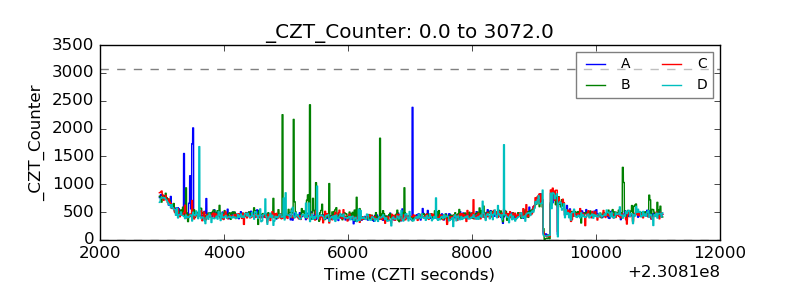 |
| +2.5 Volts monitor | 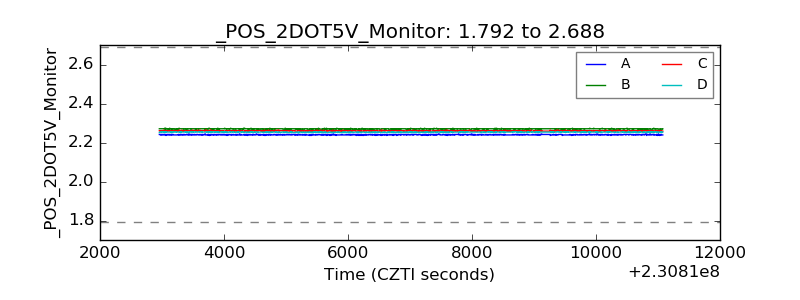 |
| +5 Volts monitor |  |
| _ROLL_ROT | 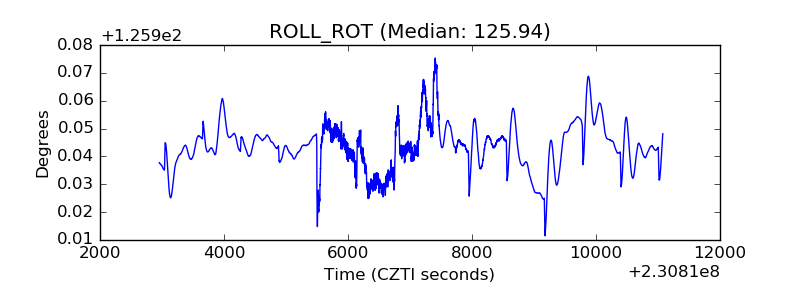 |
| _Roll_DEC | 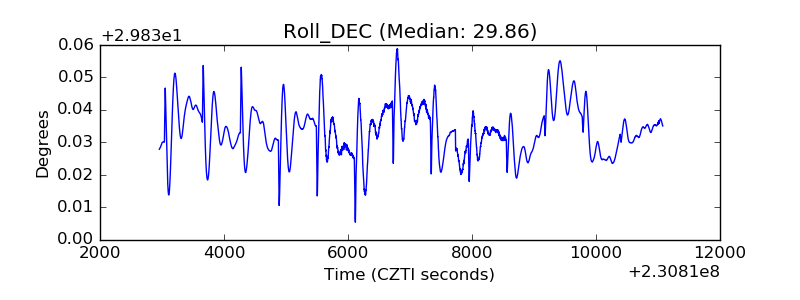 |
| _Roll_RA | 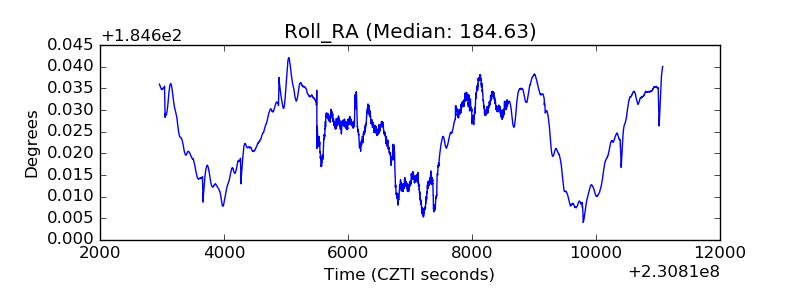 |
| Veto Counter | 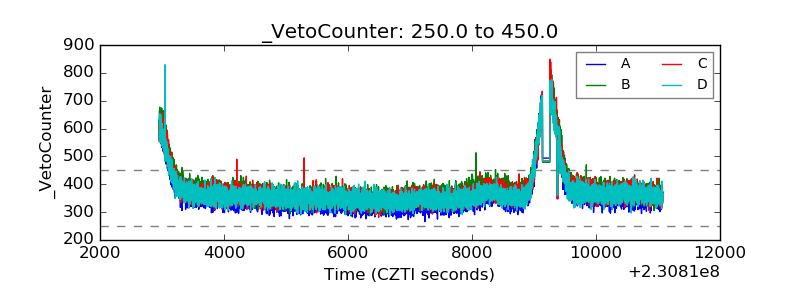 |