| Param | Original file | Final file |
|---|---|---|
| Filename | modeM0/AS1G07_060T01_9000001200_08519cztM0_level2.evt | modeM0/AS1G07_060T01_9000001200_08519cztM0_level2_quad_clean.evt |
| Size (bytes) | 1,240,280,640 | 234,578,880 |
| Size | 1.2 GB | 223.7 MB |
| Events in quadrant A | 8,431,304 | 1,476,584 |
| Events in quadrant B | 9,664,791 | 1,472,829 |
| Events in quadrant C | 8,139,241 | 1,470,636 |
| Events in quadrant D | 10,071,211 | 1,406,131 |
| Mode SS | |||
|---|---|---|---|
| Quadrant | BADHDUFLAG | Total packets | Discarded packets |
| A | 0 | 380 | 0 |
| B | 0 | 380 | 0 |
| C | 0 | 380 | 0 |
| D | 0 | 380 | 0 |
| Mode M0 | |||
|---|---|---|---|
| Quadrant | BADHDUFLAG | Total packets | Discarded packets |
| A | 0 | 38224 | 5 |
| B | 0 | 41279 | 4 |
| C | 0 | 37693 | 4 |
| D | 0 | 43359 | 4 |
| Mode M9 | |||
|---|---|---|---|
| Quadrant | BADHDUFLAG | Total packets | Discarded packets |
| A | 0 | 17 | 0 |
| B | 0 | 17 | 0 |
| C | 0 | 17 | 0 |
| D | 0 | 17 | 0 |
| Quadrant | Total seconds | Saturated seconds | Saturation percentage |
|---|---|---|---|
| A | 18543 | 235 | 1.267325% |
| B | 18543 | 476 | 2.567006% |
| C | 18543 | 149 | 0.803538% |
| D | 18543 | 484 | 2.610149% |
Noise dominated data is calculated using 1-second bins in cleaned event files. If a bin has >2000 counts, and if more than 50% of those come from <1% of pixels, then it is considered to be noise-dominated and hence unusable.
| Quadrant | # 1 sec bins | Bins with >0 counts | Bins with >2000 counts | High rate bins dominated by noise | Noise dominated (total time) | Noise dominated (detector-on time) | Marked lightcurve |
|---|---|---|---|---|---|---|---|
| A | 20348 | 18545 | 30 | 30 | 0.15% | 0.16% | 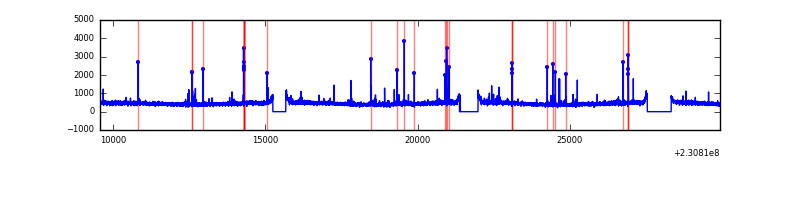 |
| B | 20348 | 18545 | 196 | 196 | 0.96% | 1.06% | 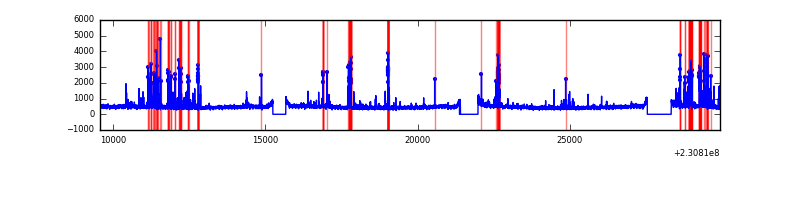 |
| C | 20348 | 18545 | 0 | 0 | 0.00% | 0.00% | 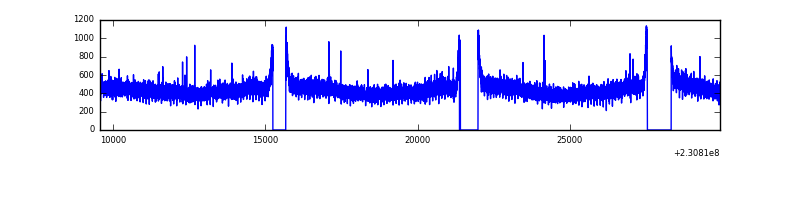 |
| D | 20348 | 18545 | 340 | 340 | 1.67% | 1.83% | 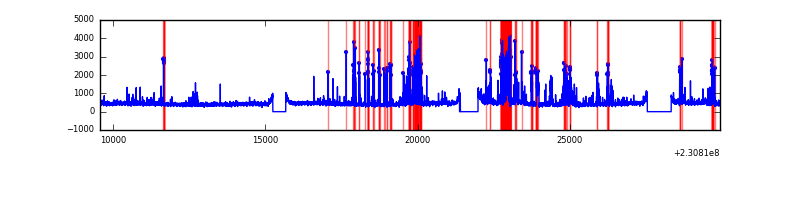 |
Top three noisy pixels from each quadrant. If the there are fewer than three noisy pixels in the level2.evt file, extra rows are filled as -1
| Pixel properties | Quadrant properties | ||||||
|---|---|---|---|---|---|---|---|
| Quadrant | DetID | PixID | Counts | Sigma | Mean | Median | Sigma |
| A | 5 | 16 | 145926 | 327.98 | 2136 | 2087 | 438.6 |
| A | 13 | 251 | 43630 | 94.73 | 2136 | 2087 | 438.6 |
| A | 0 | 226 | 19958 | 40.75 | 2136 | 2087 | 438.6 |
| B | 10 | 16 | 817928 | 2008.76 | 2126 | 2070 | 406.2 |
| B | 5 | 255 | 281203 | 687.26 | 2126 | 2070 | 406.2 |
| B | 0 | 214 | 85659 | 205.81 | 2126 | 2070 | 406.2 |
| C | 13 | 61 | 15550 | 27.91 | 2084 | 2091 | 482.2 |
| C | 8 | 222 | 9033 | 14.4 | 2084 | 2091 | 482.2 |
| C | 3 | 202 | 5297 | 6.65 | 2084 | 2091 | 482.2 |
| D | 1 | 52 | 1558009 | 3111.33 | 2054 | 2003 | 500.1 |
| D | 13 | 105 | 502446 | 1000.67 | 2054 | 2003 | 500.1 |
| D | 2 | 234 | 66251 | 128.47 | 2054 | 2003 | 500.1 |
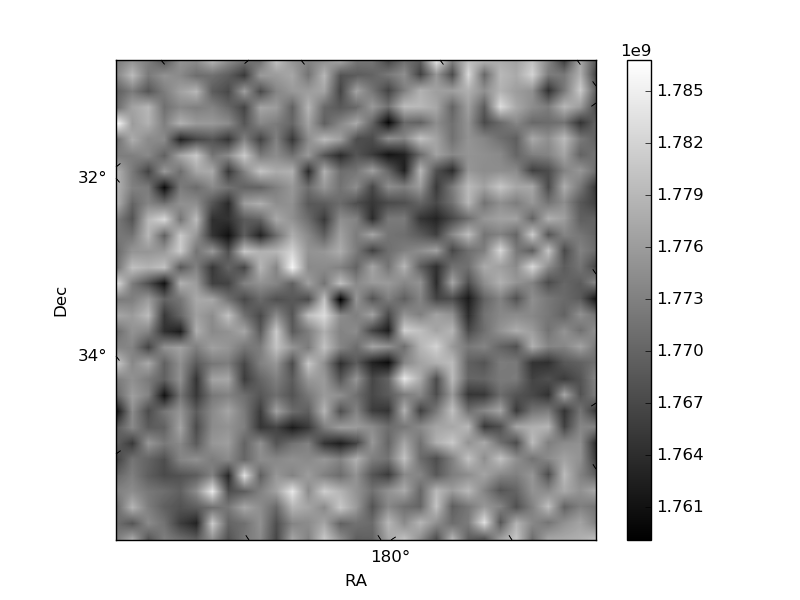
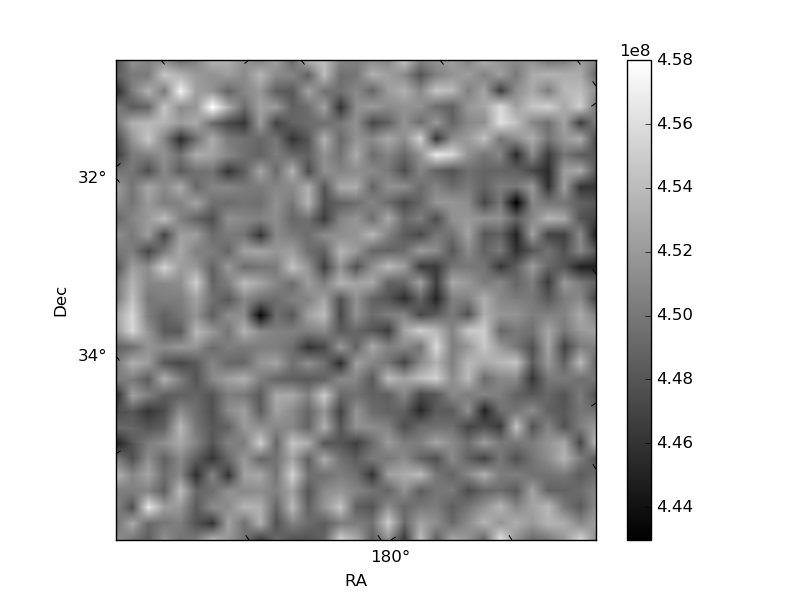
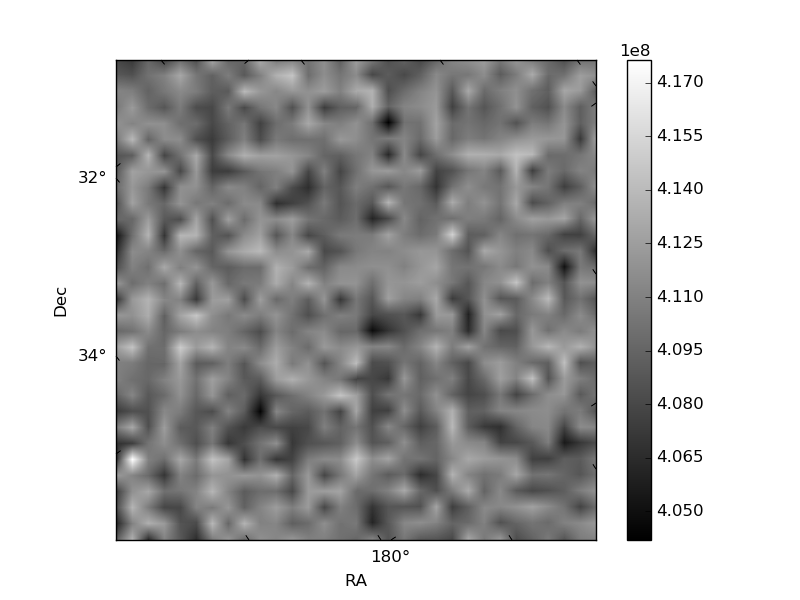
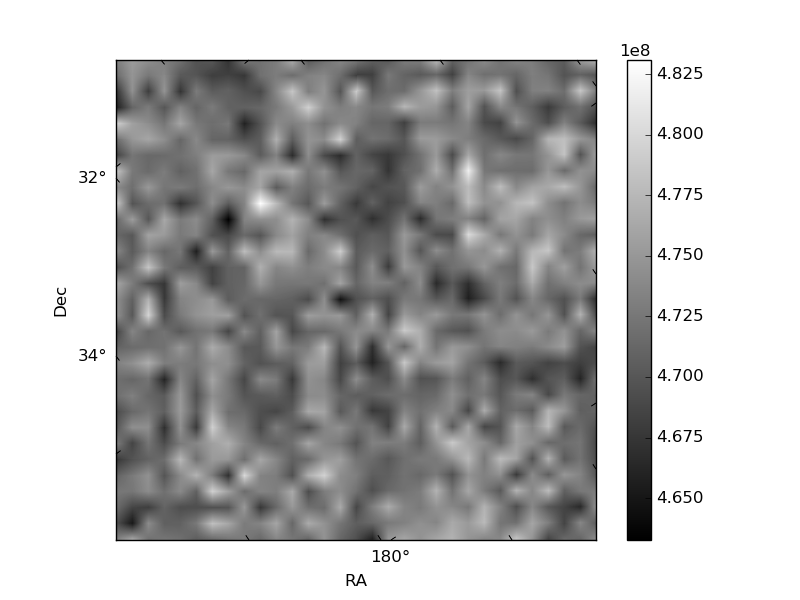
Histogram calculated using DETX and DETY for each event in the final _common_clean file
| Quadrant A | 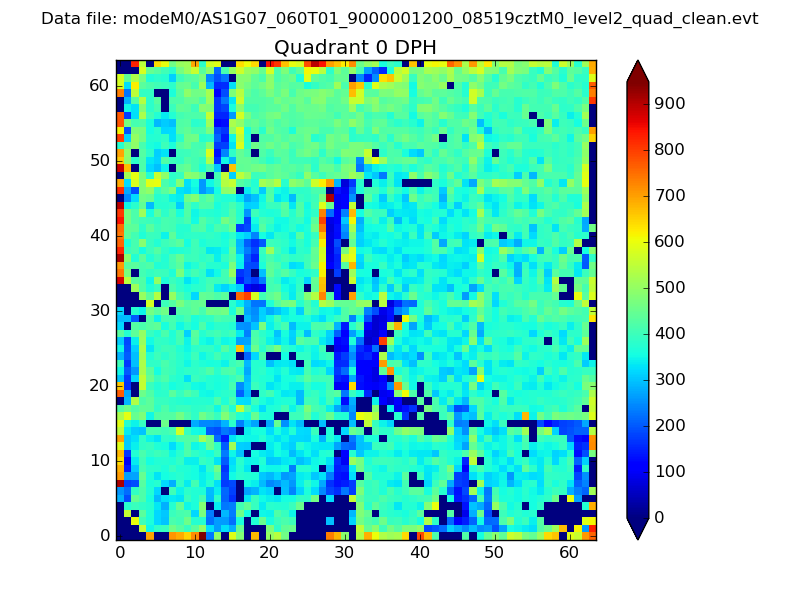 |
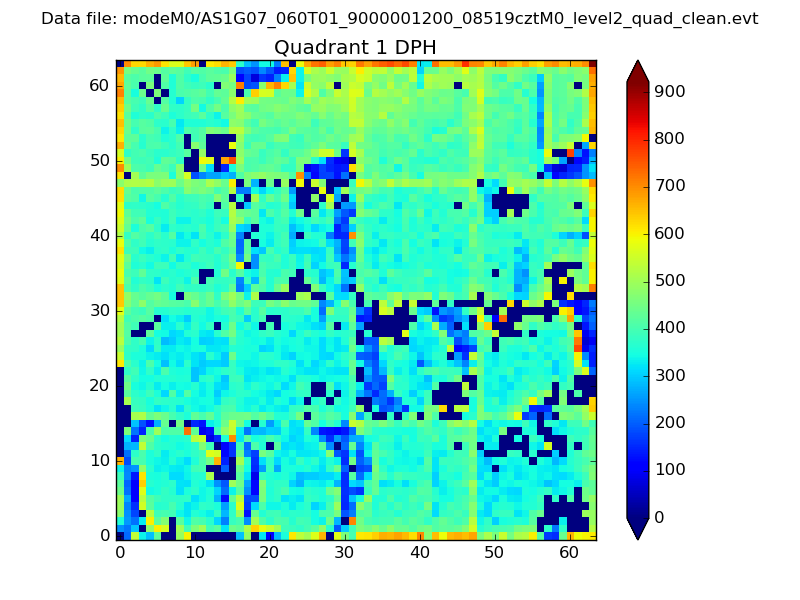 |
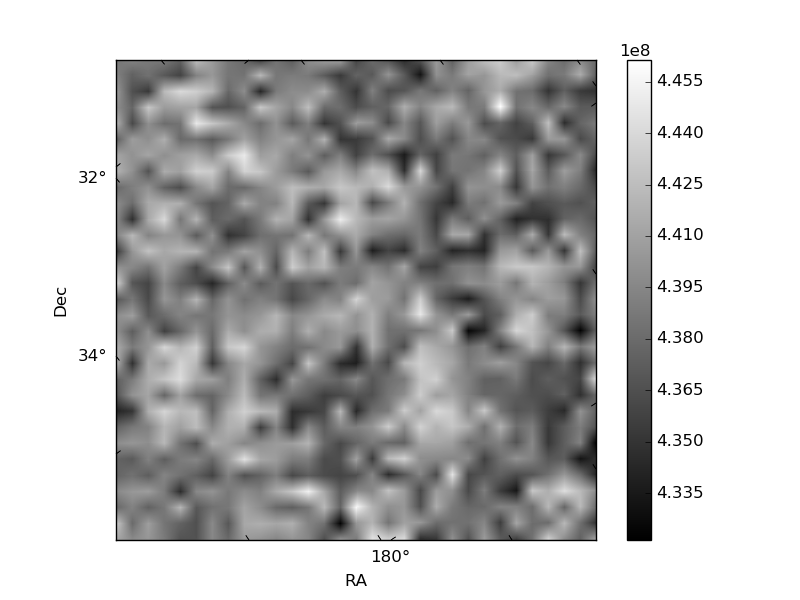
Quadrant B |
|---|---|---|---|
| Quadrant D | 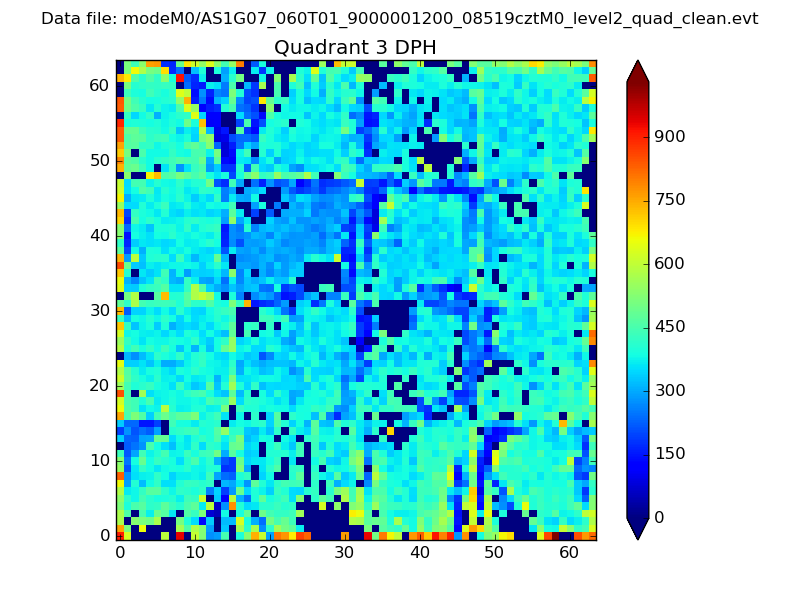 |
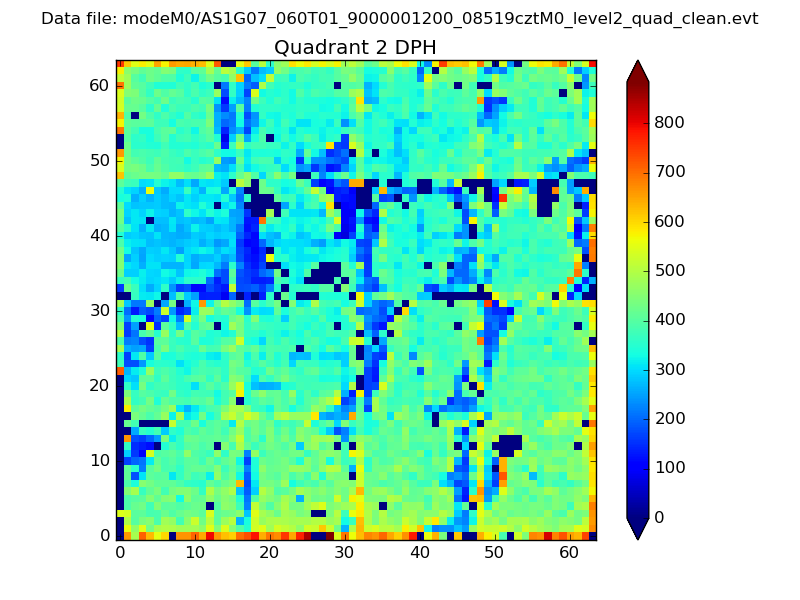 |
Quadrant C |
| Plot type | Count rate plots | Images |
|---|---|---|
| Comparison with Poisson distribution Blue bars denote a histogram of data divided into 1 sec bins. Red curve is a Poisson curve with rate = median count rate of data. |
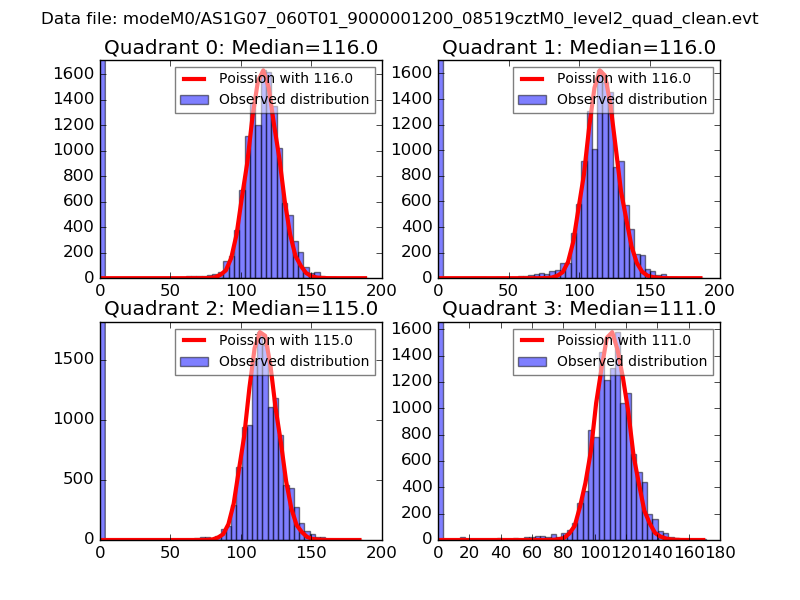 |
 |
| Quadrant-wise count rates Data is divided into 100 sec bins |
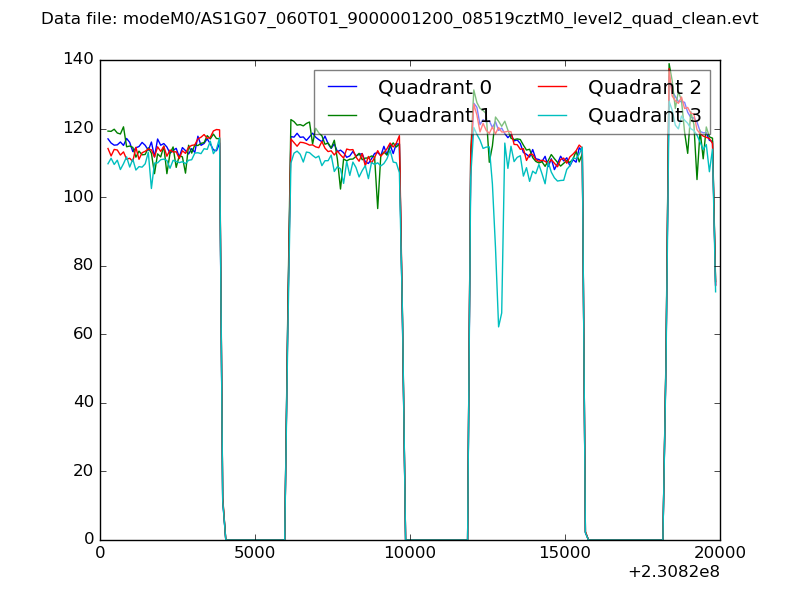 |
|
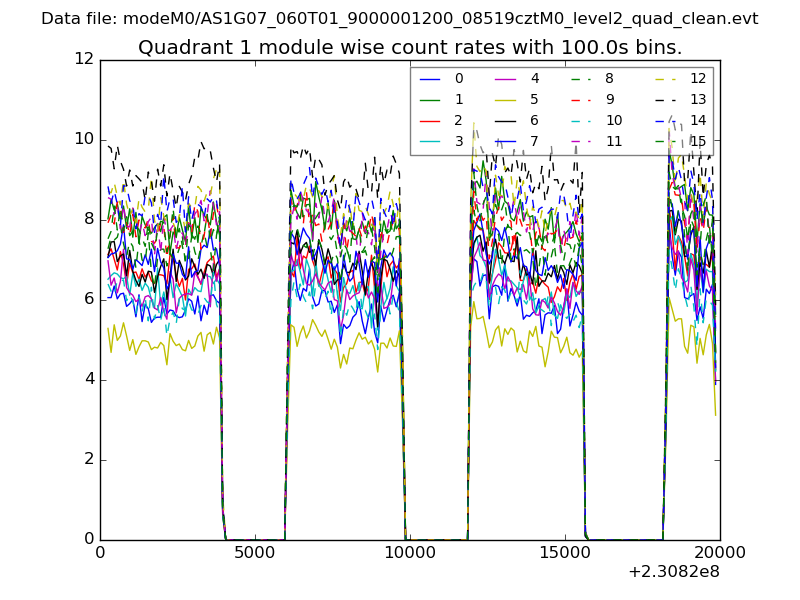
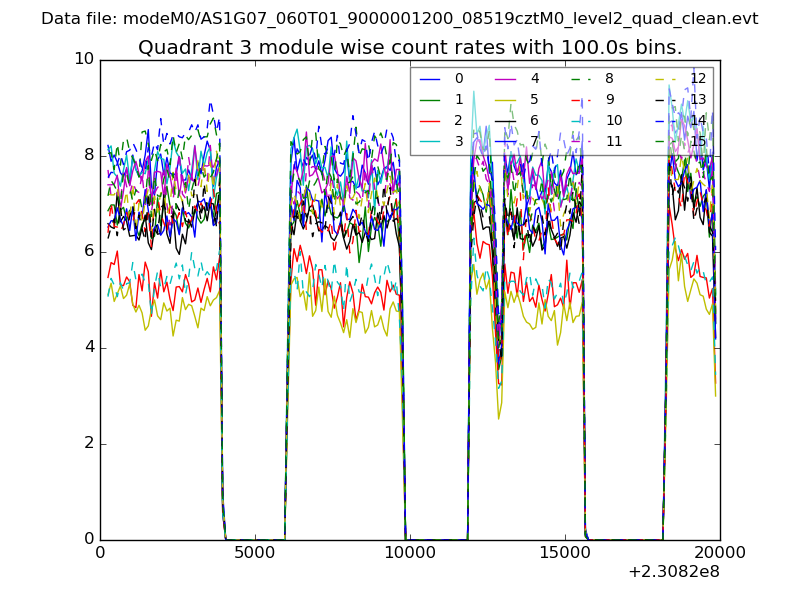
| Module-wise count rates for Quadrant A Data is divided into 100 sec bins |
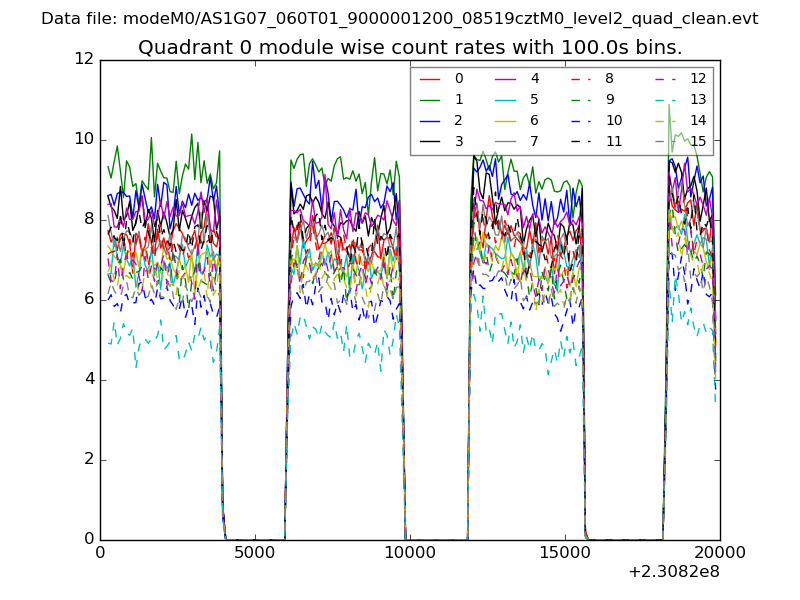 |
 |
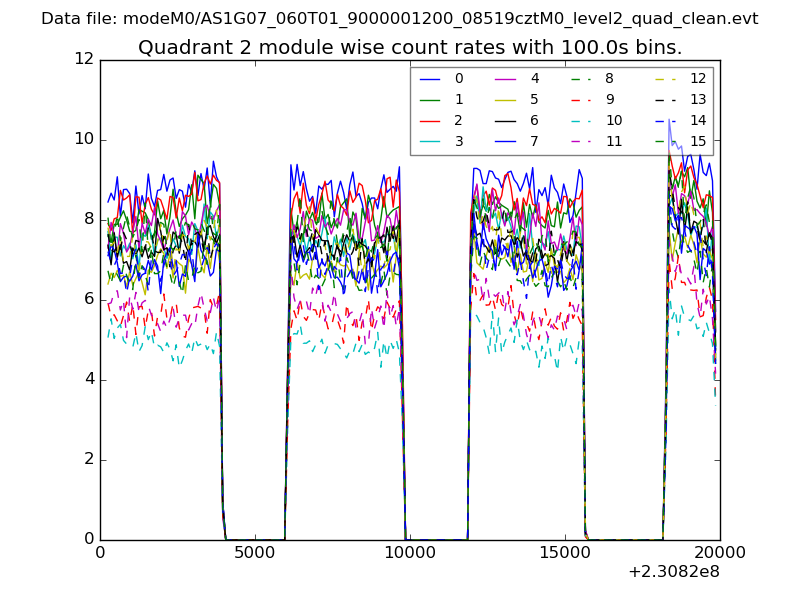
| Module-wise count rates for Quadrant B Data is divided into 100 sec bins |
 |
 |
| Module-wise count rates for Quadrant C Data is divided into 100 sec bins |
 |
 |
| Module-wise count rates for Quadrant D Data is divided into 100 sec bins |
 |
 |
| Parameter | Plot |
|---|---|
| CZT HV Monitor | 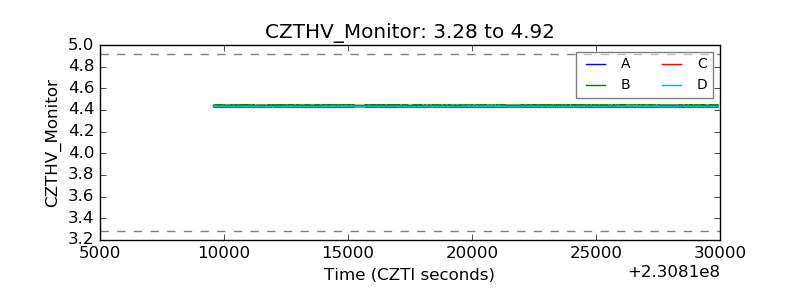 |
| D_VDD | 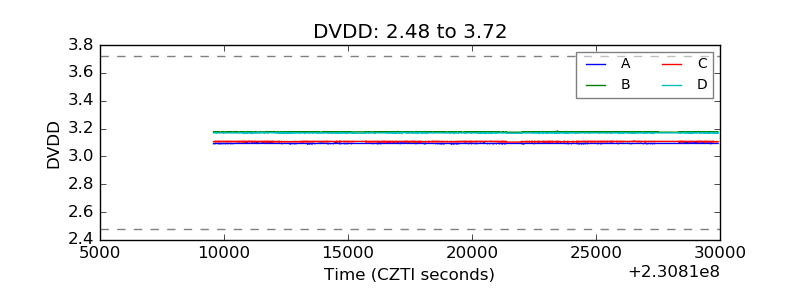 |
| Temperature 1 | 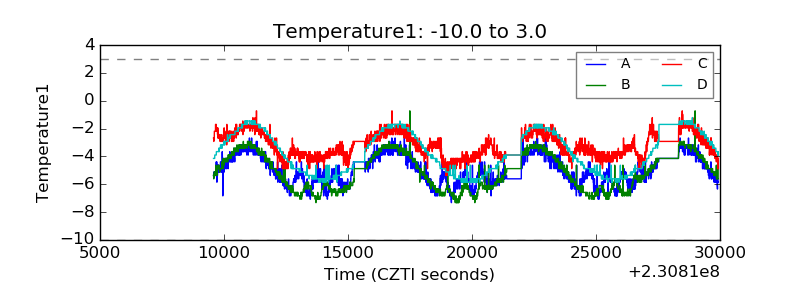 |
| Veto HV Monitor | 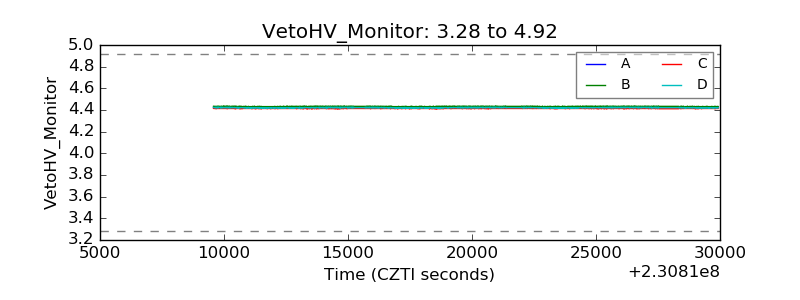 |
| Veto LLD | 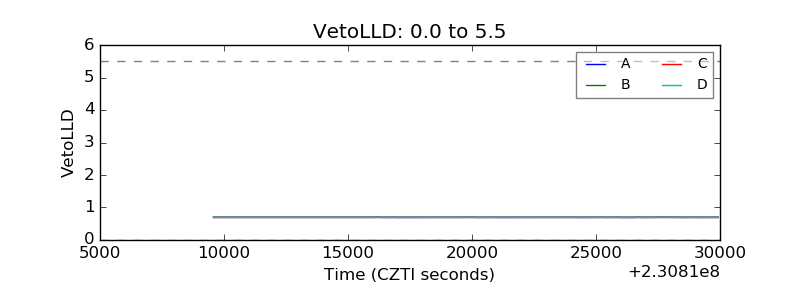 |
| Alpha Counter | 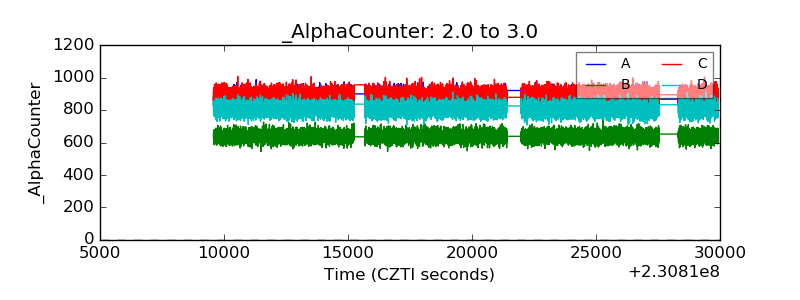 |
| _CPM_Rate | 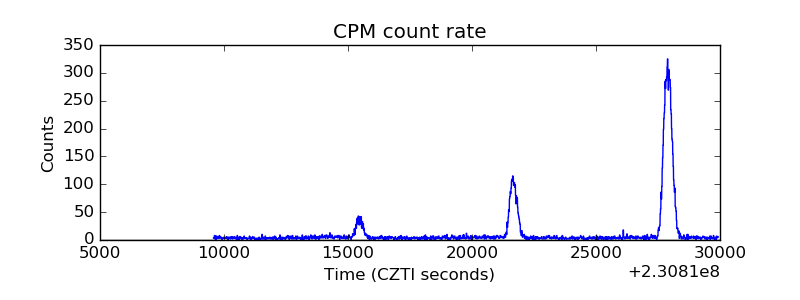 |
| CZT Counter |  |
| +2.5 Volts monitor |  |
| +5 Volts monitor |  |
| _ROLL_ROT | 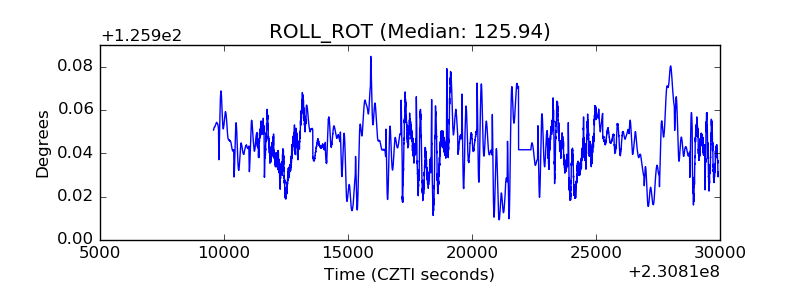 |
| _Roll_DEC | 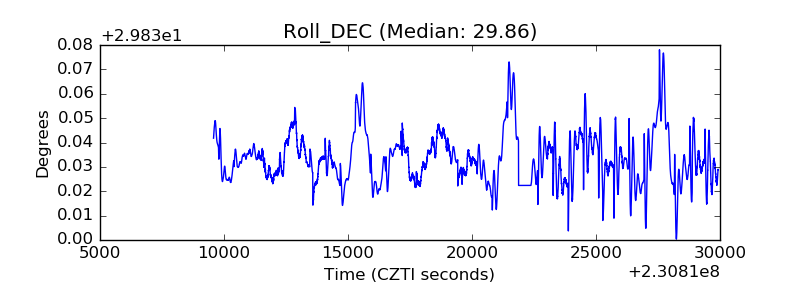 |
| _Roll_RA | 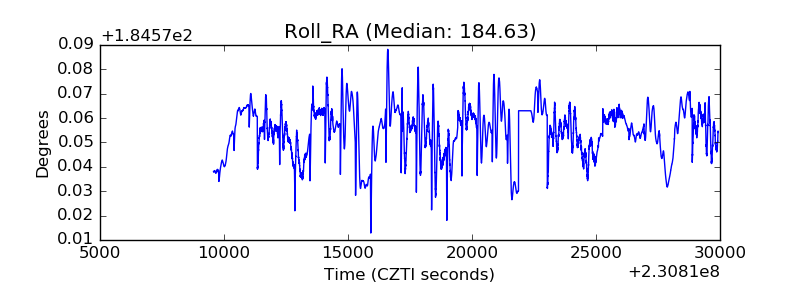 |
| Veto Counter | 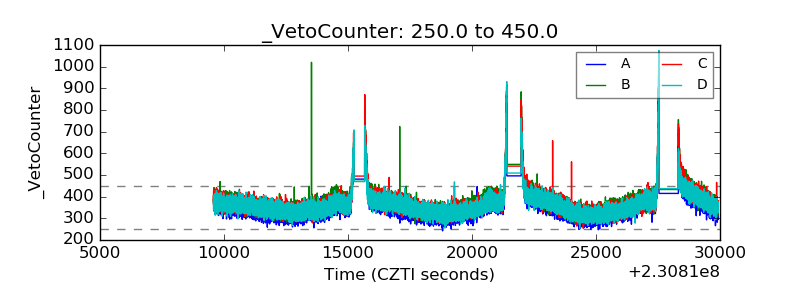 |