| Param | Original file | Final file |
|---|---|---|
| Filename | modeM0/AS1G07_060T01_9000001200_08522cztM0_level2.evt | modeM0/AS1G07_060T01_9000001200_08522cztM0_level2_quad_clean.evt |
| Size (bytes) | 423,970,560 | 87,220,800 |
| Size | 404.3 MB | 83.2 MB |
| Events in quadrant A | 3,036,858 | 551,081 |
| Events in quadrant B | 3,460,493 | 551,585 |
| Events in quadrant C | 2,884,281 | 552,157 |
| Events in quadrant D | 3,018,045 | 535,085 |
| Mode SS | |||
|---|---|---|---|
| Quadrant | BADHDUFLAG | Total packets | Discarded packets |
| A | 0 | 132 | 0 |
| B | 0 | 132 | 0 |
| C | 0 | 132 | 0 |
| D | 0 | 132 | 0 |
| Mode M0 | |||
|---|---|---|---|
| Quadrant | BADHDUFLAG | Total packets | Discarded packets |
| A | 0 | 13710 | 3 |
| B | 0 | 14762 | 2 |
| C | 0 | 13201 | 2 |
| D | 0 | 13790 | 2 |
| Mode M9 | |||
|---|---|---|---|
| Quadrant | BADHDUFLAG | Total packets | Discarded packets |
| A | 0 | 12 | 0 |
| B | 0 | 12 | 0 |
| C | 0 | 12 | 0 |
| D | 0 | 13 | 0 |
| Quadrant | Total seconds | Saturated seconds | Saturation percentage |
|---|---|---|---|
| A | 6469 | 33 | 0.510125% |
| B | 6469 | 132 | 2.040501% |
| C | 6469 | 10 | 0.154583% |
| D | 6469 | 15 | 0.231875% |
Noise dominated data is calculated using 1-second bins in cleaned event files. If a bin has >2000 counts, and if more than 50% of those come from <1% of pixels, then it is considered to be noise-dominated and hence unusable.
| Quadrant | # 1 sec bins | Bins with >0 counts | Bins with >2000 counts | High rate bins dominated by noise | Noise dominated (total time) | Noise dominated (detector-on time) | Marked lightcurve |
|---|---|---|---|---|---|---|---|
| A | 7574 | 6470 | 11 | 11 | 0.15% | 0.17% | 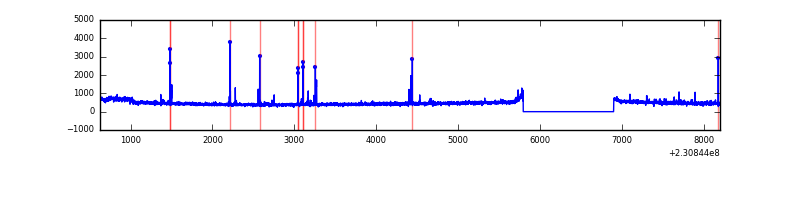 |
| B | 7574 | 6470 | 78 | 78 | 1.03% | 1.21% | 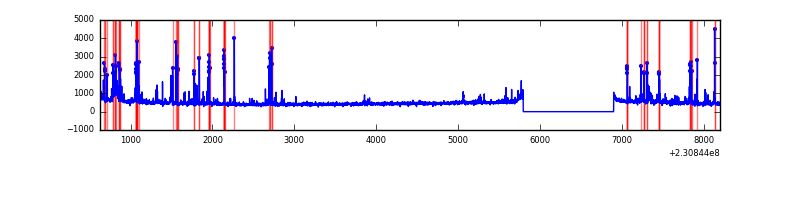 |
| C | 7574 | 6470 | 0 | 0 | 0.00% | 0.00% | 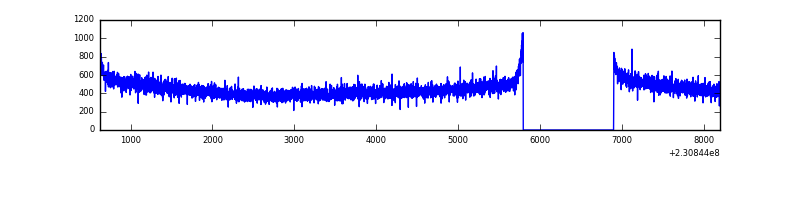 |
| D | 7574 | 6470 | 6 | 6 | 0.08% | 0.09% | 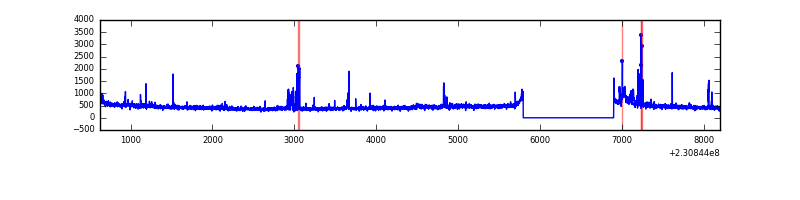 |
Top three noisy pixels from each quadrant. If the there are fewer than three noisy pixels in the level2.evt file, extra rows are filled as -1
| Pixel properties | Quadrant properties | ||||||
|---|---|---|---|---|---|---|---|
| Quadrant | DetID | PixID | Counts | Sigma | Mean | Median | Sigma |
| A | 5 | 16 | 62068 | 403.49 | 748 | 732 | 152.0 |
| A | 15 | 236 | 51452 | 333.66 | 748 | 732 | 152.0 |
| A | 8 | 5 | 28977 | 185.81 | 748 | 732 | 152.0 |
| B | 10 | 16 | 436048 | 3072.6 | 748 | 729 | 141.7 |
| B | 4 | 173 | 32764 | 226.11 | 748 | 729 | 141.7 |
| B | 0 | 214 | 28367 | 195.08 | 748 | 729 | 141.7 |
| C | 8 | 128 | 5547 | 28.21 | 737 | 739 | 170.4 |
| C | 13 | 61 | 5488 | 27.86 | 737 | 739 | 170.4 |
| C | 8 | 112 | 2616 | 11.01 | 737 | 739 | 170.4 |
| D | 1 | 52 | 216868 | 1210.28 | 728 | 711 | 178.6 |
| D | 2 | 234 | 21364 | 115.64 | 728 | 711 | 178.6 |
| D | 9 | 64 | 10403 | 54.27 | 728 | 711 | 178.6 |
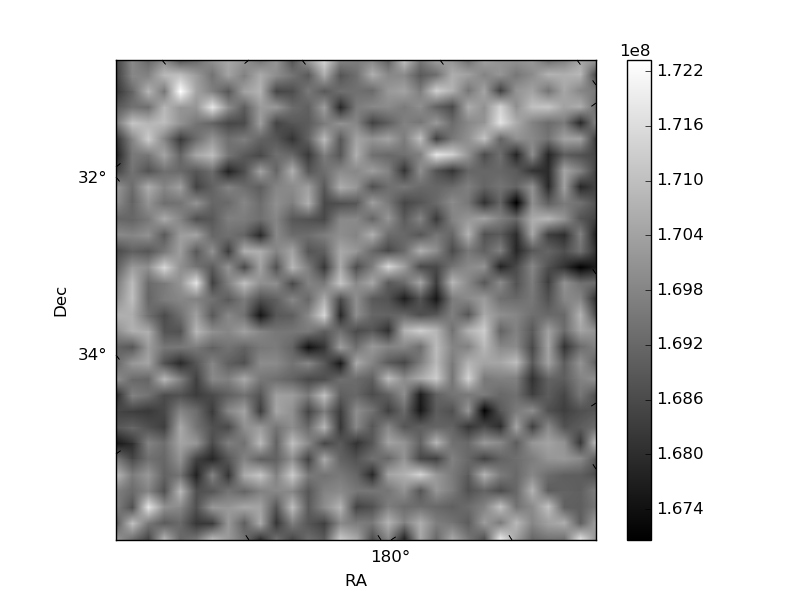
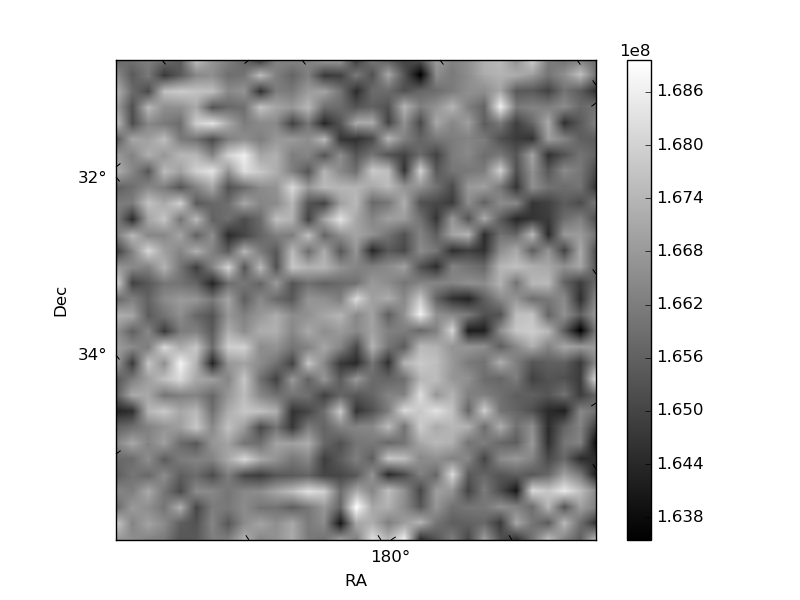
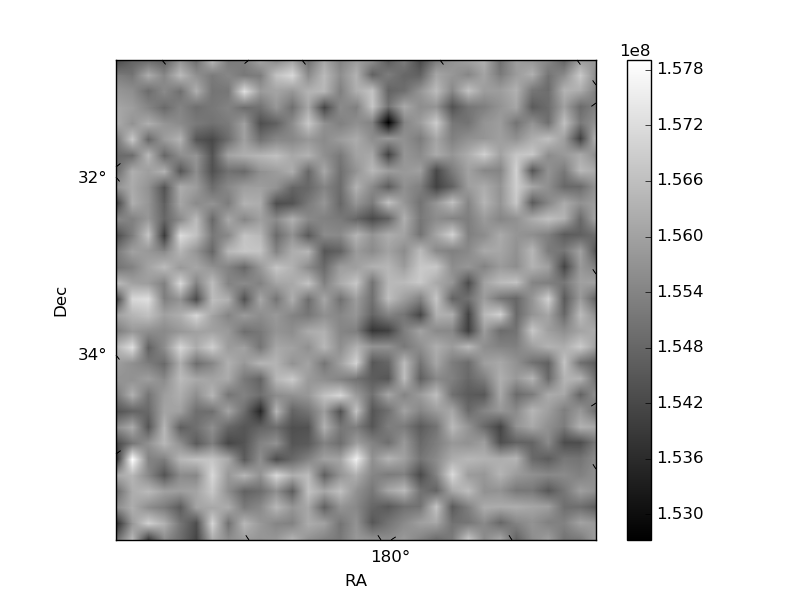
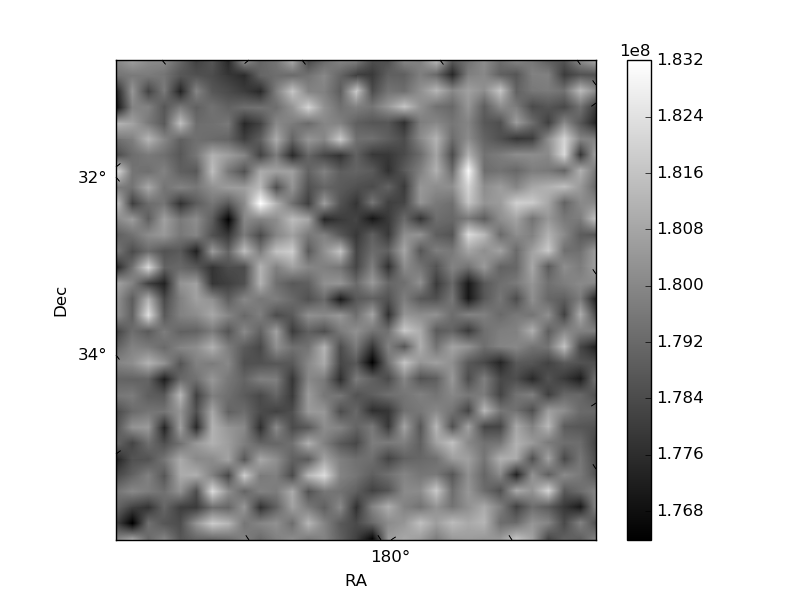
Histogram calculated using DETX and DETY for each event in the final _common_clean file
| Quadrant A |  |
 |
Quadrant B |
|---|---|---|---|
| Quadrant D |  |
 |
Quadrant C |
| Plot type | Count rate plots | Images |
|---|---|---|
| Comparison with Poisson distribution Blue bars denote a histogram of data divided into 1 sec bins. Red curve is a Poisson curve with rate = median count rate of data. |
 |
 |
| Quadrant-wise count rates Data is divided into 100 sec bins |
 |
|
| Module-wise count rates for Quadrant A Data is divided into 100 sec bins |
 |
 |
| Module-wise count rates for Quadrant B Data is divided into 100 sec bins |
 |
 |
| Module-wise count rates for Quadrant C Data is divided into 100 sec bins |
 |
 |
| Module-wise count rates for Quadrant D Data is divided into 100 sec bins |
 |
 |
| Parameter | Plot |
|---|---|
| CZT HV Monitor |  |
| D_VDD |  |
| Temperature 1 |  |
| Veto HV Monitor |  |
| Veto LLD |  |
| Alpha Counter |  |
| _CPM_Rate |  |
| CZT Counter |  |
| +2.5 Volts monitor |  |
| +5 Volts monitor |  |
| _ROLL_ROT |  |
| _Roll_DEC |  |
| _Roll_RA |  |
| Veto Counter |  |