| Param | Original file | Final file |
|---|---|---|
| Filename | modeM0/AS1G07_060T01_9000001200_08523cztM0_level2.evt | modeM0/AS1G07_060T01_9000001200_08523cztM0_level2_quad_clean.evt |
| Size (bytes) | 426,075,840 | 89,156,160 |
| Size | 406.3 MB | 85.0 MB |
| Events in quadrant A | 2,985,974 | 567,955 |
| Events in quadrant B | 3,504,729 | 571,981 |
| Events in quadrant C | 2,916,235 | 568,028 |
| Events in quadrant D | 3,060,276 | 544,416 |
| Mode SS | |||
|---|---|---|---|
| Quadrant | BADHDUFLAG | Total packets | Discarded packets |
| A | 0 | 130 | 0 |
| B | 0 | 130 | 0 |
| C | 0 | 130 | 0 |
| D | 0 | 130 | 0 |
| Mode M0 | |||
|---|---|---|---|
| Quadrant | BADHDUFLAG | Total packets | Discarded packets |
| A | 0 | 13207 | 3 |
| B | 0 | 14783 | 2 |
| C | 0 | 13117 | 2 |
| D | 0 | 13878 | 2 |
| Mode M9 | |||
|---|---|---|---|
| Quadrant | BADHDUFLAG | Total packets | Discarded packets |
| A | 0 | 20 | 0 |
| B | 0 | 20 | 0 |
| C | 0 | 20 | 0 |
| D | 0 | 21 | 0 |
| Quadrant | Total seconds | Saturated seconds | Saturation percentage |
|---|---|---|---|
| A | 6417 | 23 | 0.358423% |
| B | 6417 | 137 | 2.134954% |
| C | 6417 | 8 | 0.124669% |
| D | 6417 | 45 | 0.701262% |
Noise dominated data is calculated using 1-second bins in cleaned event files. If a bin has >2000 counts, and if more than 50% of those come from <1% of pixels, then it is considered to be noise-dominated and hence unusable.
| Quadrant | # 1 sec bins | Bins with >0 counts | Bins with >2000 counts | High rate bins dominated by noise | Noise dominated (total time) | Noise dominated (detector-on time) | Marked lightcurve |
|---|---|---|---|---|---|---|---|
| A | 7612 | 6418 | 2 | 2 | 0.03% | 0.03% |  |
| B | 7612 | 6418 | 76 | 76 | 1.00% | 1.18% | 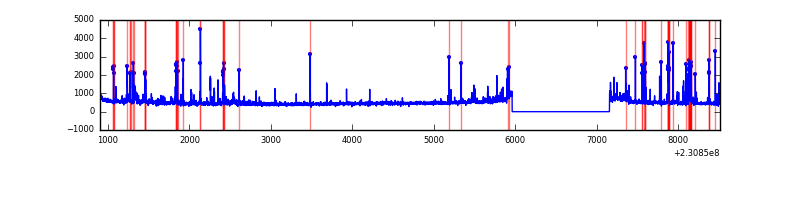 |
| C | 7612 | 6418 | 0 | 0 | 0.00% | 0.00% | 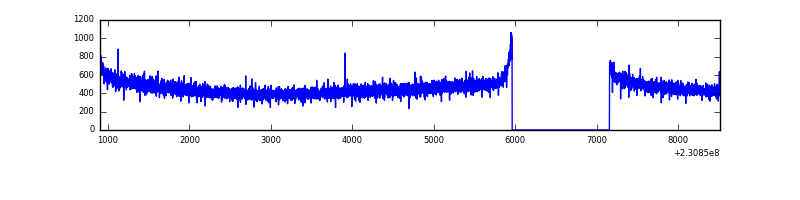 |
| D | 7612 | 6418 | 23 | 23 | 0.30% | 0.36% | 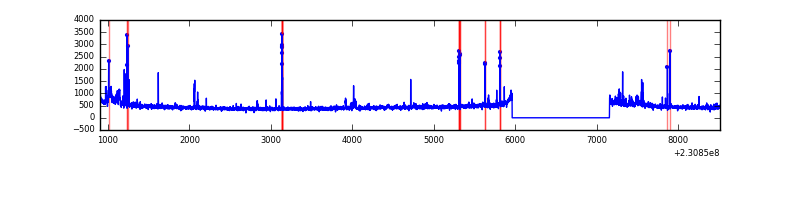 |
Top three noisy pixels from each quadrant. If the there are fewer than three noisy pixels in the level2.evt file, extra rows are filled as -1
| Pixel properties | Quadrant properties | ||||||
|---|---|---|---|---|---|---|---|
| Quadrant | DetID | PixID | Counts | Sigma | Mean | Median | Sigma |
| A | 8 | 5 | 58992 | 378.88 | 756 | 739 | 153.8 |
| A | 5 | 16 | 16628 | 103.34 | 756 | 739 | 153.8 |
| A | 0 | 226 | 7014 | 40.81 | 756 | 739 | 153.8 |
| B | 10 | 16 | 393495 | 2751.58 | 757 | 739 | 142.7 |
| B | 5 | 255 | 56998 | 394.14 | 757 | 739 | 142.7 |
| B | 0 | 214 | 44065 | 303.53 | 757 | 739 | 142.7 |
| C | 8 | 128 | 15983 | 88.57 | 740 | 745 | 172.0 |
| C | 8 | 112 | 6557 | 33.78 | 740 | 745 | 172.0 |
| C | 8 | 144 | 6033 | 30.74 | 740 | 745 | 172.0 |
| D | 1 | 52 | 231750 | 1294.31 | 727 | 708 | 178.5 |
| D | 13 | 223 | 26783 | 146.07 | 727 | 708 | 178.5 |
| D | 2 | 234 | 19293 | 104.11 | 727 | 708 | 178.5 |
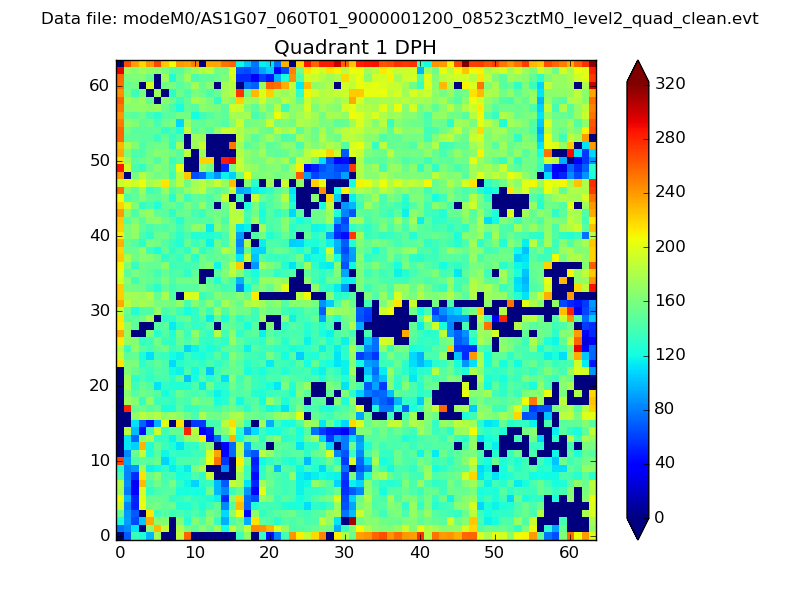
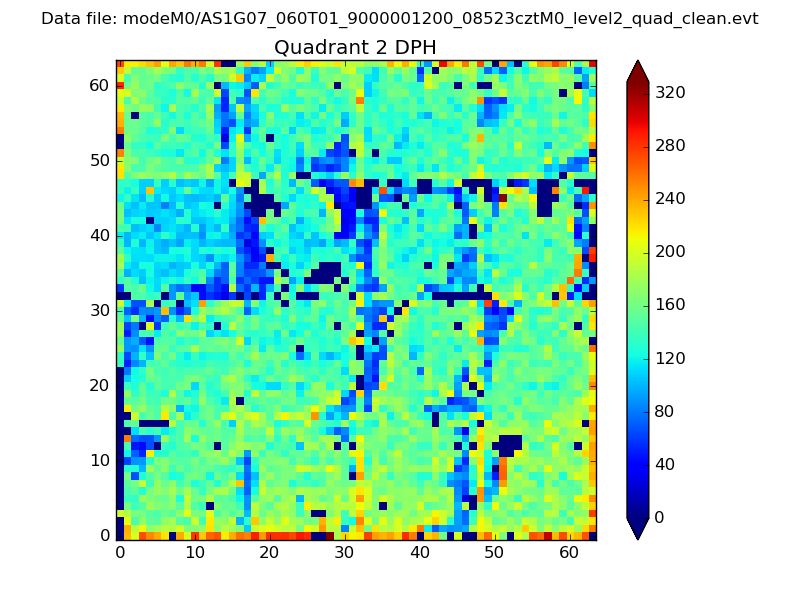
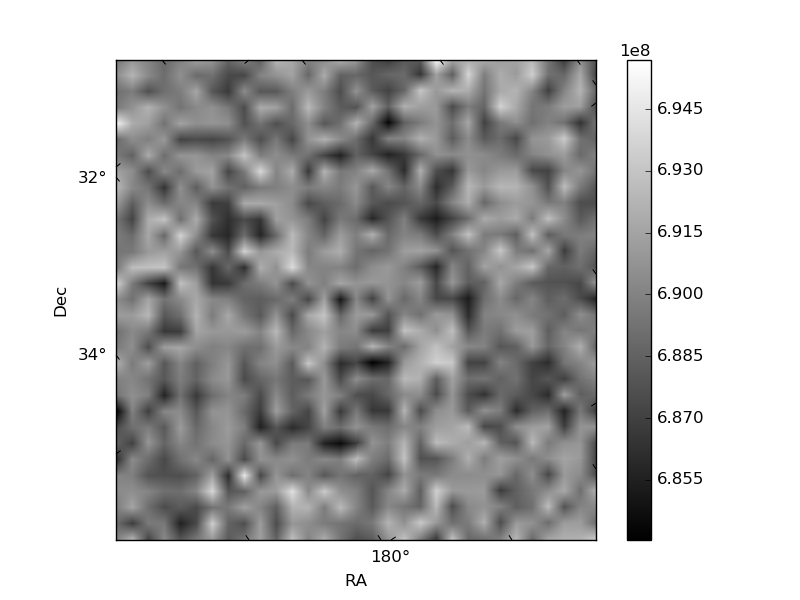
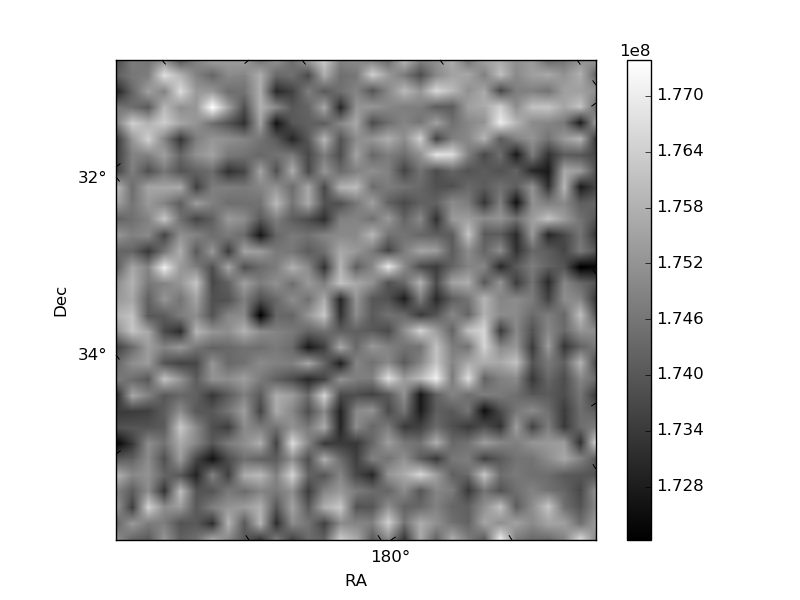
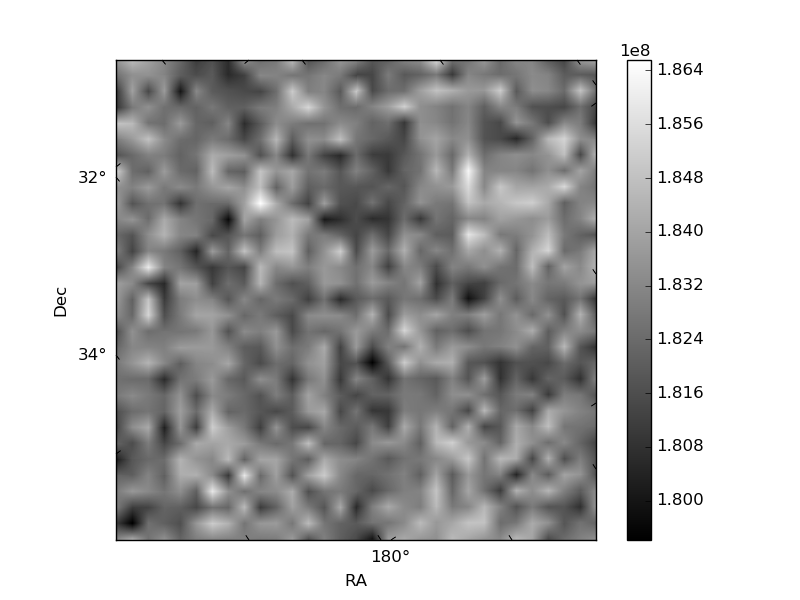
Histogram calculated using DETX and DETY for each event in the final _common_clean file
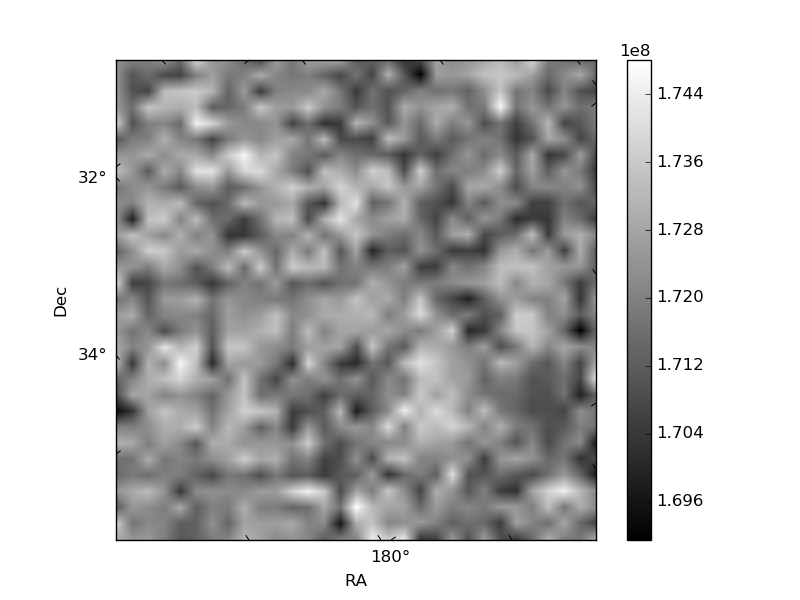
| Quadrant A | 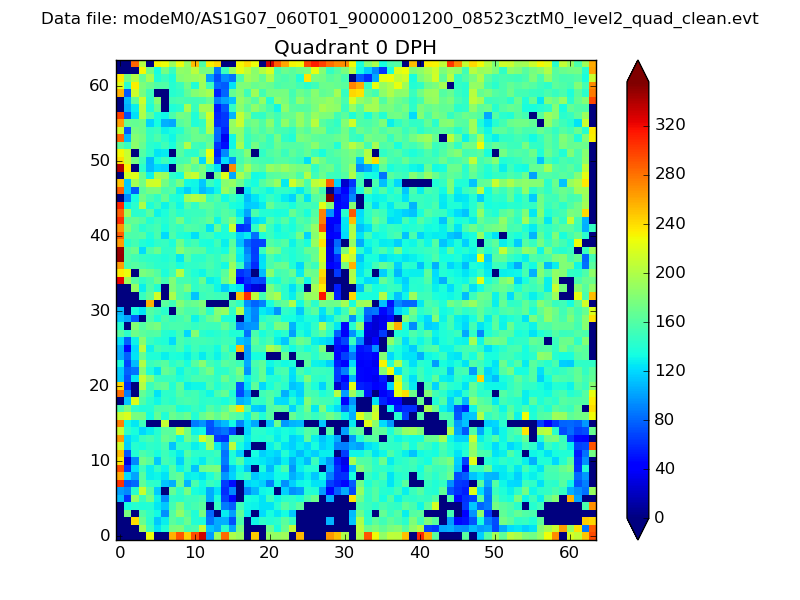 |
 |
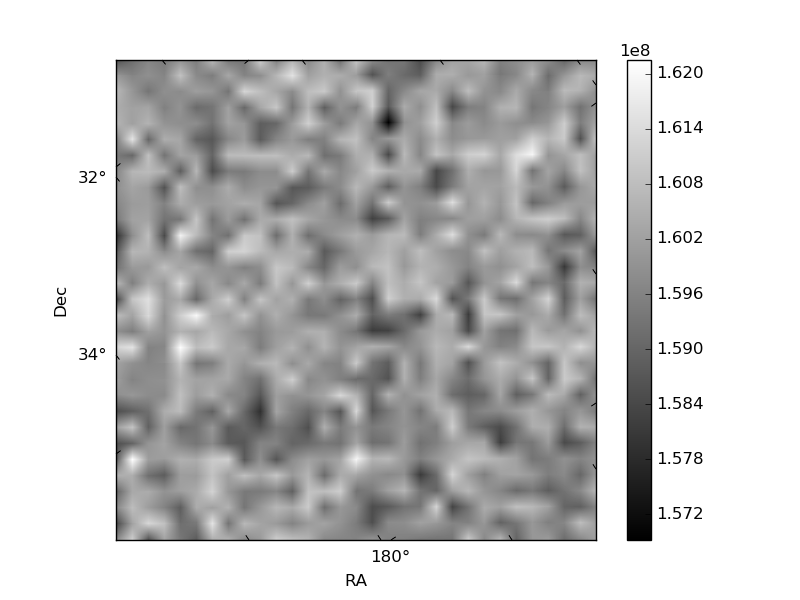
Quadrant B |
|---|---|---|---|
| Quadrant D | 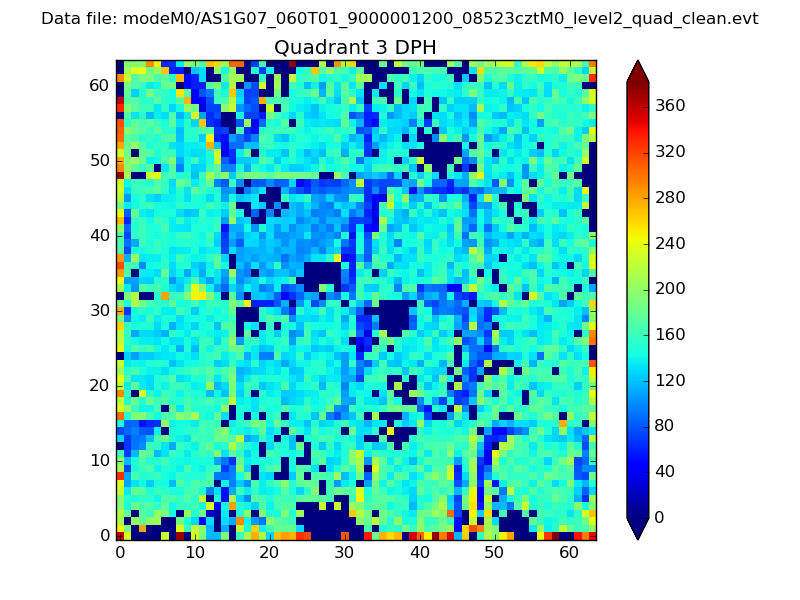 |
 |
Quadrant C |
| Plot type | Count rate plots | Images |
|---|---|---|
| Comparison with Poisson distribution Blue bars denote a histogram of data divided into 1 sec bins. Red curve is a Poisson curve with rate = median count rate of data. |
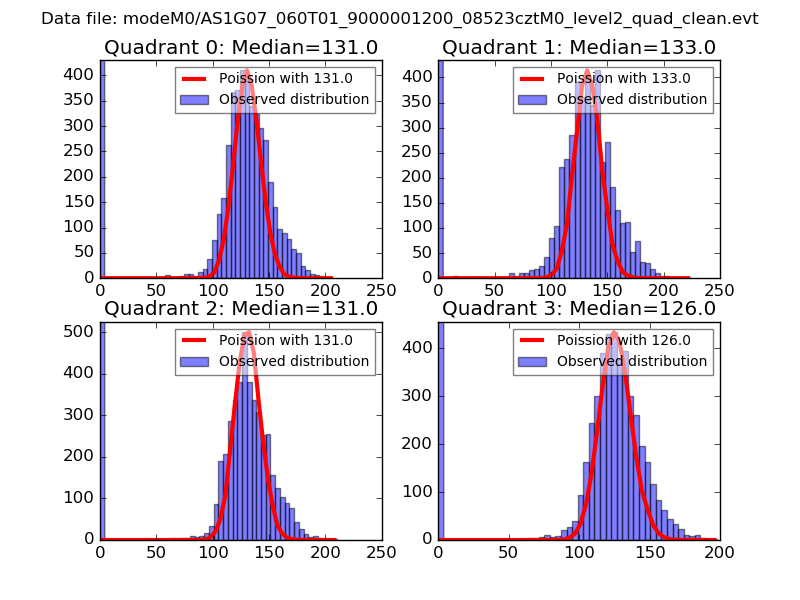 |
 |
| Quadrant-wise count rates Data is divided into 100 sec bins |
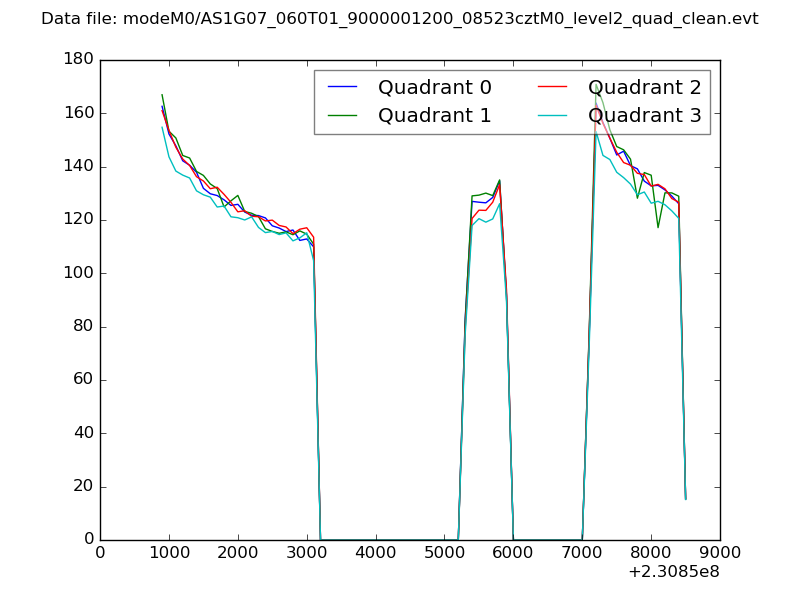 |
|
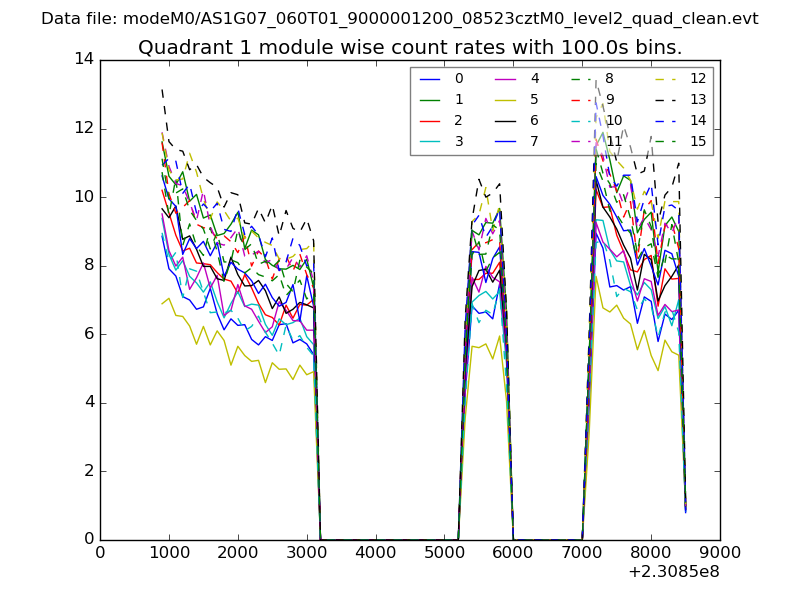
| Module-wise count rates for Quadrant A Data is divided into 100 sec bins |
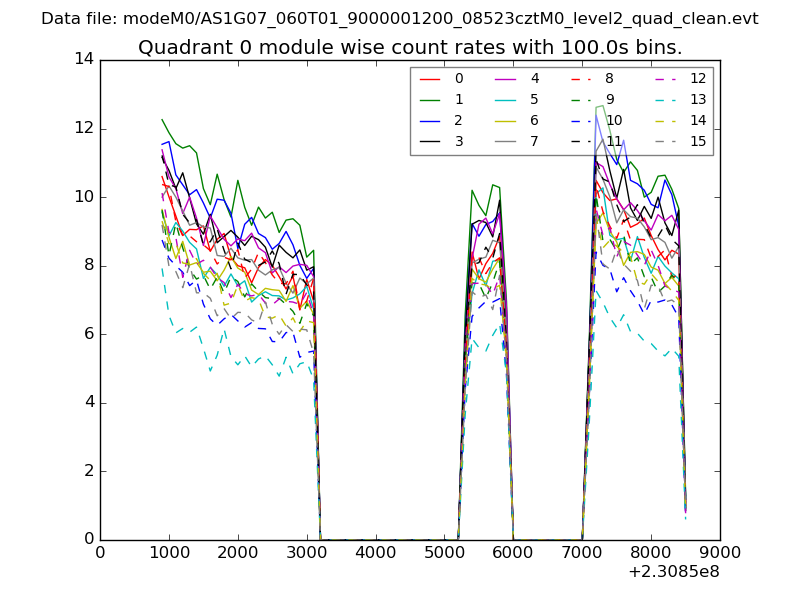 |
 |
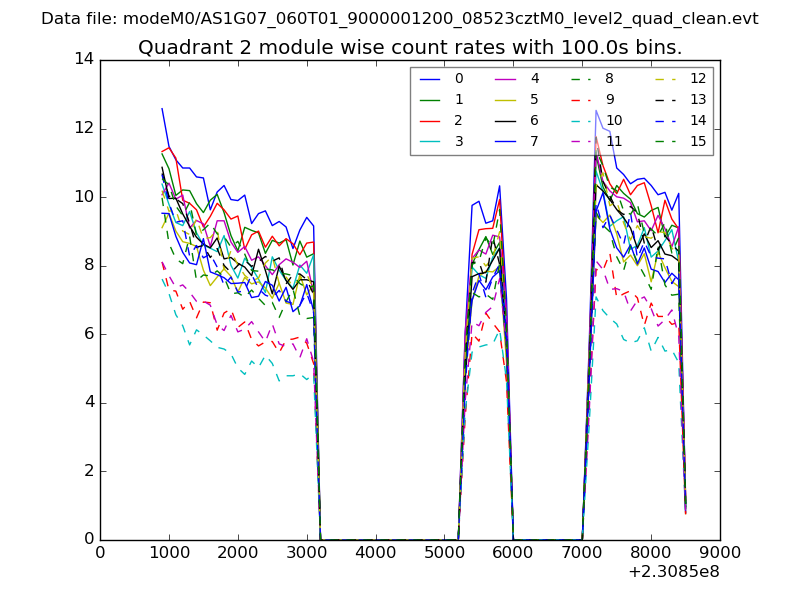
| Module-wise count rates for Quadrant B Data is divided into 100 sec bins |
 |
 |
| Module-wise count rates for Quadrant C Data is divided into 100 sec bins |
 |
 |
| Module-wise count rates for Quadrant D Data is divided into 100 sec bins |
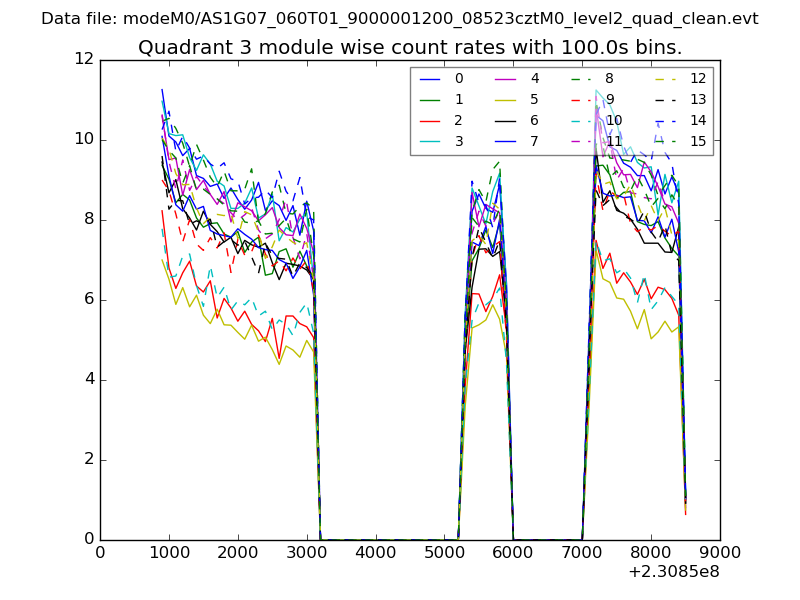 |
 |
| Parameter | Plot |
|---|---|
| CZT HV Monitor | 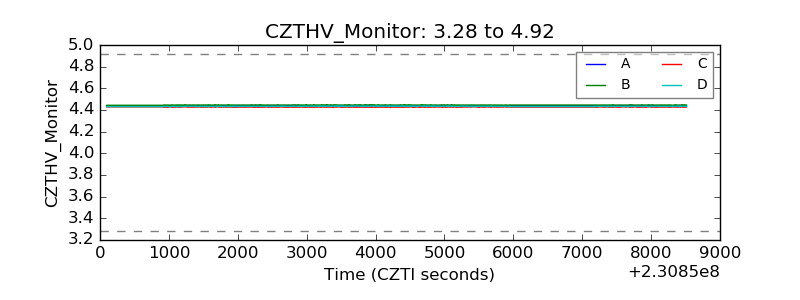 |
| D_VDD | 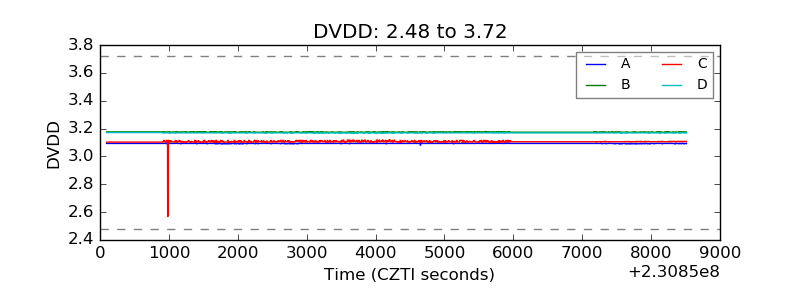 |
| Temperature 1 | 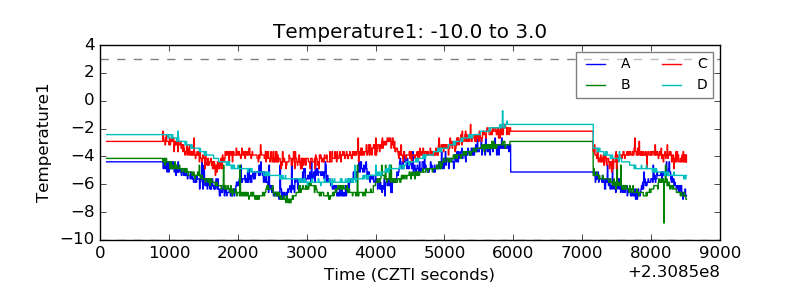 |
| Veto HV Monitor | 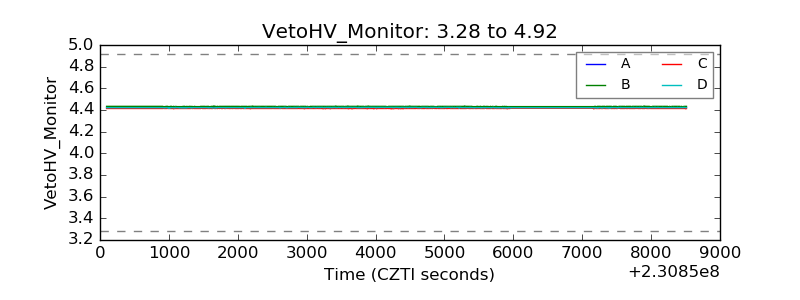 |
| Veto LLD | 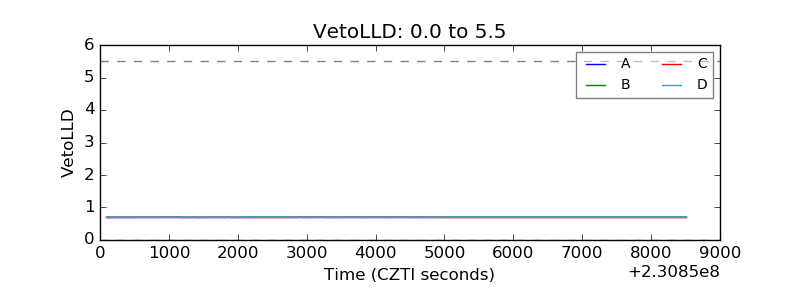 |
| Alpha Counter | 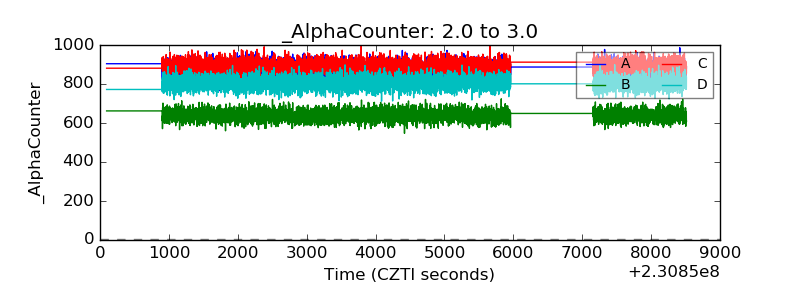 |
| _CPM_Rate | 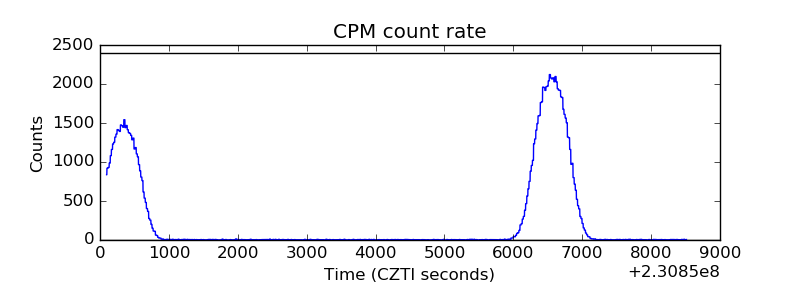 |
| CZT Counter | 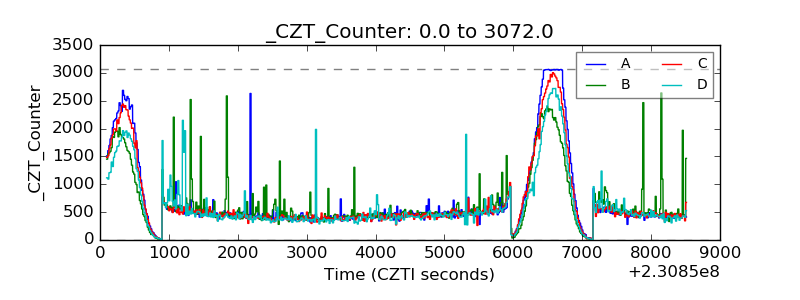 |
| +2.5 Volts monitor |  |
| +5 Volts monitor |  |
| _ROLL_ROT | 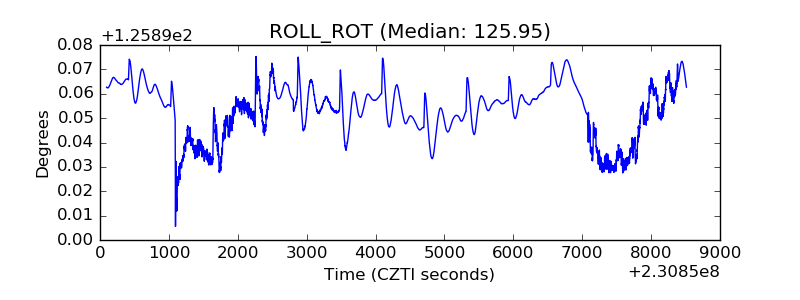 |
| _Roll_DEC | 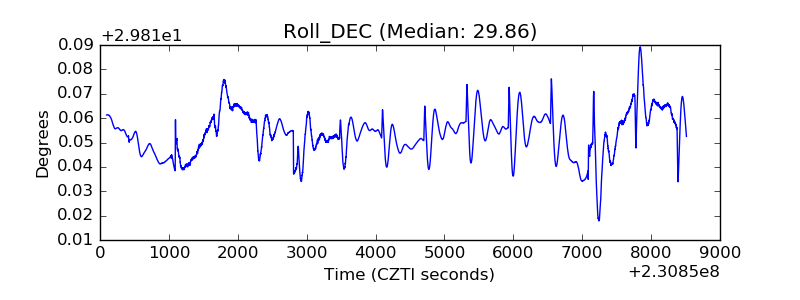 |
| _Roll_RA | 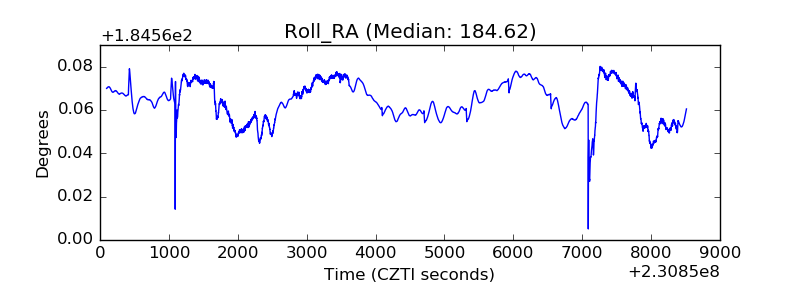 |
| Veto Counter | 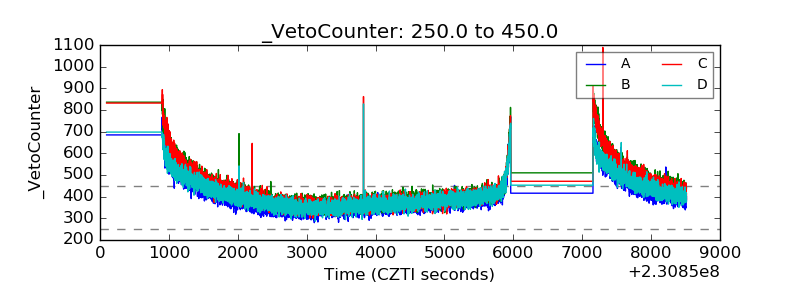 |