| Param | Original file | Final file |
|---|---|---|
| Filename | modeM0/AS1G07_060T01_9000001200_08524cztM0_level2.evt | modeM0/AS1G07_060T01_9000001200_08524cztM0_level2_quad_clean.evt |
| Size (bytes) | 425,730,240 | 87,413,760 |
| Size | 406.0 MB | 83.4 MB |
| Events in quadrant A | 2,899,436 | 558,976 |
| Events in quadrant B | 3,516,399 | 565,653 |
| Events in quadrant C | 2,831,444 | 557,298 |
| Events in quadrant D | 3,223,969 | 532,061 |
| Mode SS | |||
|---|---|---|---|
| Quadrant | BADHDUFLAG | Total packets | Discarded packets |
| A | 0 | 126 | 0 |
| B | 0 | 126 | 0 |
| C | 0 | 126 | 0 |
| D | 0 | 126 | 0 |
| Mode M0 | |||
|---|---|---|---|
| Quadrant | BADHDUFLAG | Total packets | Discarded packets |
| A | 0 | 12763 | 3 |
| B | 0 | 14520 | 2 |
| C | 0 | 12686 | 2 |
| D | 0 | 13884 | 2 |
| Mode M9 | |||
|---|---|---|---|
| Quadrant | BADHDUFLAG | Total packets | Discarded packets |
| A | 0 | 16 | 0 |
| B | 0 | 16 | 0 |
| C | 0 | 16 | 0 |
| D | 0 | 17 | 0 |
| Quadrant | Total seconds | Saturated seconds | Saturation percentage |
|---|---|---|---|
| A | 6206 | 32 | 0.515630% |
| B | 6206 | 151 | 2.433129% |
| C | 6206 | 15 | 0.241702% |
| D | 6206 | 56 | 0.902353% |
Noise dominated data is calculated using 1-second bins in cleaned event files. If a bin has >2000 counts, and if more than 50% of those come from <1% of pixels, then it is considered to be noise-dominated and hence unusable.
| Quadrant | # 1 sec bins | Bins with >0 counts | Bins with >2000 counts | High rate bins dominated by noise | Noise dominated (total time) | Noise dominated (detector-on time) | Marked lightcurve |
|---|---|---|---|---|---|---|---|
| A | 7471 | 6207 | 0 | 0 | 0.00% | 0.00% | 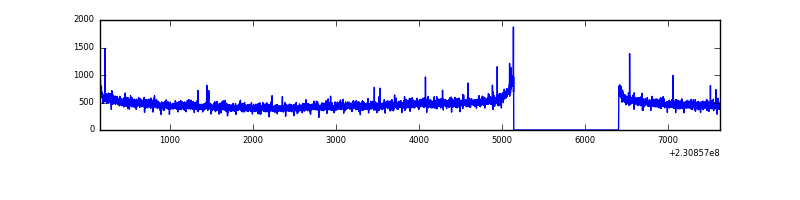 |
| B | 7471 | 6207 | 87 | 87 | 1.16% | 1.40% | 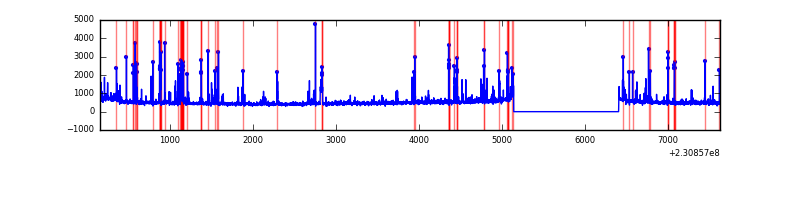 |
| C | 7471 | 6207 | 0 | 0 | 0.00% | 0.00% | 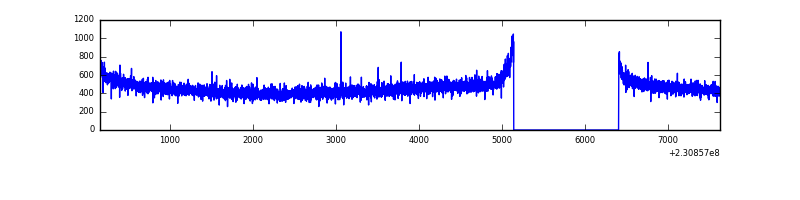 |
| D | 7471 | 6207 | 40 | 40 | 0.54% | 0.64% | 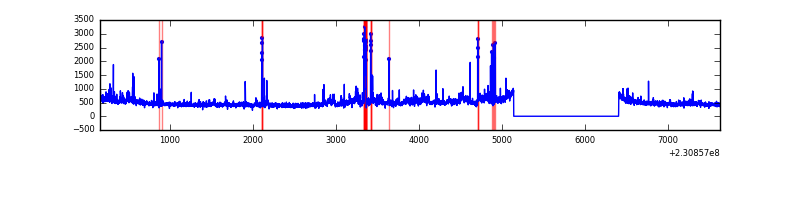 |
Top three noisy pixels from each quadrant. If the there are fewer than three noisy pixels in the level2.evt file, extra rows are filled as -1
| Pixel properties | Quadrant properties | ||||||
|---|---|---|---|---|---|---|---|
| Quadrant | DetID | PixID | Counts | Sigma | Mean | Median | Sigma |
| A | 8 | 5 | 14643 | 92.57 | 746 | 733 | 150.3 |
| A | 5 | 16 | 7696 | 46.34 | 746 | 733 | 150.3 |
| A | 0 | 226 | 6885 | 40.94 | 746 | 733 | 150.3 |
| B | 10 | 16 | 467934 | 3316.85 | 746 | 731 | 140.9 |
| B | 0 | 214 | 65231 | 457.91 | 746 | 731 | 140.9 |
| B | 5 | 255 | 46109 | 322.16 | 746 | 731 | 140.9 |
| C | 13 | 61 | 5574 | 28.89 | 725 | 729 | 167.7 |
| C | 8 | 222 | 2306 | 9.4 | 725 | 729 | 167.7 |
| C | 3 | 202 | 1880 | 6.86 | 725 | 729 | 167.7 |
| D | 1 | 52 | 487864 | 2877.84 | 712 | 694 | 169.3 |
| D | 2 | 234 | 19437 | 110.72 | 712 | 694 | 169.3 |
| D | 2 | 14 | 8899 | 48.47 | 712 | 694 | 169.3 |
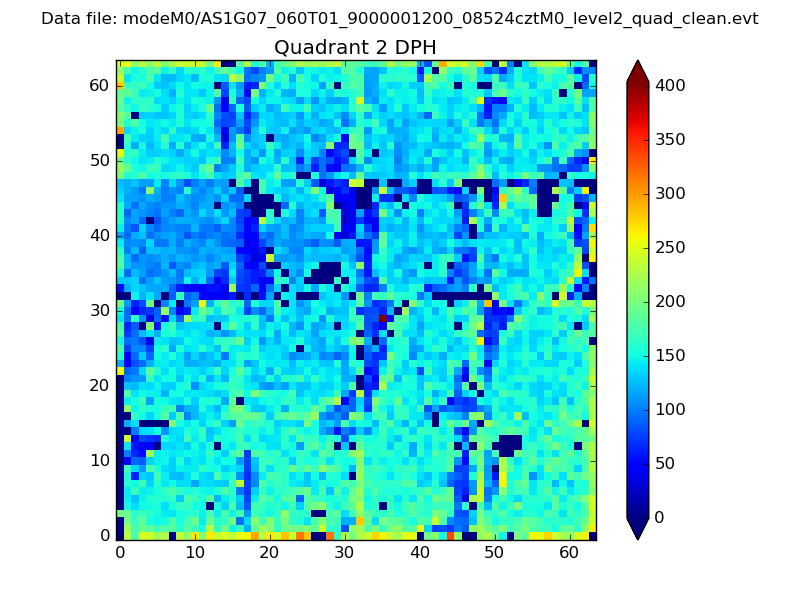
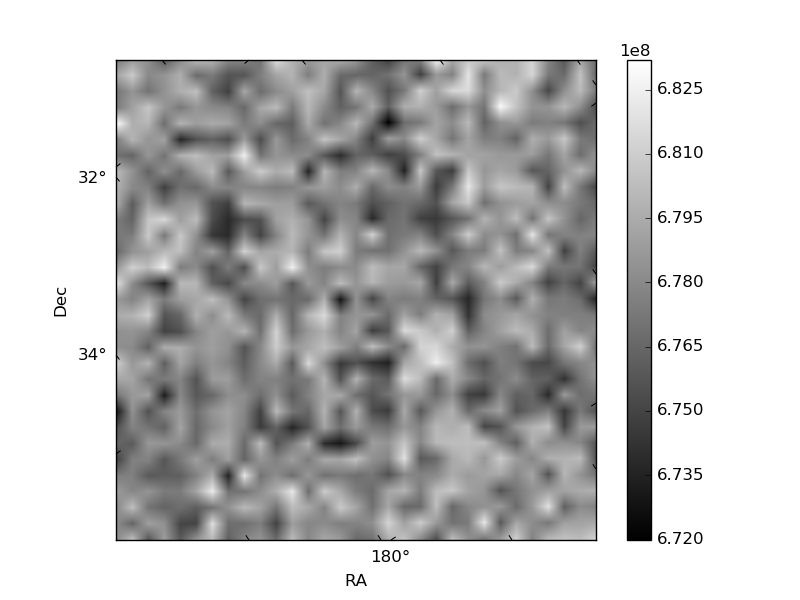
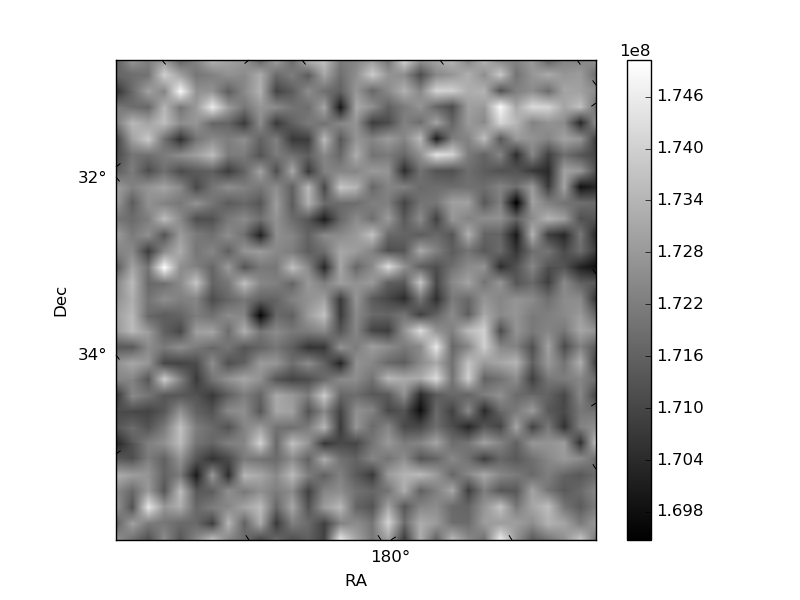
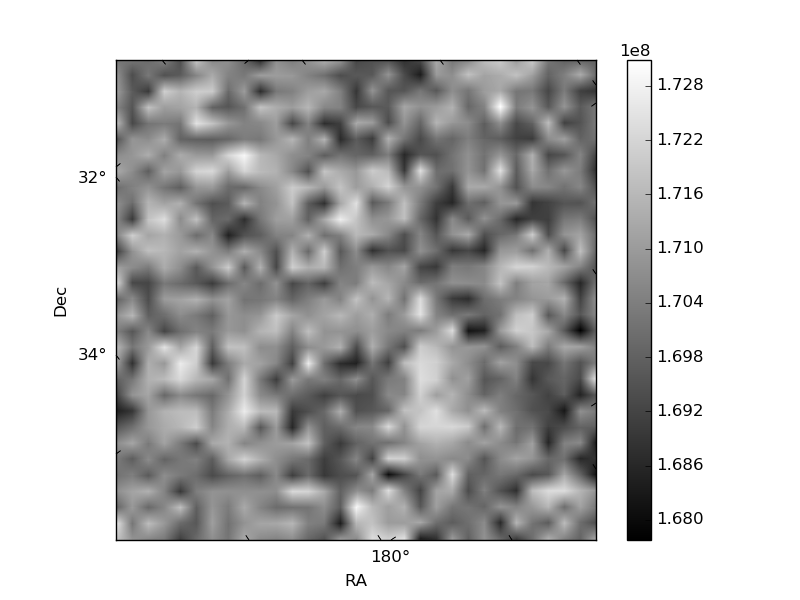
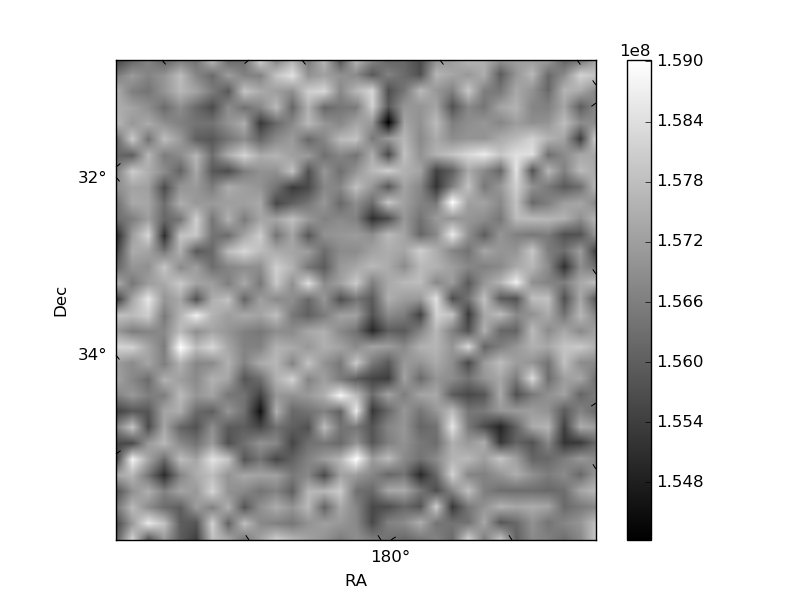
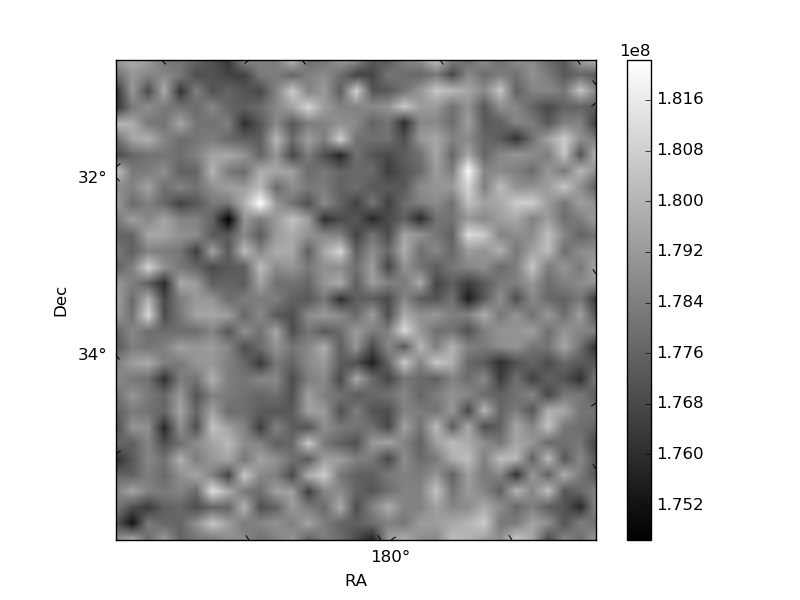
Histogram calculated using DETX and DETY for each event in the final _common_clean file
| Quadrant A | 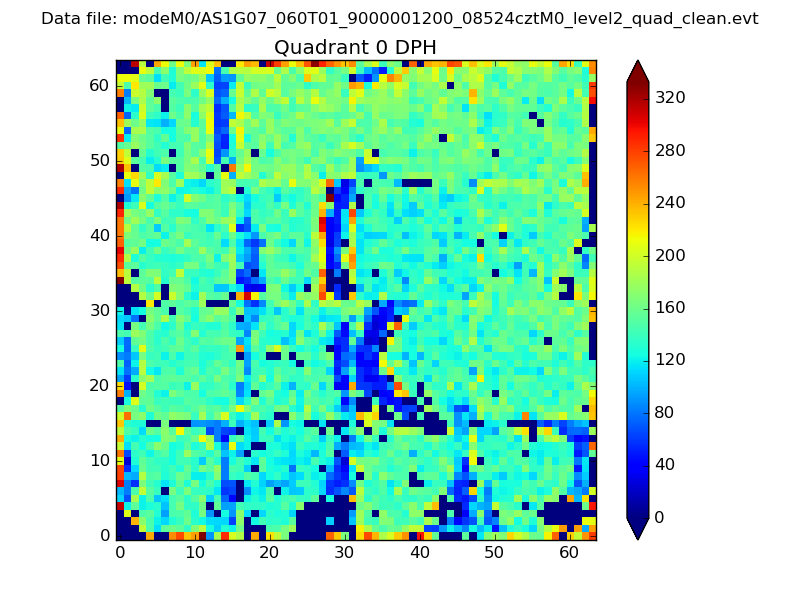 |
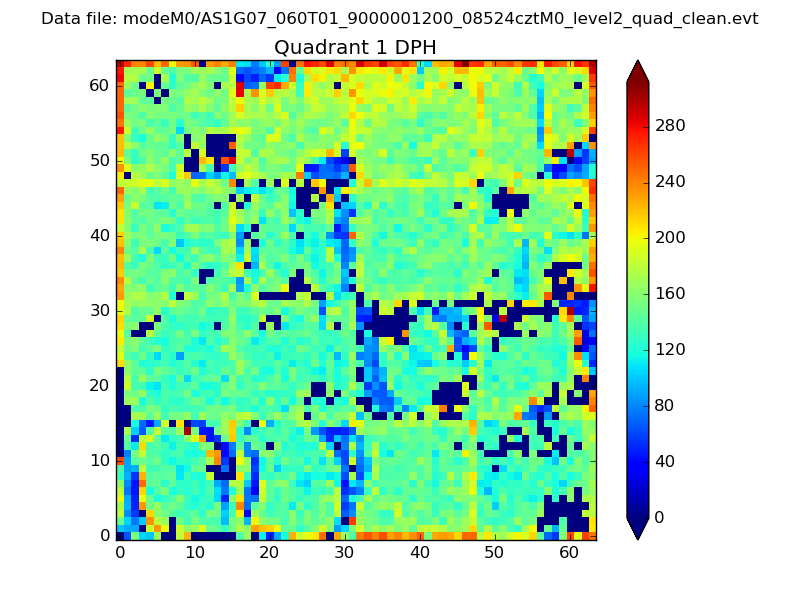 |
Quadrant B |
|---|---|---|---|
| Quadrant D | 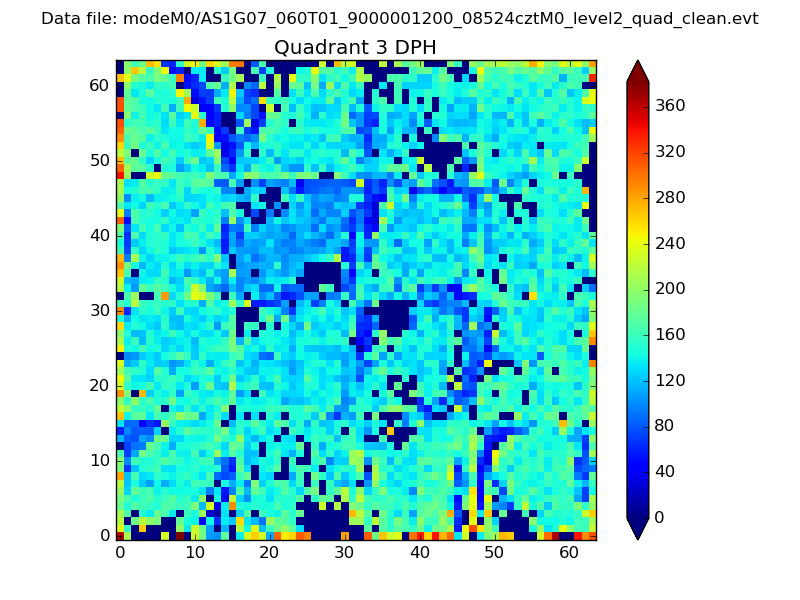 |
 |
Quadrant C |
| Plot type | Count rate plots | Images |
|---|---|---|
| Comparison with Poisson distribution Blue bars denote a histogram of data divided into 1 sec bins. Red curve is a Poisson curve with rate = median count rate of data. |
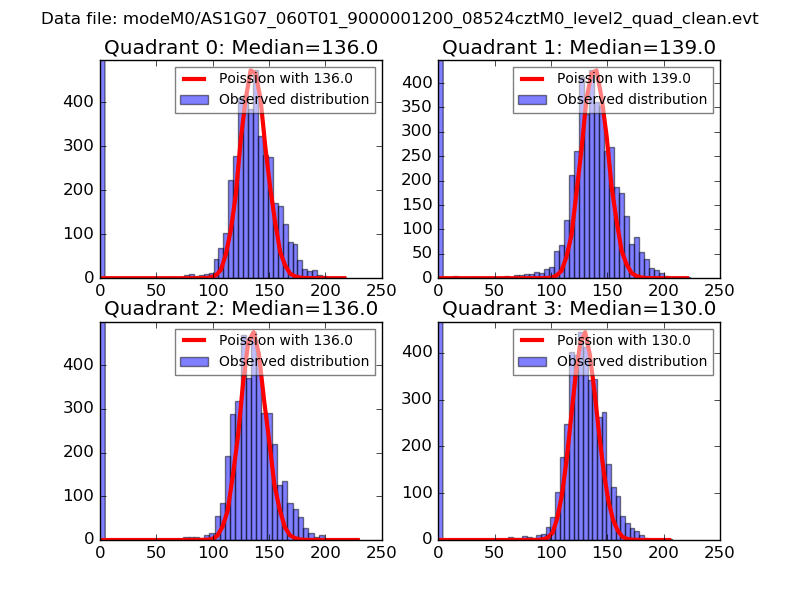 |
 |
| Quadrant-wise count rates Data is divided into 100 sec bins |
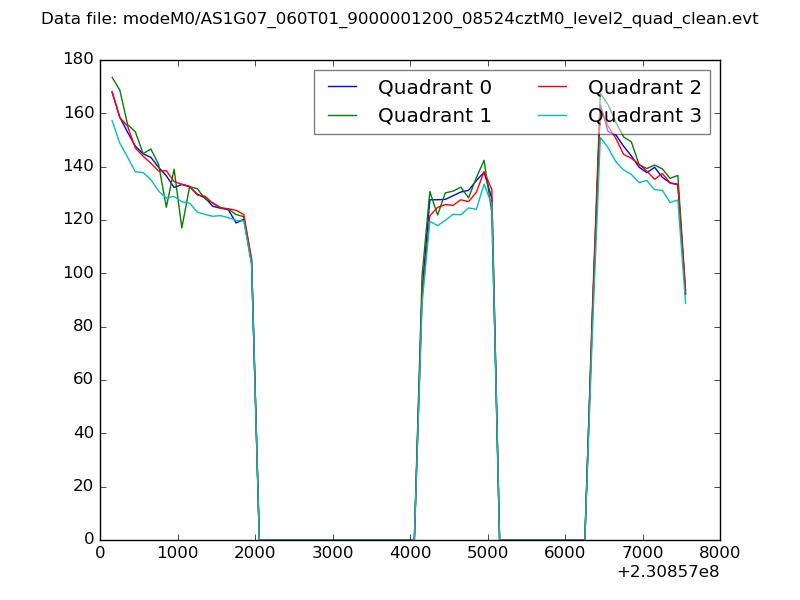 |
|
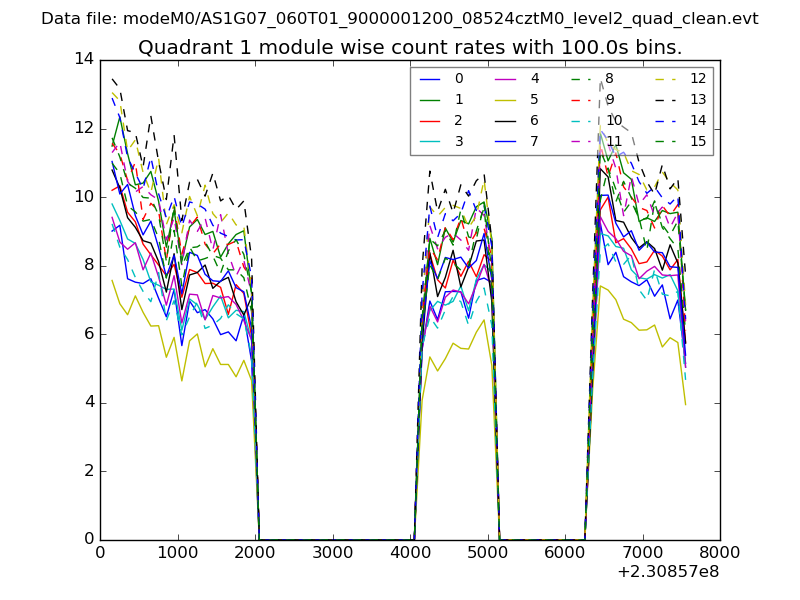
| Module-wise count rates for Quadrant A Data is divided into 100 sec bins |
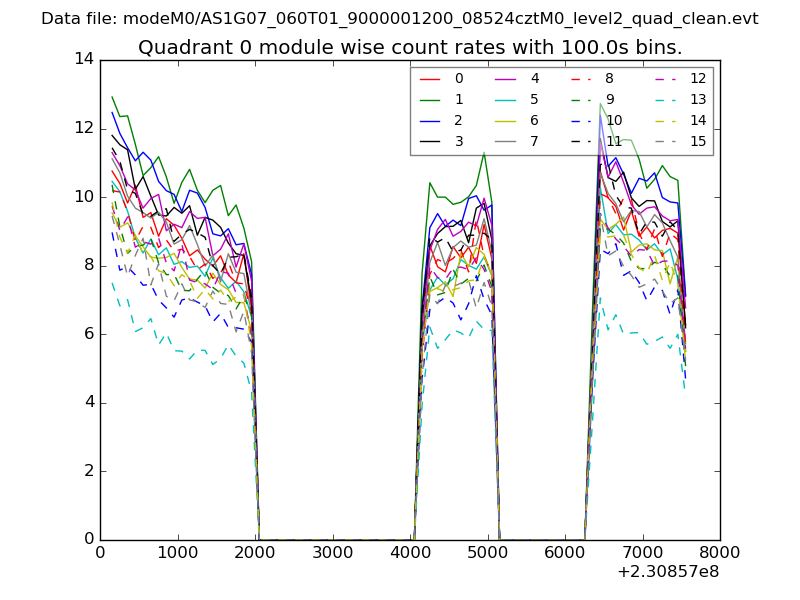 |
 |
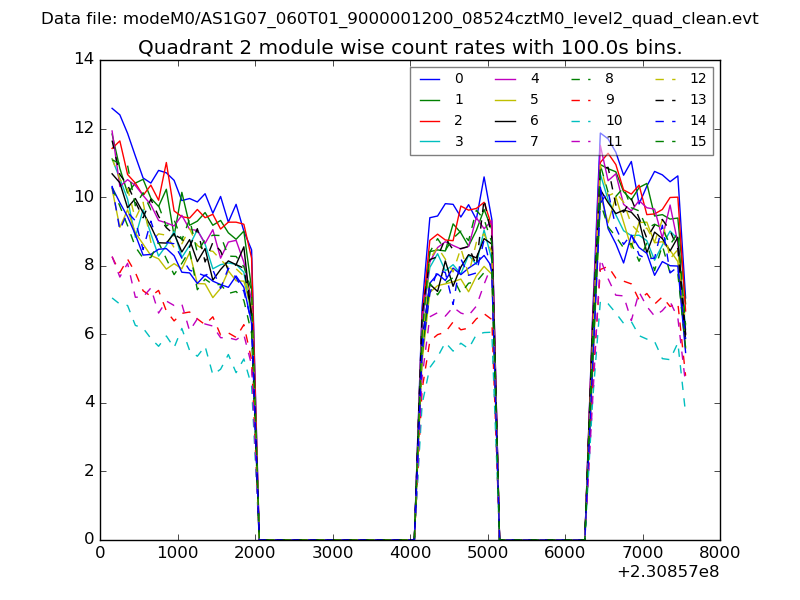
| Module-wise count rates for Quadrant B Data is divided into 100 sec bins |
 |
 |
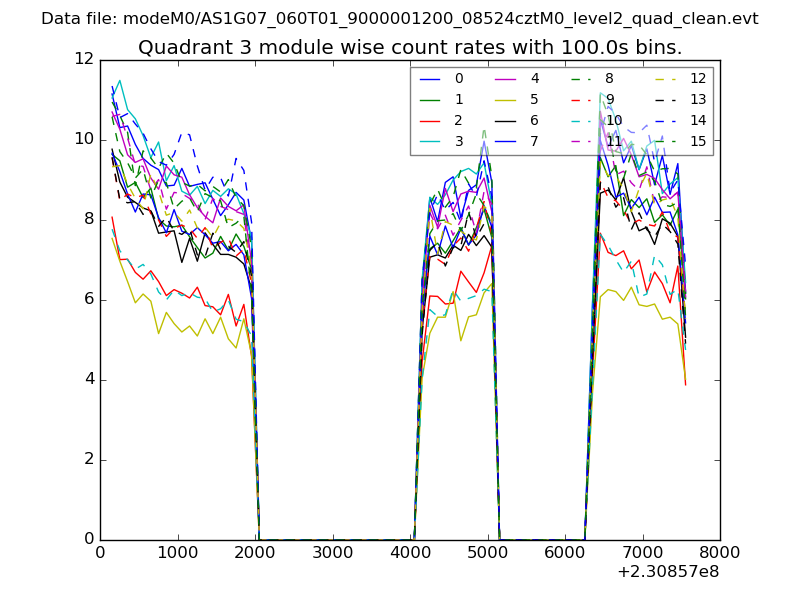
| Module-wise count rates for Quadrant C Data is divided into 100 sec bins |
 |
 |
| Module-wise count rates for Quadrant D Data is divided into 100 sec bins |
 |
 |
| Parameter | Plot |
|---|---|
| CZT HV Monitor | 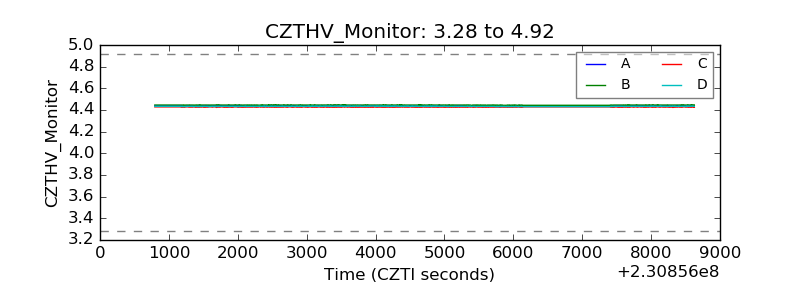 |
| D_VDD | 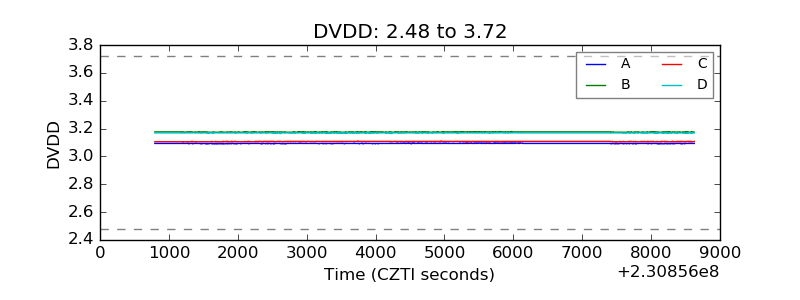 |
| Temperature 1 | 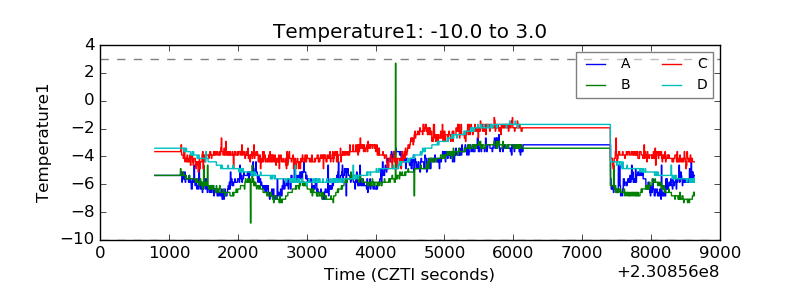 |
| Veto HV Monitor | 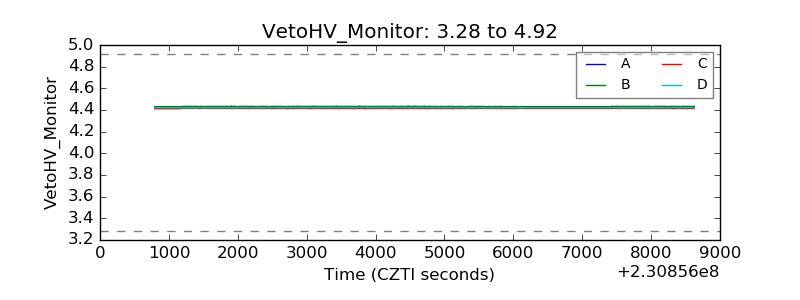 |
| Veto LLD |  |
| Alpha Counter | 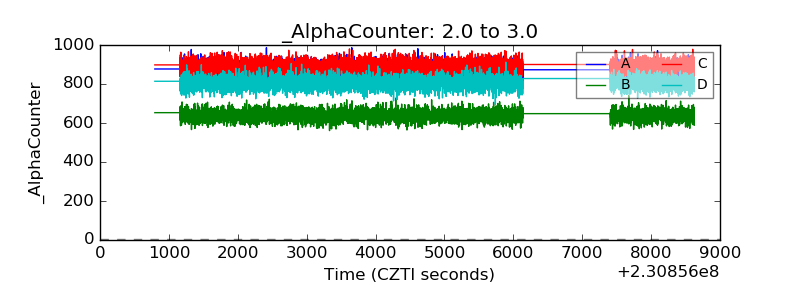 |
| _CPM_Rate | 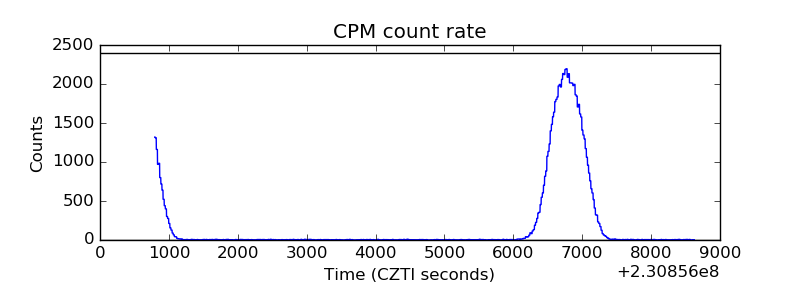 |
| CZT Counter | 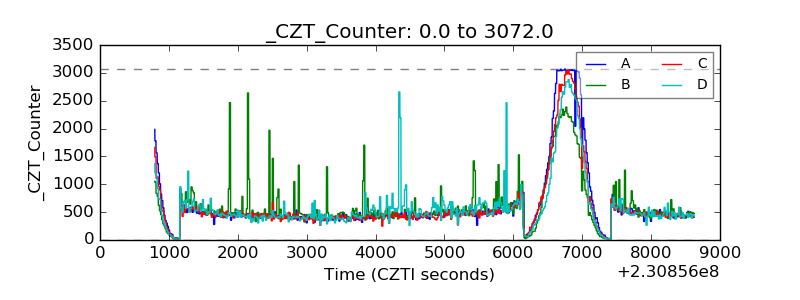 |
| +2.5 Volts monitor |  |
| +5 Volts monitor |  |
| _ROLL_ROT |  |
| _Roll_DEC | 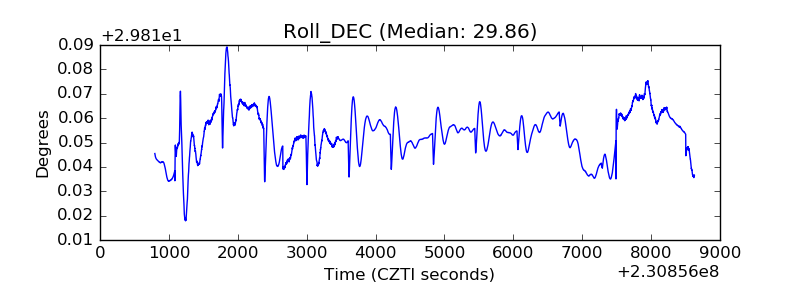 |
| _Roll_RA | 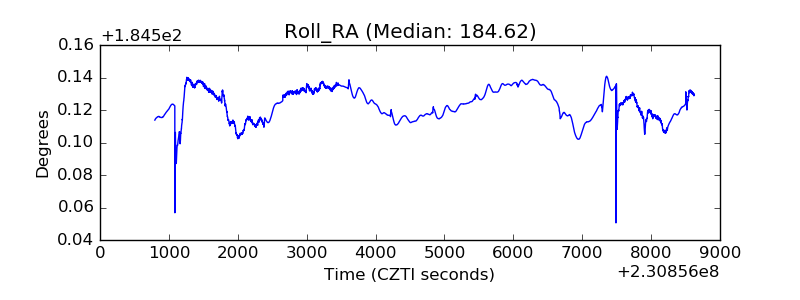 |
| Veto Counter | 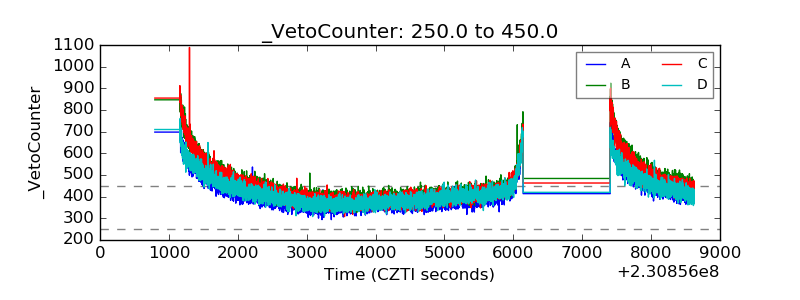 |