| Param | Original file | Final file |
|---|---|---|
| Filename | modeM0/AS1G07_060T01_9000001200_08525cztM0_level2.evt | modeM0/AS1G07_060T01_9000001200_08525cztM0_level2_quad_clean.evt |
| Size (bytes) | 405,953,280 | 83,983,680 |
| Size | 387.1 MB | 80.1 MB |
| Events in quadrant A | 2,887,917 | 532,797 |
| Events in quadrant B | 3,279,778 | 541,955 |
| Events in quadrant C | 2,829,531 | 529,763 |
| Events in quadrant D | 2,876,202 | 506,867 |
| Mode SS | |||
|---|---|---|---|
| Quadrant | BADHDUFLAG | Total packets | Discarded packets |
| A | 0 | 126 | 0 |
| B | 0 | 126 | 0 |
| C | 0 | 126 | 0 |
| D | 0 | 126 | 0 |
| Mode M0 | |||
|---|---|---|---|
| Quadrant | BADHDUFLAG | Total packets | Discarded packets |
| A | 0 | 12658 | 3 |
| B | 0 | 13727 | 2 |
| C | 0 | 12639 | 2 |
| D | 0 | 12979 | 2 |
| Mode M9 | |||
|---|---|---|---|
| Quadrant | BADHDUFLAG | Total packets | Discarded packets |
| A | 0 | 16 | 0 |
| B | 0 | 16 | 0 |
| C | 0 | 16 | 0 |
| D | 0 | 17 | 0 |
| Quadrant | Total seconds | Saturated seconds | Saturation percentage |
|---|---|---|---|
| A | 6187 | 26 | 0.420236% |
| B | 6187 | 82 | 1.325360% |
| C | 6187 | 12 | 0.193955% |
| D | 6187 | 15 | 0.242444% |
Noise dominated data is calculated using 1-second bins in cleaned event files. If a bin has >2000 counts, and if more than 50% of those come from <1% of pixels, then it is considered to be noise-dominated and hence unusable.
| Quadrant | # 1 sec bins | Bins with >0 counts | Bins with >2000 counts | High rate bins dominated by noise | Noise dominated (total time) | Noise dominated (detector-on time) | Marked lightcurve |
|---|---|---|---|---|---|---|---|
| A | 7512 | 6189 | 0 | 0 | 0.00% | 0.00% | 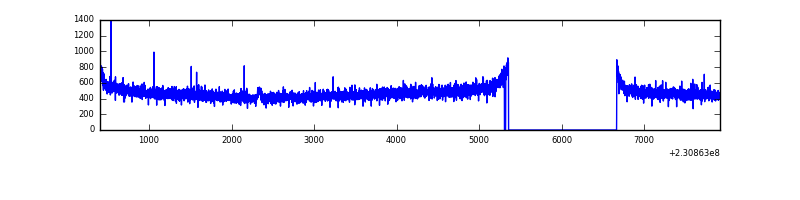 |
| B | 7512 | 6189 | 45 | 45 | 0.60% | 0.73% | 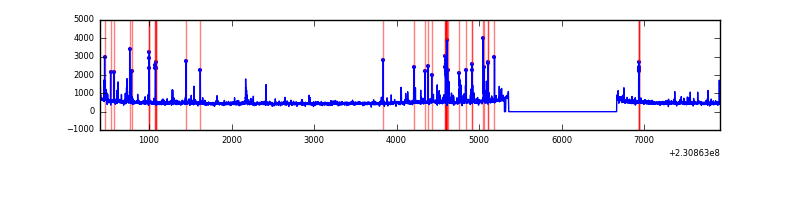 |
| C | 7512 | 6189 | 0 | 0 | 0.00% | 0.00% | 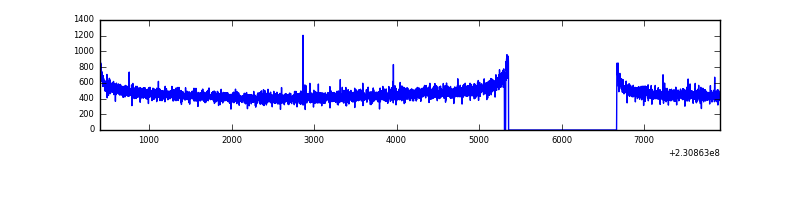 |
| D | 7512 | 6189 | 8 | 8 | 0.11% | 0.13% | 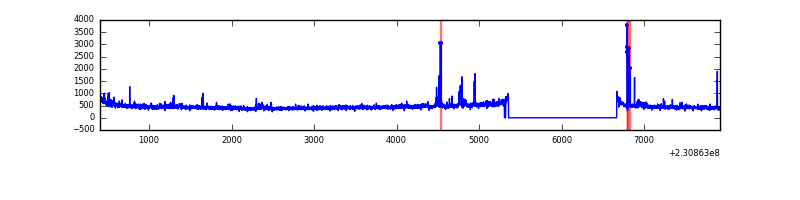 |
Top three noisy pixels from each quadrant. If the there are fewer than three noisy pixels in the level2.evt file, extra rows are filled as -1
| Pixel properties | Quadrant properties | ||||||
|---|---|---|---|---|---|---|---|
| Quadrant | DetID | PixID | Counts | Sigma | Mean | Median | Sigma |
| A | 15 | 236 | 7226 | 42.72 | 746 | 731 | 152.0 |
| A | 0 | 226 | 6827 | 40.1 | 746 | 731 | 152.0 |
| A | 8 | 5 | 6733 | 39.48 | 746 | 731 | 152.0 |
| B | 10 | 16 | 238752 | 1680.63 | 750 | 733 | 141.6 |
| B | 0 | 214 | 42703 | 296.35 | 750 | 733 | 141.6 |
| B | 5 | 255 | 35951 | 248.67 | 750 | 733 | 141.6 |
| C | 13 | 61 | 5700 | 29.53 | 724 | 727 | 168.4 |
| C | 8 | 222 | 2462 | 10.3 | 724 | 727 | 168.4 |
| C | 3 | 202 | 1844 | 6.63 | 724 | 727 | 168.4 |
| D | 1 | 52 | 88511 | 504.63 | 711 | 692 | 174.0 |
| D | 9 | 64 | 47820 | 270.81 | 711 | 692 | 174.0 |
| D | 2 | 234 | 18078 | 99.9 | 711 | 692 | 174.0 |
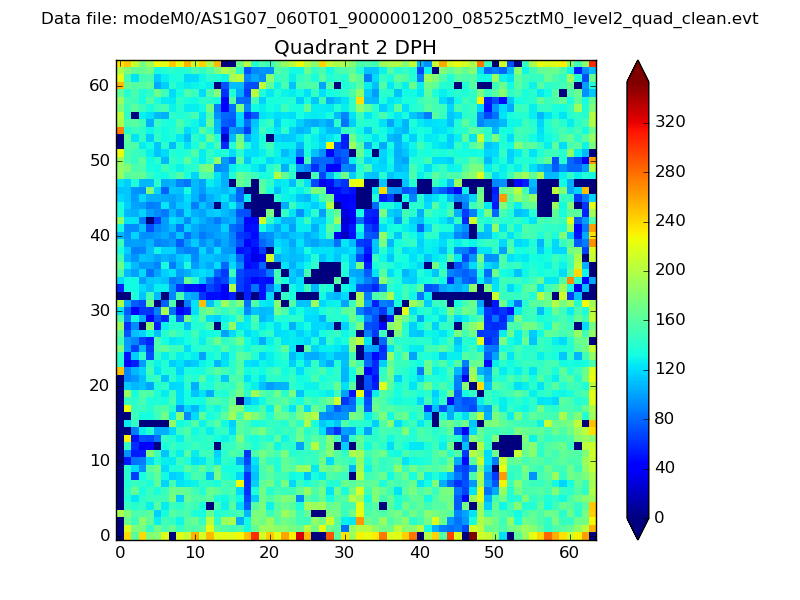
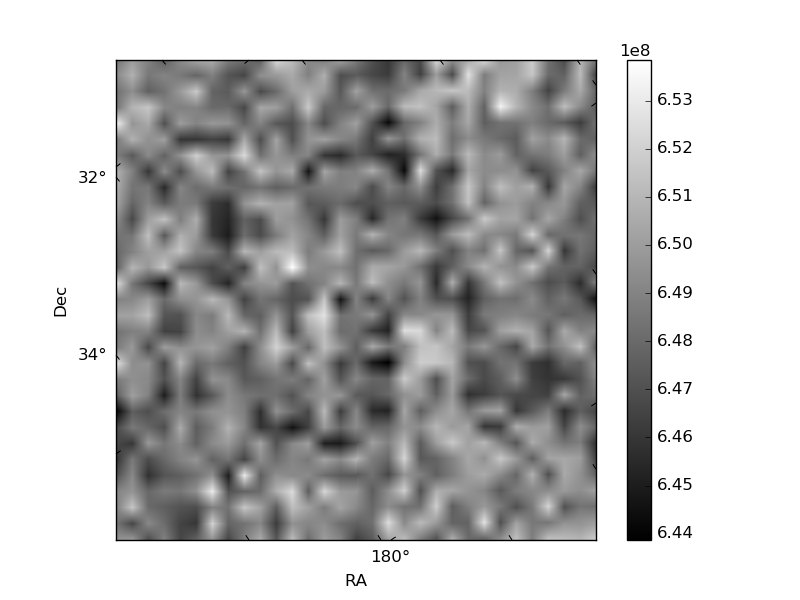
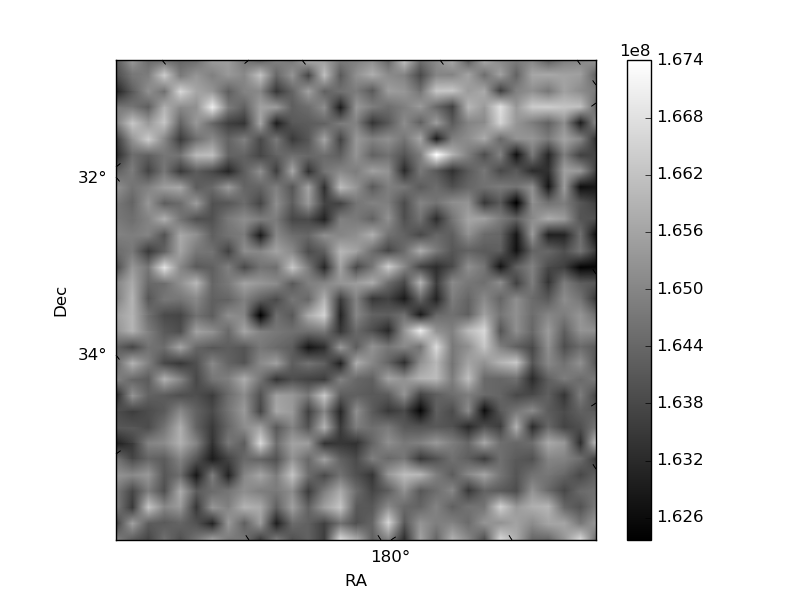
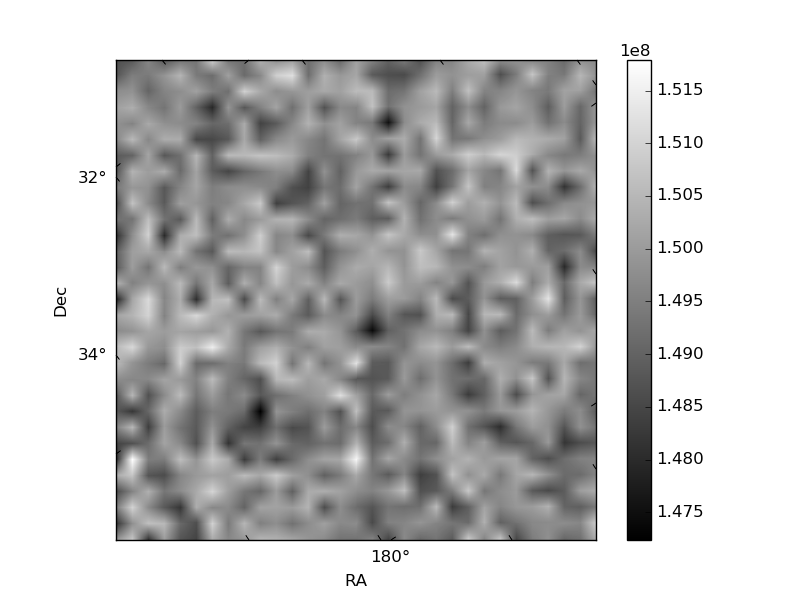
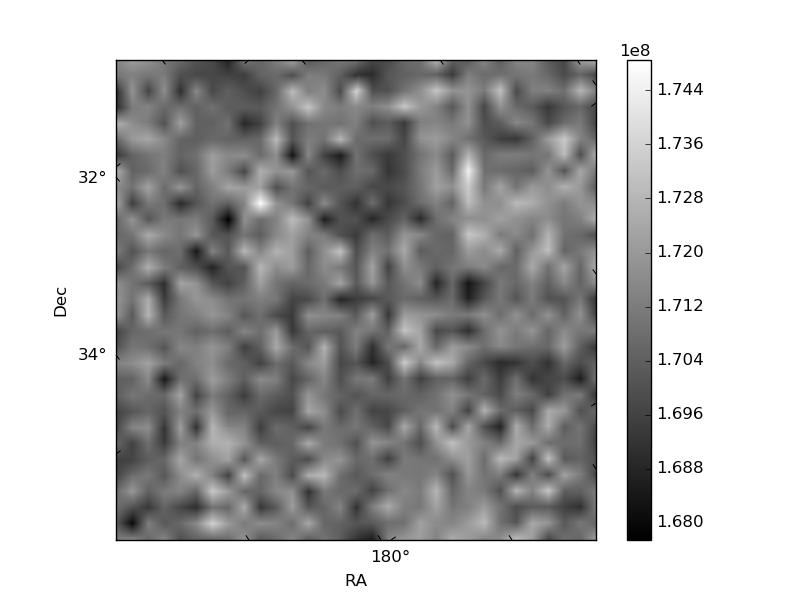
Histogram calculated using DETX and DETY for each event in the final _common_clean file
| Quadrant A | 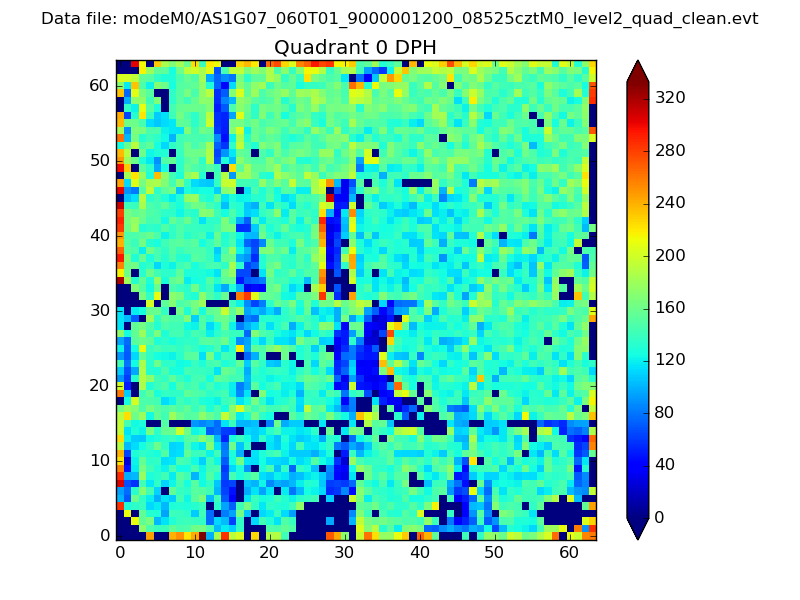 |
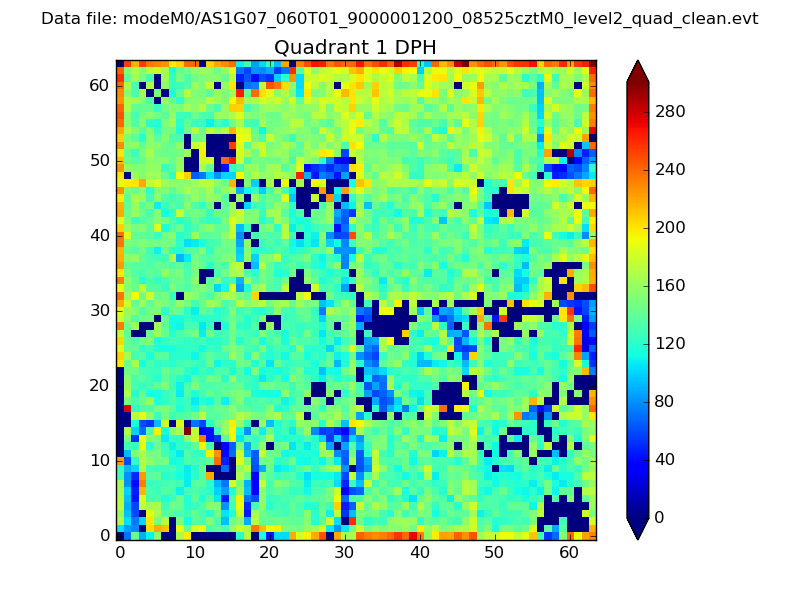 |
Quadrant B |
|---|---|---|---|
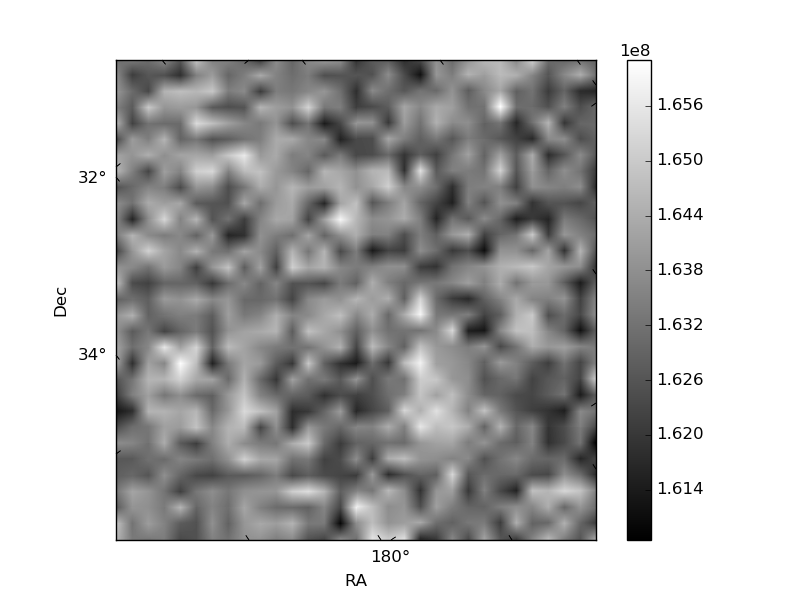
| Quadrant D | 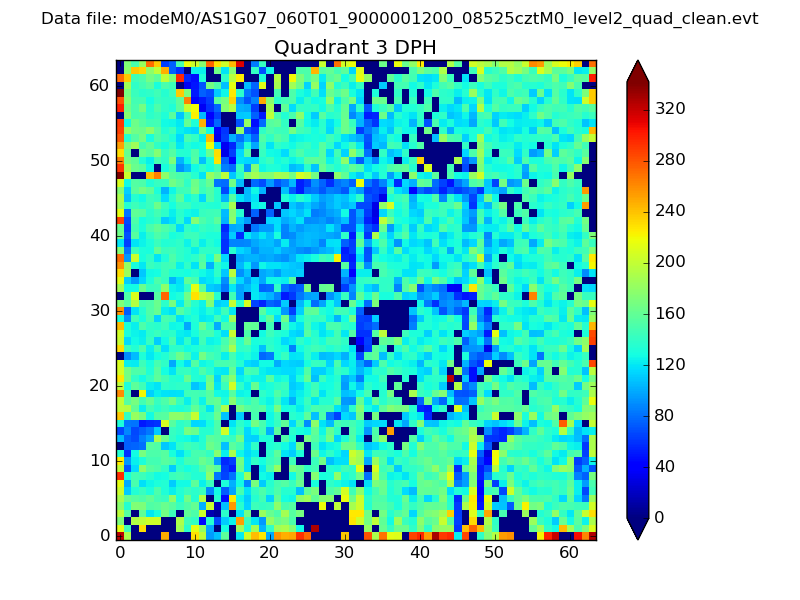 |
 |
Quadrant C |
| Plot type | Count rate plots | Images |
|---|---|---|
| Comparison with Poisson distribution Blue bars denote a histogram of data divided into 1 sec bins. Red curve is a Poisson curve with rate = median count rate of data. |
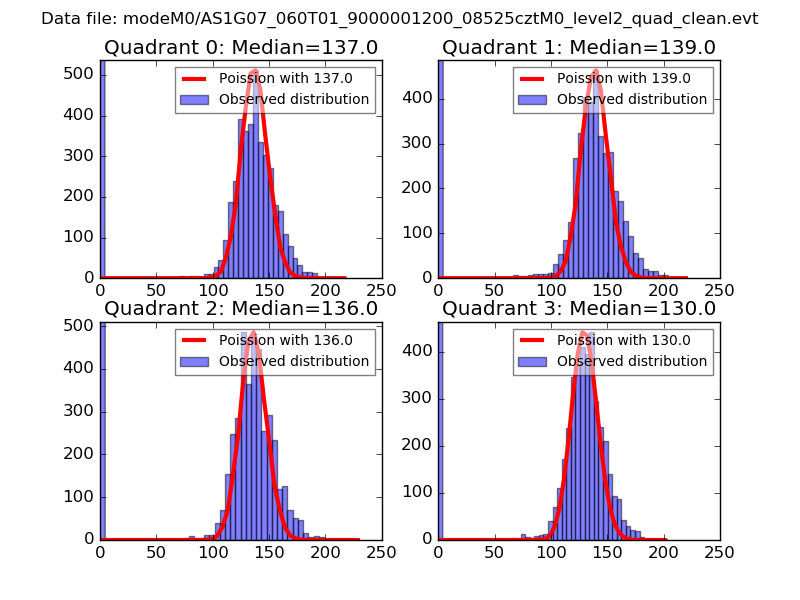 |
 |
| Quadrant-wise count rates Data is divided into 100 sec bins |
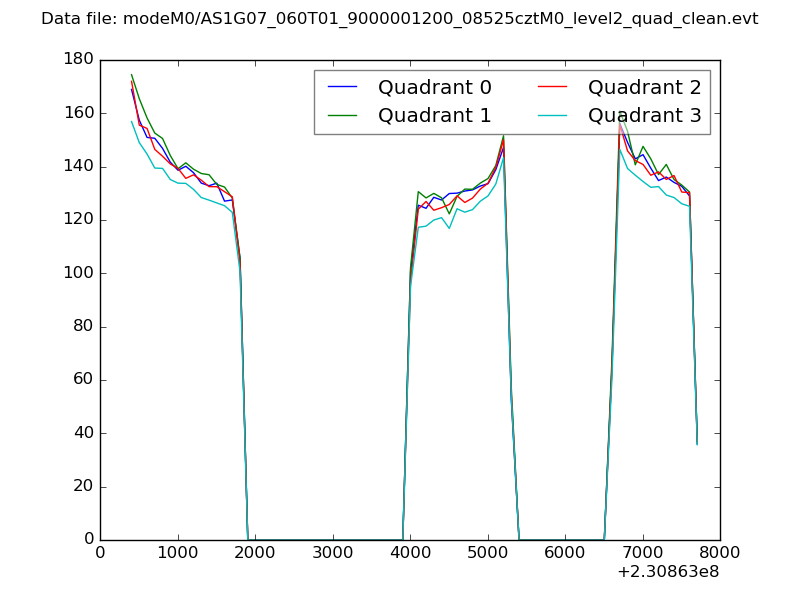 |
|
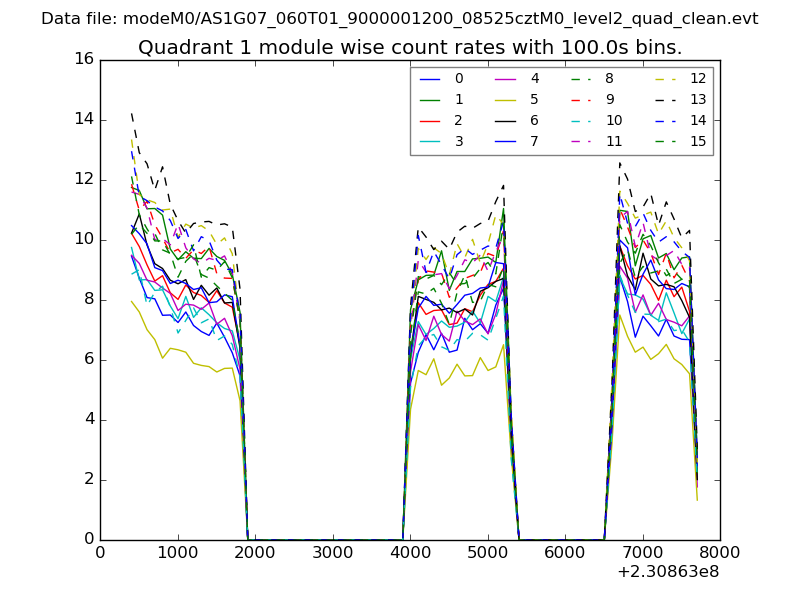
| Module-wise count rates for Quadrant A Data is divided into 100 sec bins |
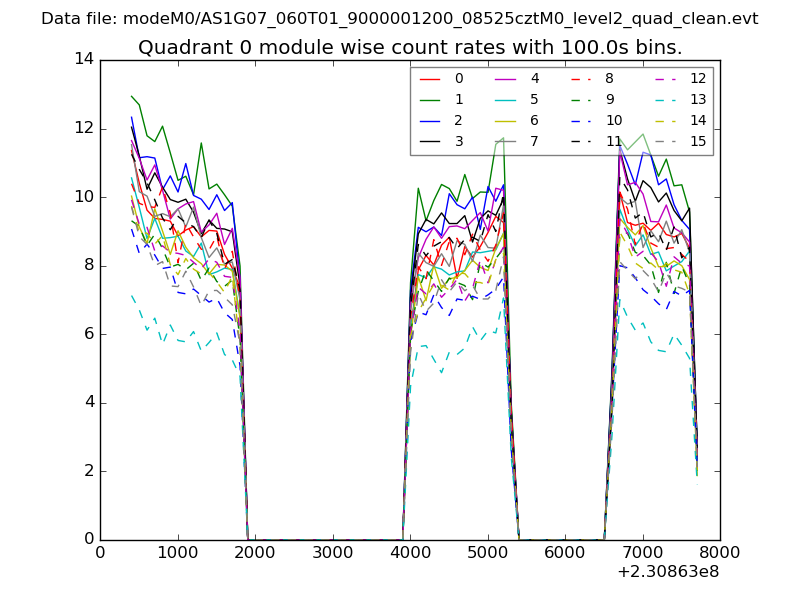 |
 |
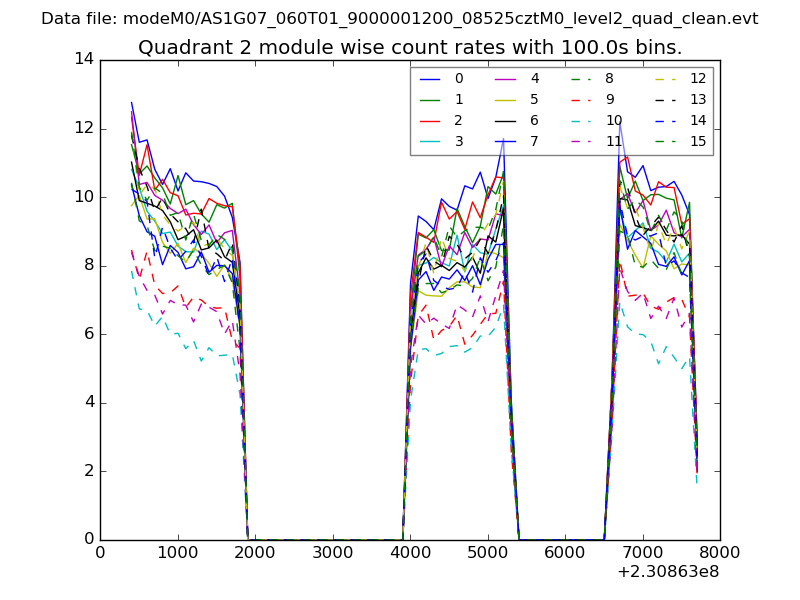
| Module-wise count rates for Quadrant B Data is divided into 100 sec bins |
 |
 |
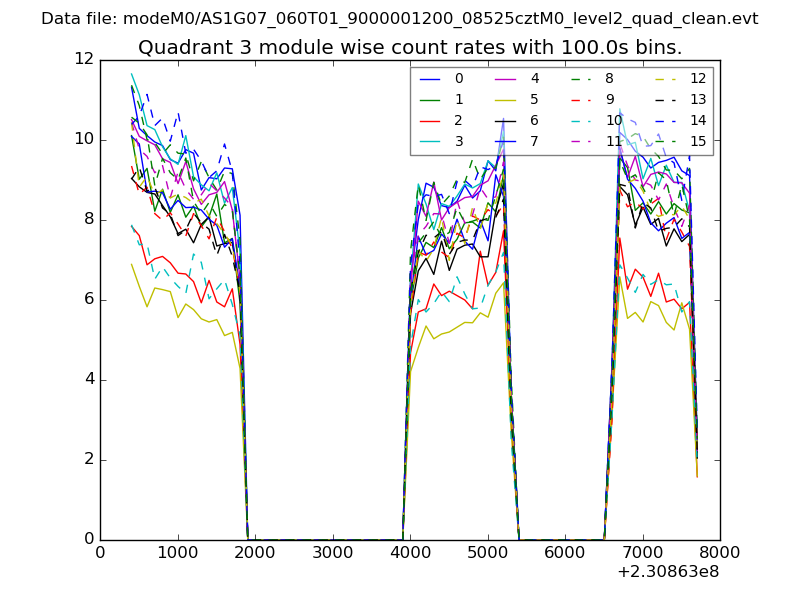
| Module-wise count rates for Quadrant C Data is divided into 100 sec bins |
 |
 |
| Module-wise count rates for Quadrant D Data is divided into 100 sec bins |
 |
 |
| Parameter | Plot |
|---|---|
| CZT HV Monitor | 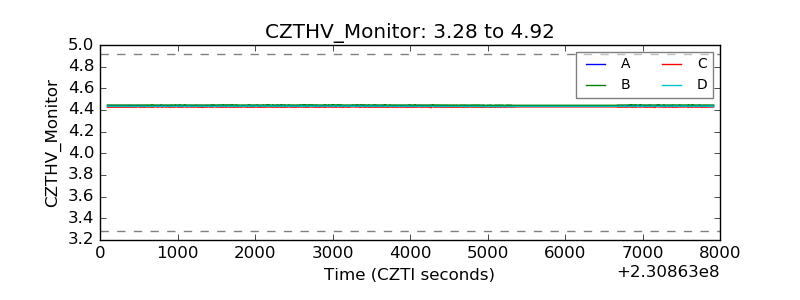 |
| D_VDD | 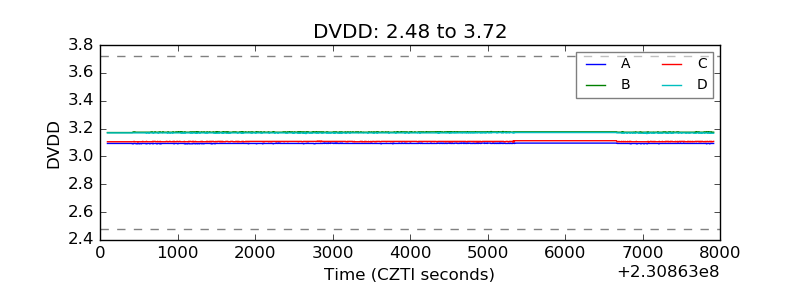 |
| Temperature 1 | 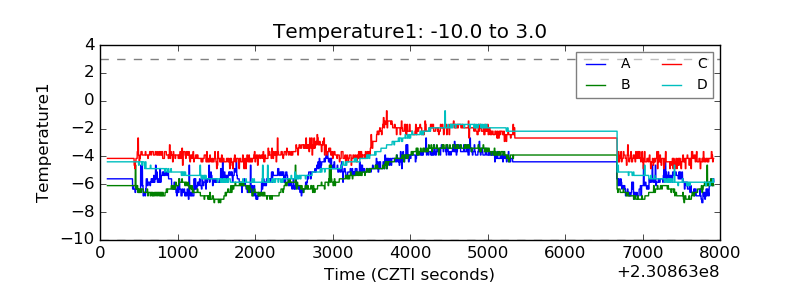 |
| Veto HV Monitor | 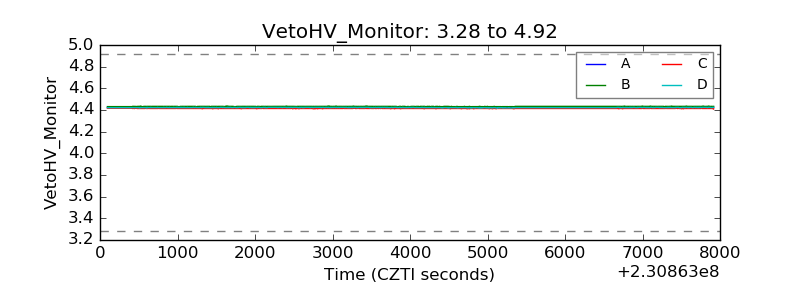 |
| Veto LLD | 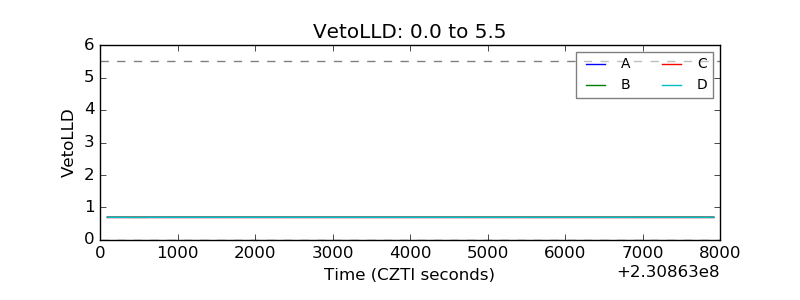 |
| Alpha Counter | 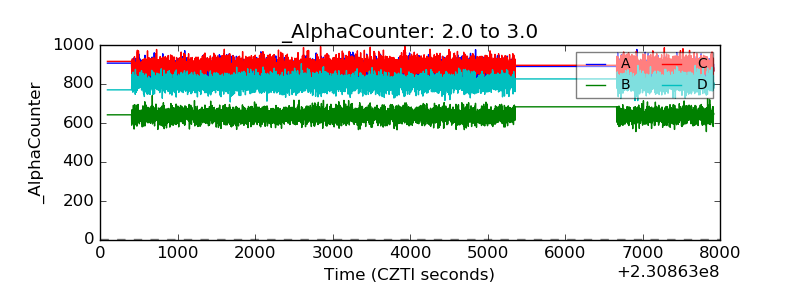 |
| _CPM_Rate | 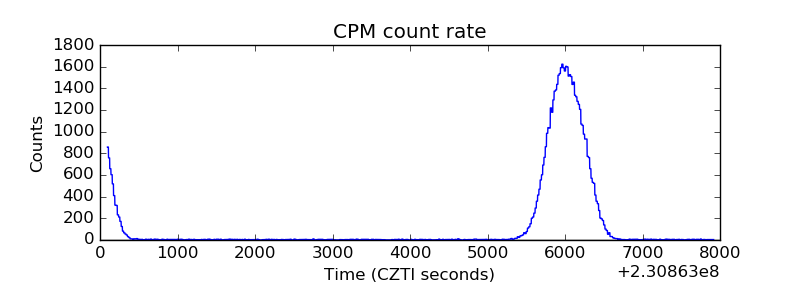 |
| CZT Counter | 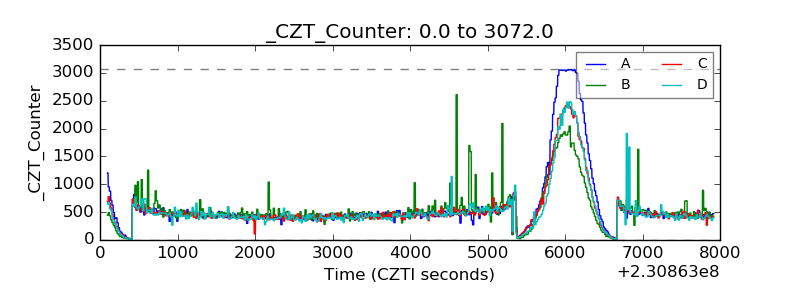 |
| +2.5 Volts monitor |  |
| +5 Volts monitor |  |
| _ROLL_ROT | 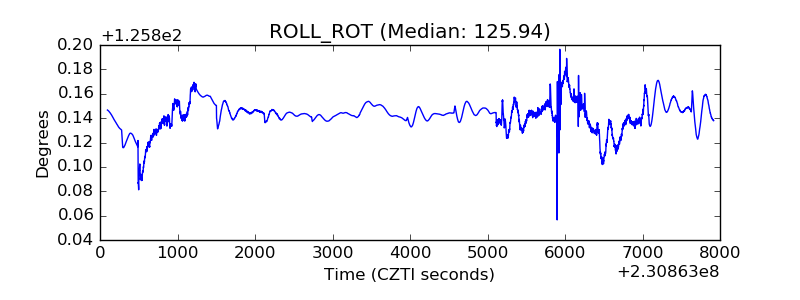 |
| _Roll_DEC | 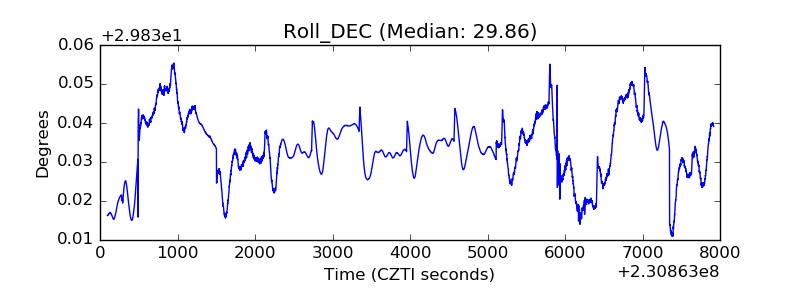 |
| _Roll_RA | 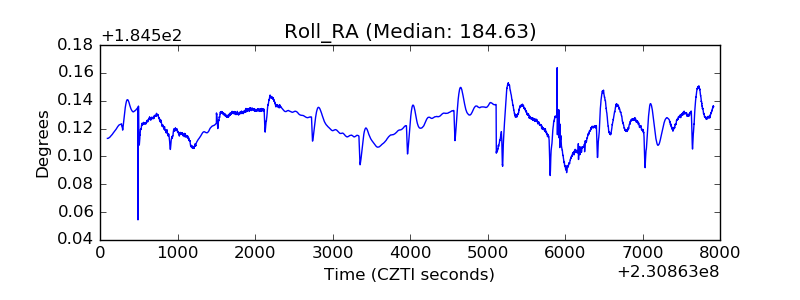 |
| Veto Counter | 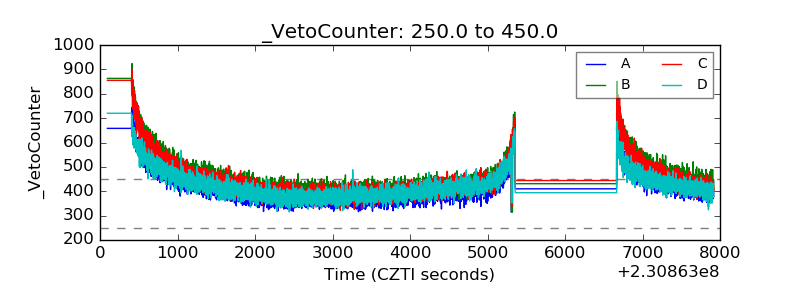 |