| Param | Original file | Final file |
|---|---|---|
| Filename | modeM0/AS1G07_060T01_9000001200_08526cztM0_level2.evt | modeM0/AS1G07_060T01_9000001200_08526cztM0_level2_quad_clean.evt |
| Size (bytes) | 406,805,760 | 76,199,040 |
| Size | 388.0 MB | 72.7 MB |
| Events in quadrant A | 2,893,743 | 475,024 |
| Events in quadrant B | 3,111,004 | 482,527 |
| Events in quadrant C | 2,807,933 | 469,405 |
| Events in quadrant D | 3,087,803 | 449,894 |
| Mode SS | |||
|---|---|---|---|
| Quadrant | BADHDUFLAG | Total packets | Discarded packets |
| A | 0 | 124 | 0 |
| B | 0 | 124 | 0 |
| C | 0 | 124 | 0 |
| D | 0 | 124 | 0 |
| Mode M0 | |||
|---|---|---|---|
| Quadrant | BADHDUFLAG | Total packets | Discarded packets |
| A | 0 | 12714 | 33 |
| B | 0 | 13206 | 38 |
| C | 0 | 12654 | 32 |
| D | 0 | 13615 | 33 |
| Mode M9 | |||
|---|---|---|---|
| Quadrant | BADHDUFLAG | Total packets | Discarded packets |
| A | 0 | 13 | 0 |
| B | 0 | 13 | 0 |
| C | 0 | 13 | 0 |
| D | 0 | 14 | 0 |
| Quadrant | Total seconds | Saturated seconds | Saturation percentage |
|---|---|---|---|
| A | 6172 | 30 | 0.486066% |
| B | 6169 | 74 | 1.199546% |
| C | 6172 | 12 | 0.194426% |
| D | 6173 | 34 | 0.550786% |
Noise dominated data is calculated using 1-second bins in cleaned event files. If a bin has >2000 counts, and if more than 50% of those come from <1% of pixels, then it is considered to be noise-dominated and hence unusable.
| Quadrant | # 1 sec bins | Bins with >0 counts | Bins with >2000 counts | High rate bins dominated by noise | Noise dominated (total time) | Noise dominated (detector-on time) | Marked lightcurve |
|---|---|---|---|---|---|---|---|
| A | 7427 | 6188 | 0 | 0 | 0.00% | 0.00% | 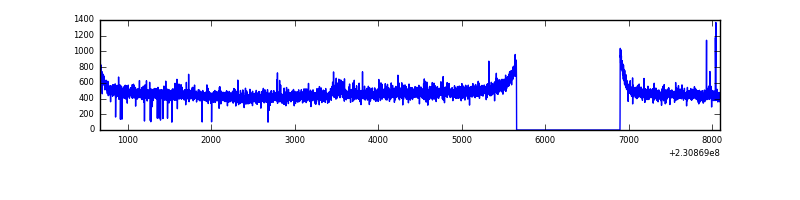 |
| B | 7427 | 6187 | 25 | 25 | 0.34% | 0.40% | 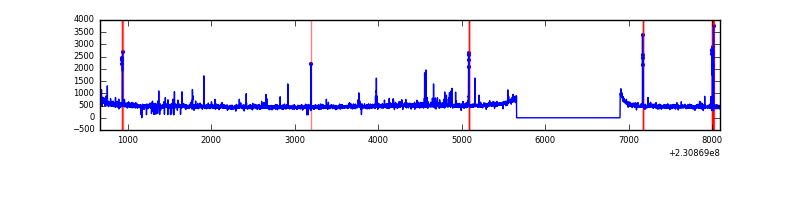 |
| C | 7427 | 6188 | 0 | 0 | 0.00% | 0.00% | 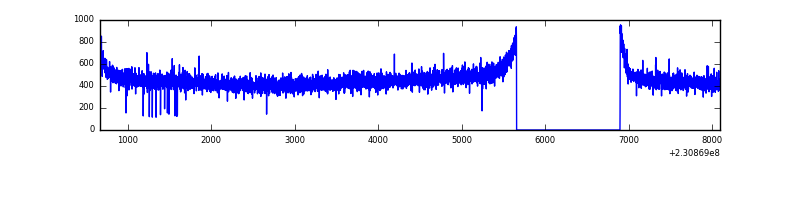 |
| D | 7427 | 6188 | 10 | 10 | 0.13% | 0.16% | 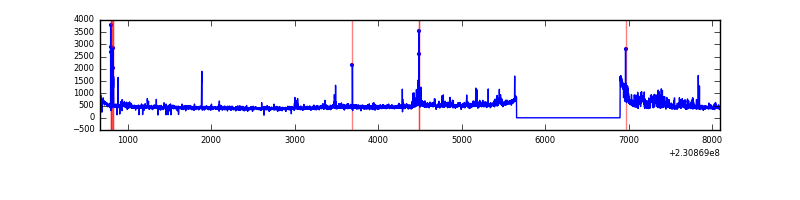 |
Top three noisy pixels from each quadrant. If the there are fewer than three noisy pixels in the level2.evt file, extra rows are filled as -1
| Pixel properties | Quadrant properties | ||||||
|---|---|---|---|---|---|---|---|
| Quadrant | DetID | PixID | Counts | Sigma | Mean | Median | Sigma |
| A | 15 | 236 | 16214 | 102.02 | 745 | 730 | 151.8 |
| A | 0 | 226 | 6861 | 40.4 | 745 | 730 | 151.8 |
| A | 15 | 174 | 6712 | 39.41 | 745 | 730 | 151.8 |
| B | 10 | 16 | 103027 | 723.94 | 746 | 728 | 141.3 |
| B | 0 | 214 | 40957 | 284.69 | 746 | 728 | 141.3 |
| B | 4 | 173 | 16823 | 113.9 | 746 | 728 | 141.3 |
| C | 13 | 61 | 5481 | 28.31 | 719 | 723 | 168.1 |
| C | 8 | 222 | 2295 | 9.35 | 719 | 723 | 168.1 |
| C | 3 | 202 | 1835 | 6.62 | 719 | 723 | 168.1 |
| D | 1 | 52 | 308248 | 1753.29 | 707 | 689 | 175.4 |
| D | 9 | 64 | 31560 | 175.98 | 707 | 689 | 175.4 |
| D | 2 | 234 | 17901 | 98.12 | 707 | 689 | 175.4 |
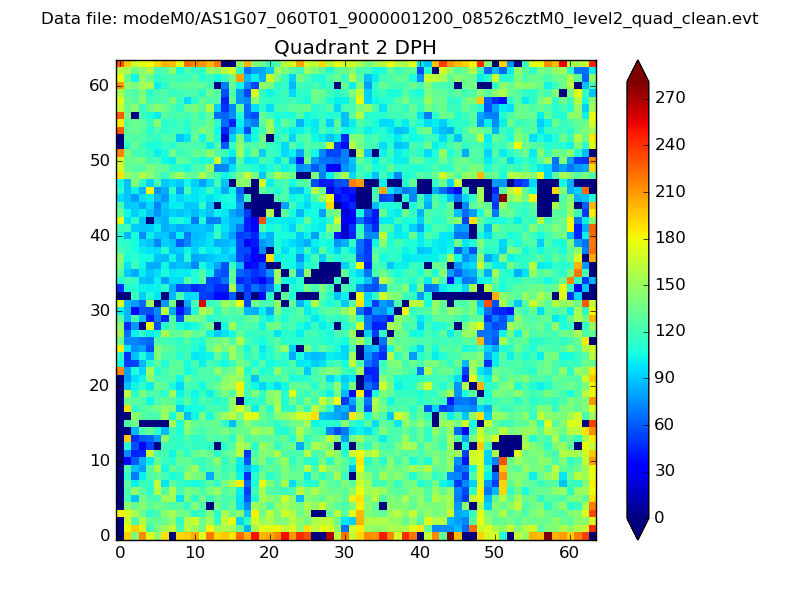
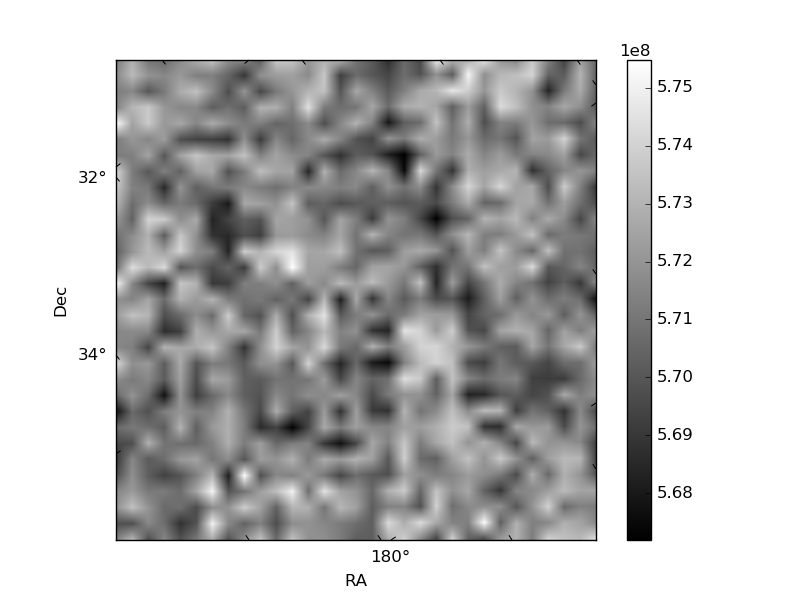
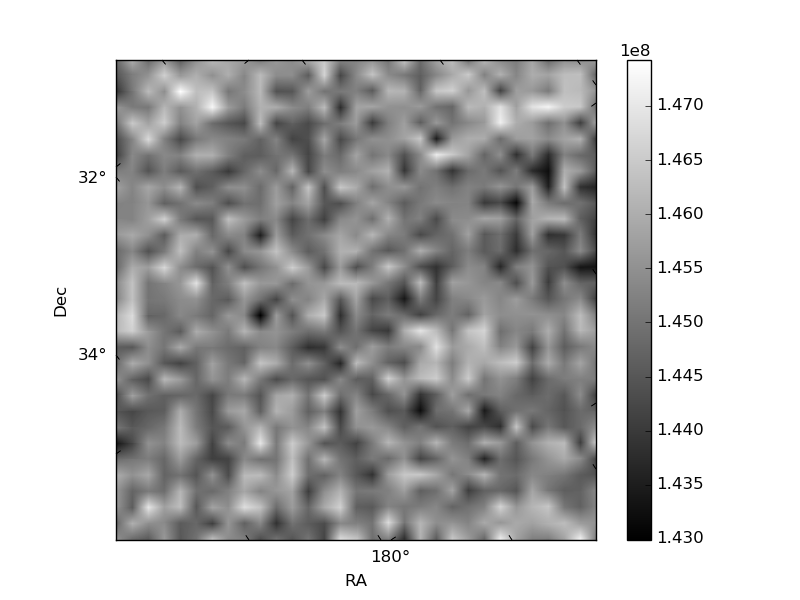
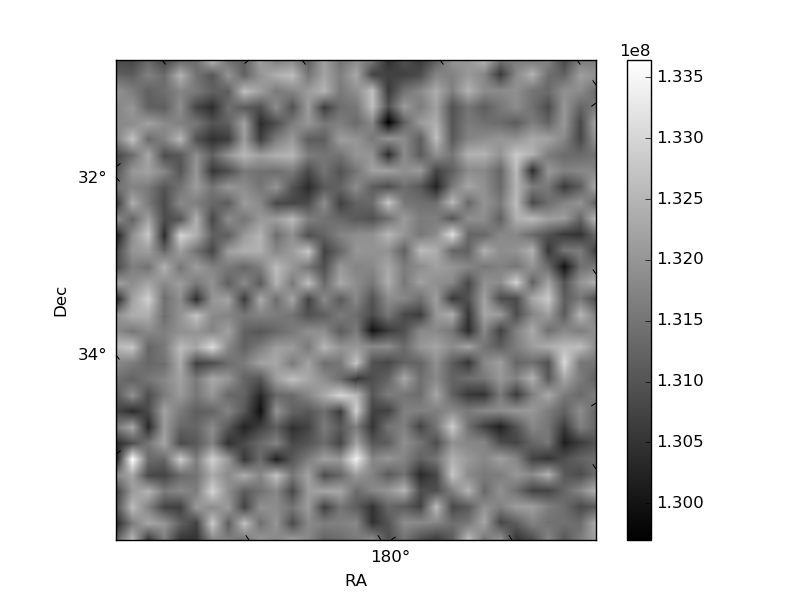
Histogram calculated using DETX and DETY for each event in the final _common_clean file
| Quadrant A | 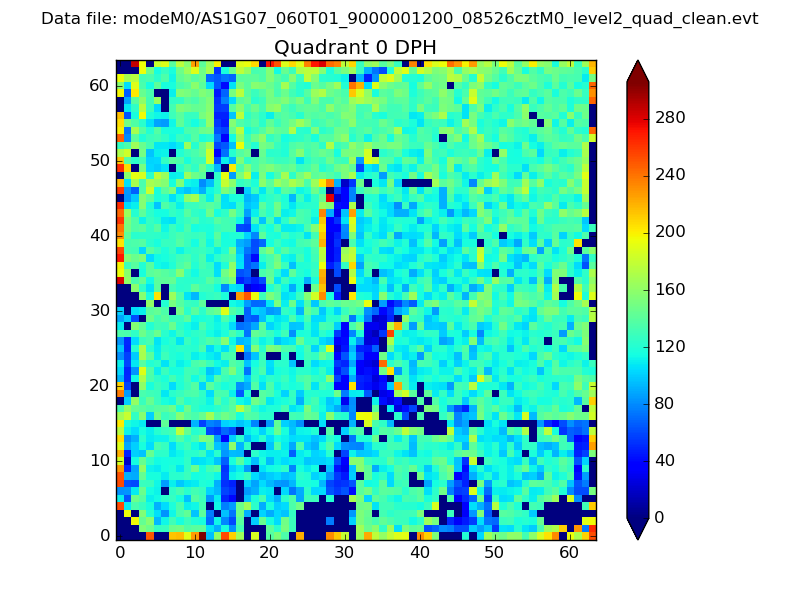 |
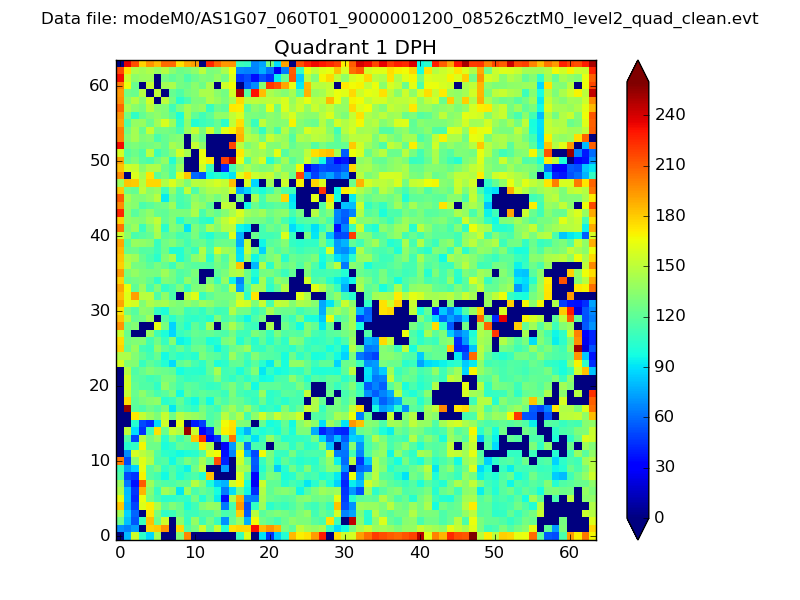 |
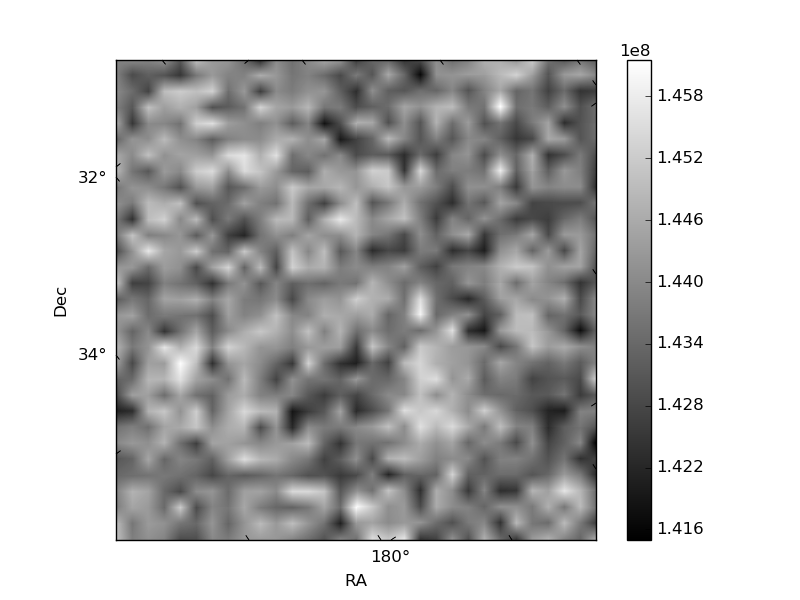
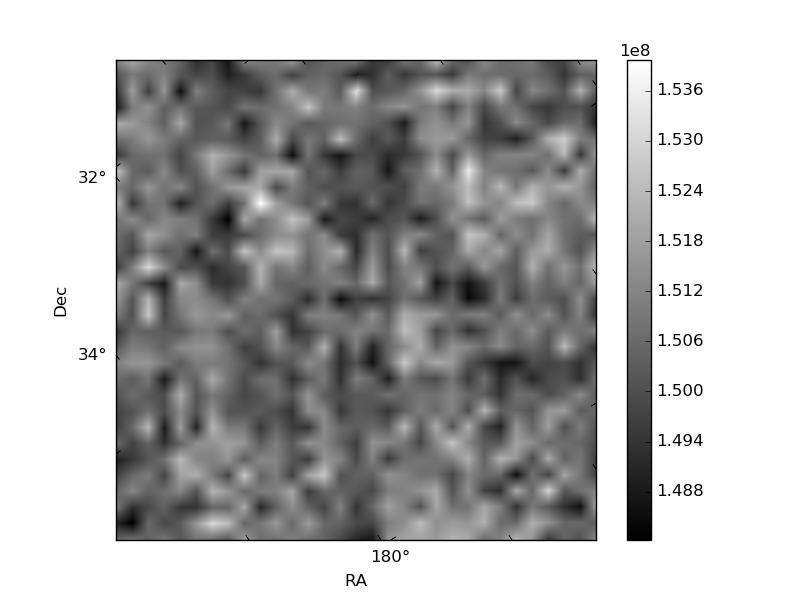
Quadrant B |
|---|---|---|---|
| Quadrant D | 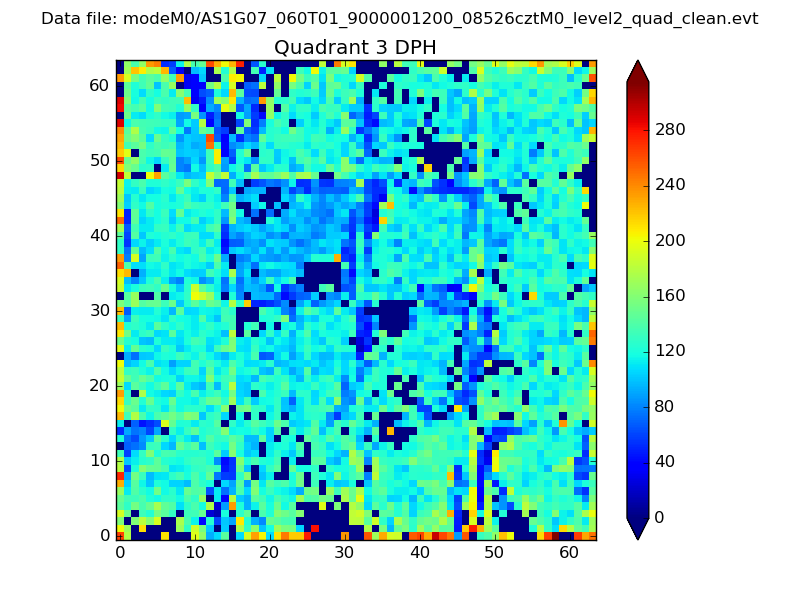 |
 |
Quadrant C |
| Plot type | Count rate plots | Images |
|---|---|---|
| Comparison with Poisson distribution Blue bars denote a histogram of data divided into 1 sec bins. Red curve is a Poisson curve with rate = median count rate of data. |
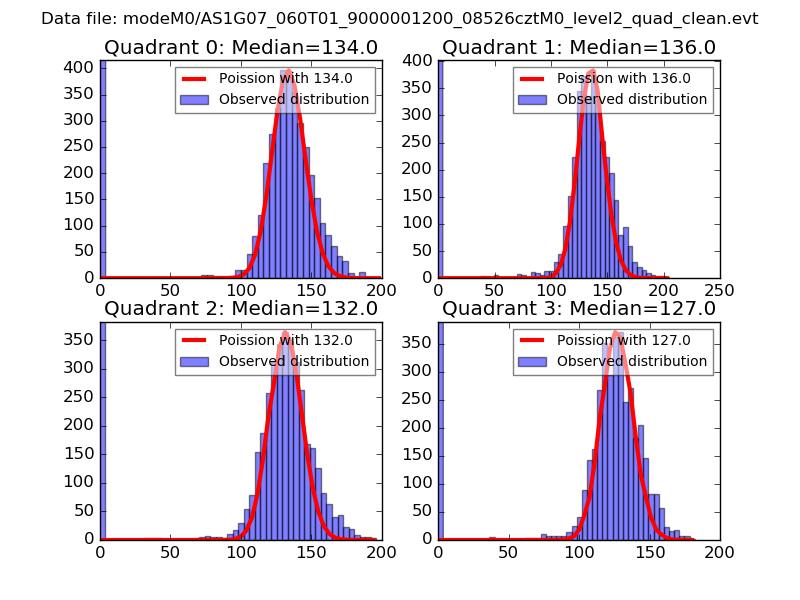 |
 |
| Quadrant-wise count rates Data is divided into 100 sec bins |
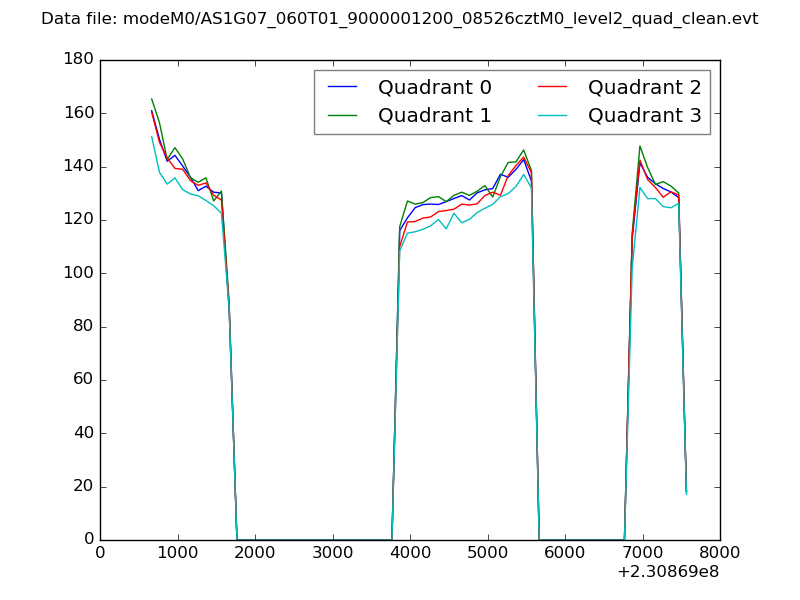 |
|
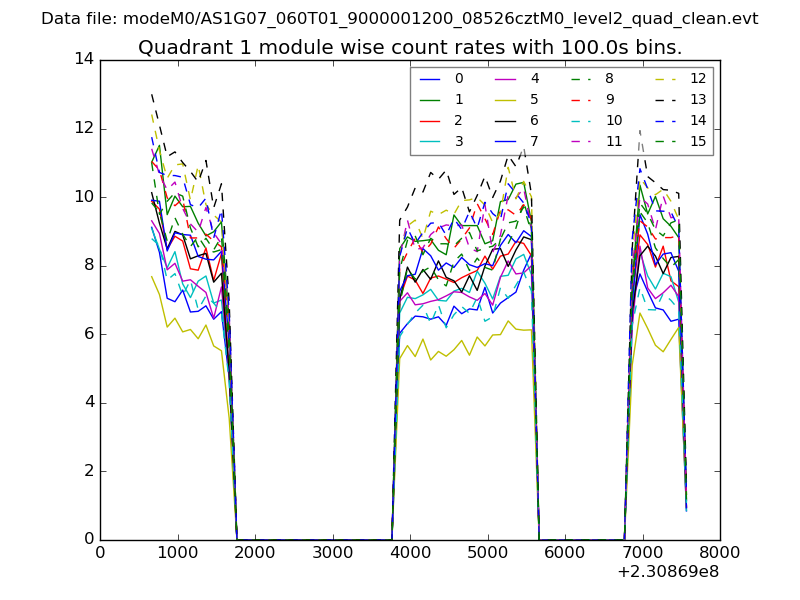
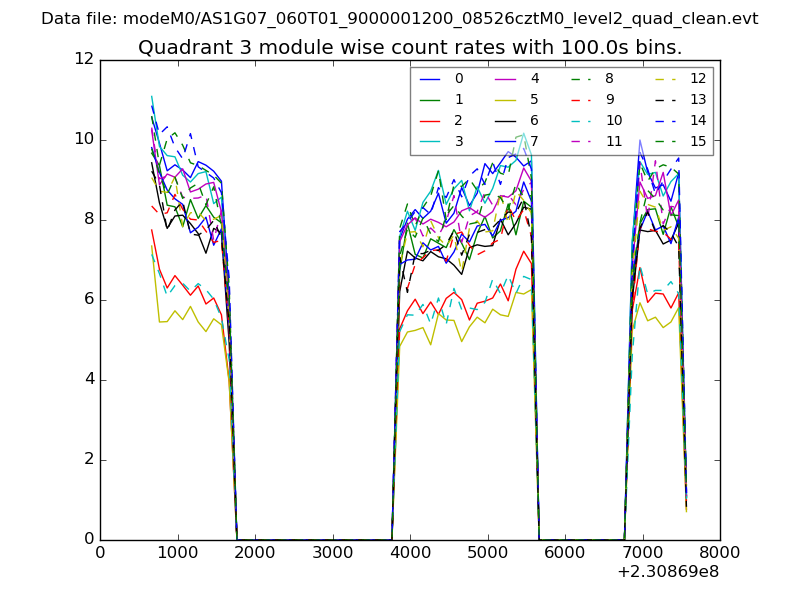
| Module-wise count rates for Quadrant A Data is divided into 100 sec bins |
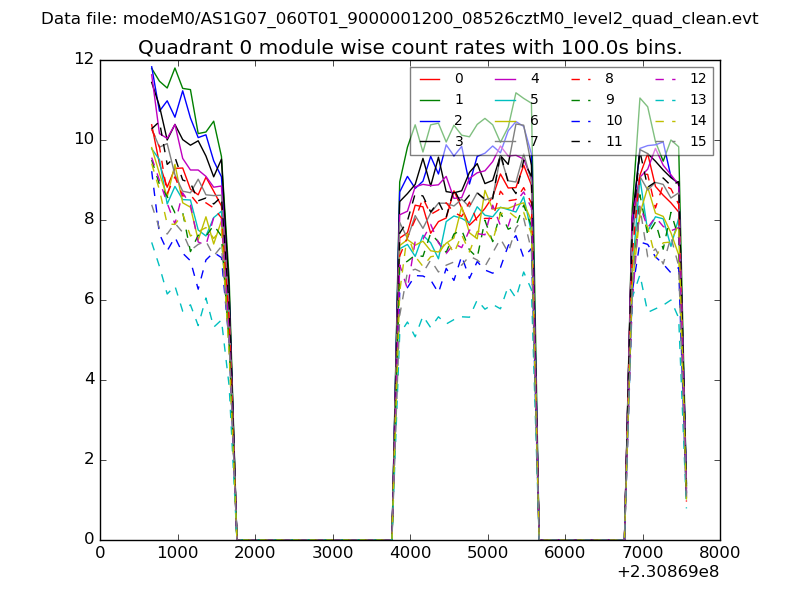 |
 |
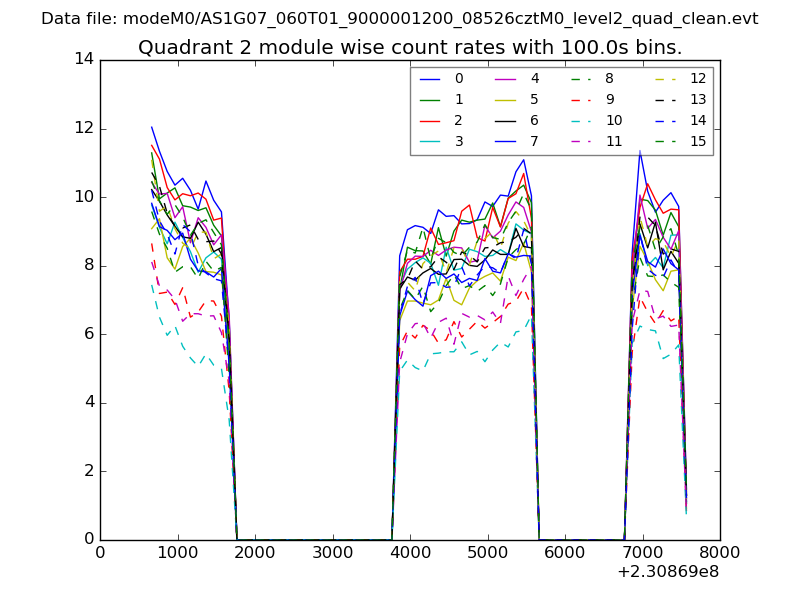
| Module-wise count rates for Quadrant B Data is divided into 100 sec bins |
 |
 |
| Module-wise count rates for Quadrant C Data is divided into 100 sec bins |
 |
 |
| Module-wise count rates for Quadrant D Data is divided into 100 sec bins |
 |
 |
| Parameter | Plot |
|---|---|
| CZT HV Monitor | 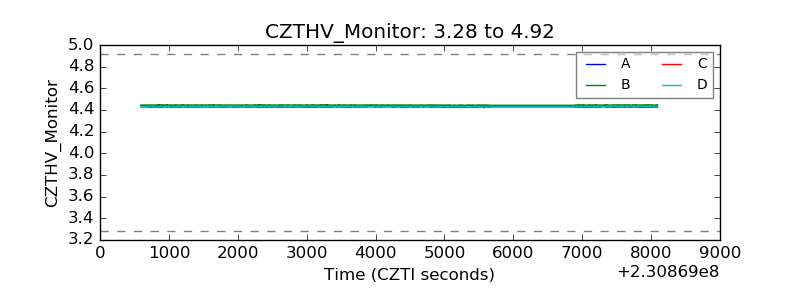 |
| D_VDD | 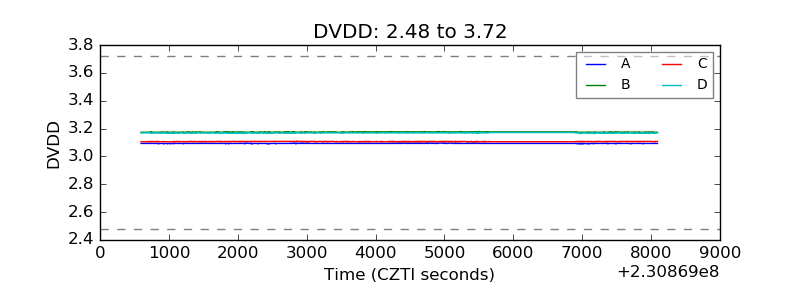 |
| Temperature 1 | 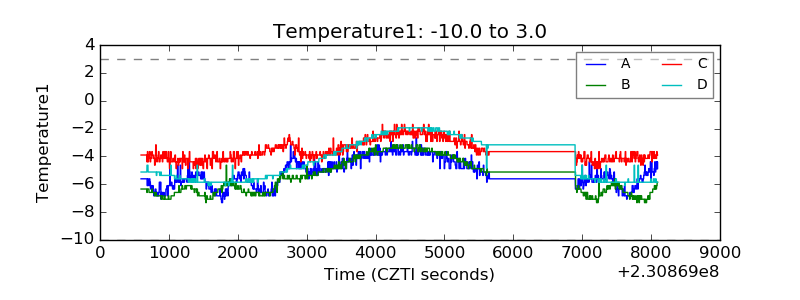 |
| Veto HV Monitor | 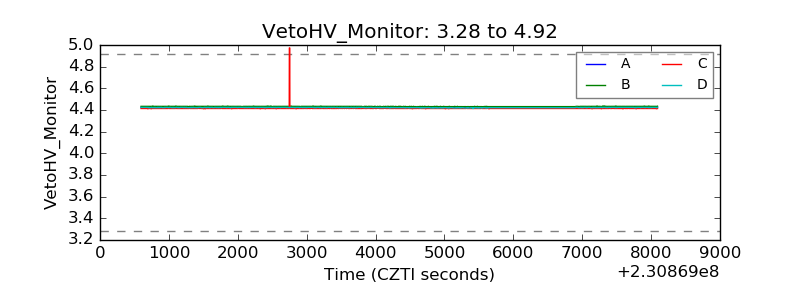 |
| Veto LLD | 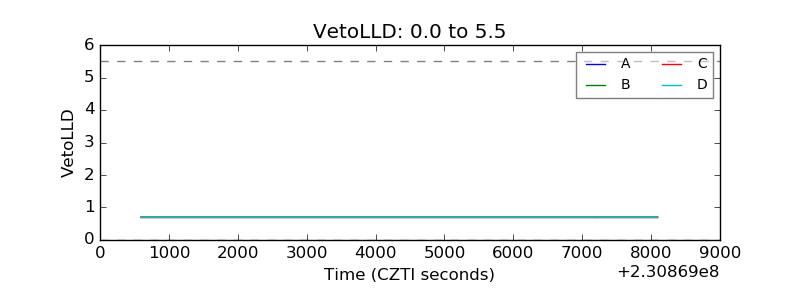 |
| Alpha Counter | 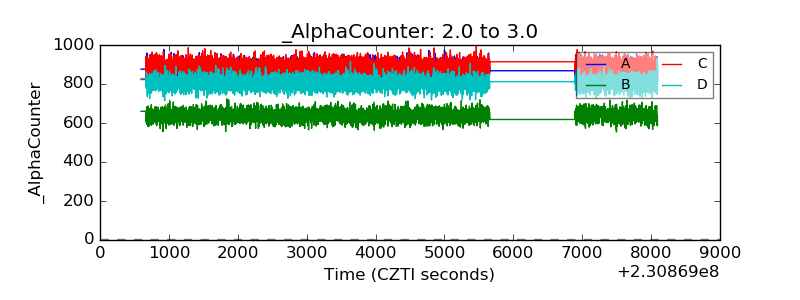 |
| _CPM_Rate | 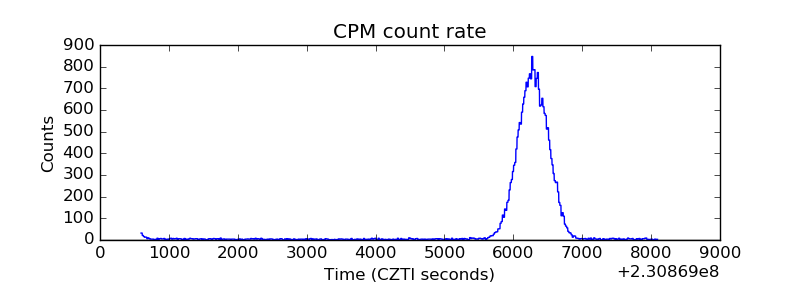 |
| CZT Counter | 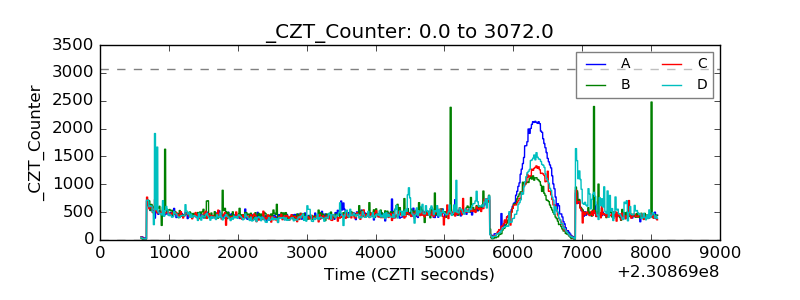 |
| +2.5 Volts monitor |  |
| +5 Volts monitor |  |
| _ROLL_ROT | 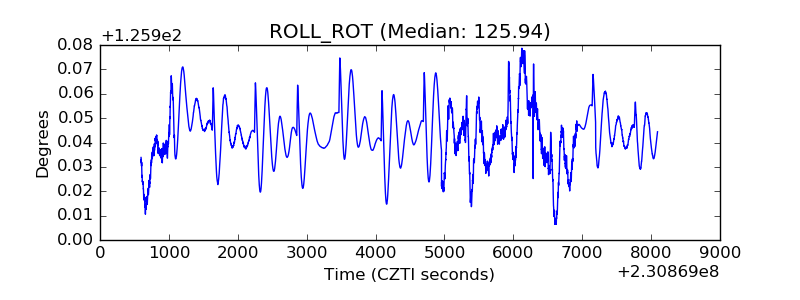 |
| _Roll_DEC | 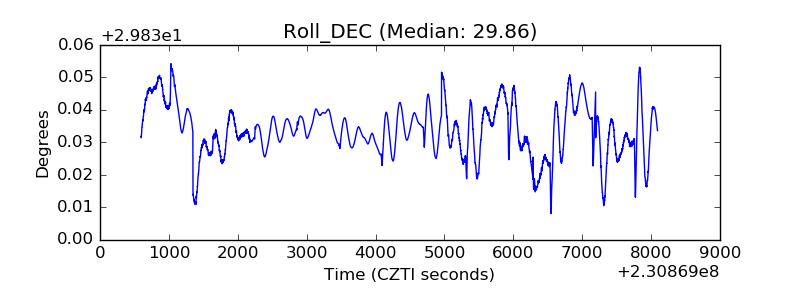 |
| _Roll_RA | 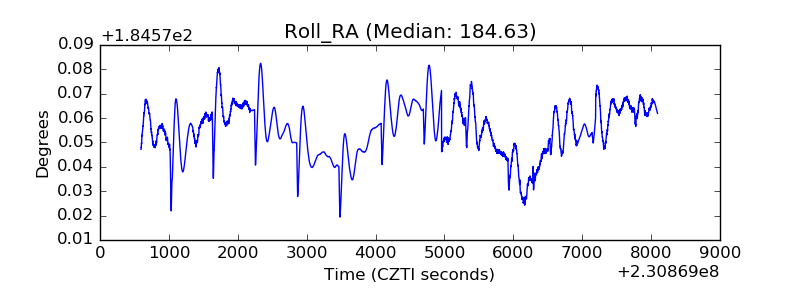 |
| Veto Counter | 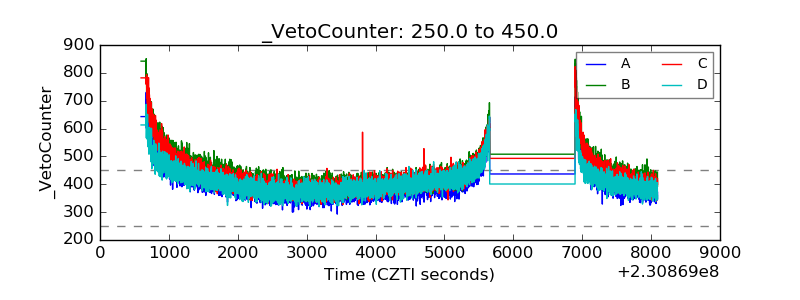 |