| Param | Original file | Final file |
|---|---|---|
| Filename | modeM0/AS1G07_060T01_9000001200_08527cztM0_level2.evt | modeM0/AS1G07_060T01_9000001200_08527cztM0_level2_quad_clean.evt |
| Size (bytes) | 439,269,120 | 71,642,880 |
| Size | 418.9 MB | 68.3 MB |
| Events in quadrant A | 3,058,477 | 435,453 |
| Events in quadrant B | 3,269,646 | 439,041 |
| Events in quadrant C | 2,916,517 | 430,662 |
| Events in quadrant D | 3,618,940 | 413,127 |
| Mode SS | |||
|---|---|---|---|
| Quadrant | BADHDUFLAG | Total packets | Discarded packets |
| A | 0 | 130 | 0 |
| B | 0 | 130 | 0 |
| C | 0 | 130 | 0 |
| D | 0 | 130 | 0 |
| Mode M0 | |||
|---|---|---|---|
| Quadrant | BADHDUFLAG | Total packets | Discarded packets |
| A | 0 | 13462 | 5 |
| B | 0 | 13953 | 2 |
| C | 0 | 13254 | 2 |
| D | 0 | 15275 | 7 |
| Mode M9 | |||
|---|---|---|---|
| Quadrant | BADHDUFLAG | Total packets | Discarded packets |
| A | 0 | 21 | 0 |
| B | 0 | 21 | 0 |
| C | 0 | 21 | 0 |
| D | 0 | 22 | 0 |
| Quadrant | Total seconds | Saturated seconds | Saturation percentage |
|---|---|---|---|
| A | 6470 | 57 | 0.880989% |
| B | 6471 | 134 | 2.070777% |
| C | 6471 | 27 | 0.417246% |
| D | 6469 | 62 | 0.958417% |
Noise dominated data is calculated using 1-second bins in cleaned event files. If a bin has >2000 counts, and if more than 50% of those come from <1% of pixels, then it is considered to be noise-dominated and hence unusable.
| Quadrant | # 1 sec bins | Bins with >0 counts | Bins with >2000 counts | High rate bins dominated by noise | Noise dominated (total time) | Noise dominated (detector-on time) | Marked lightcurve |
|---|---|---|---|---|---|---|---|
| A | 7496 | 6471 | 3 | 3 | 0.04% | 0.05% | 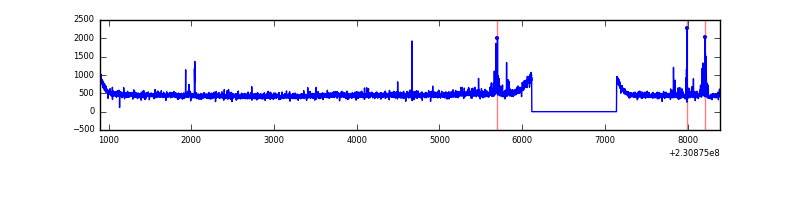 |
| B | 7496 | 6472 | 34 | 34 | 0.45% | 0.53% | 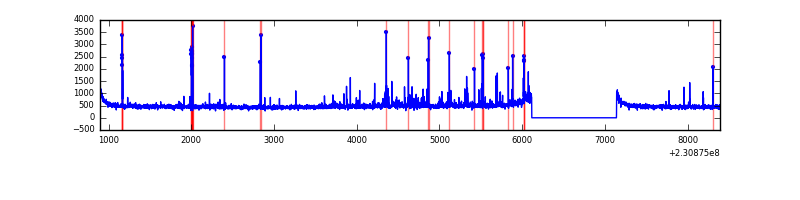 |
| C | 7496 | 6472 | 0 | 0 | 0.00% | 0.00% | 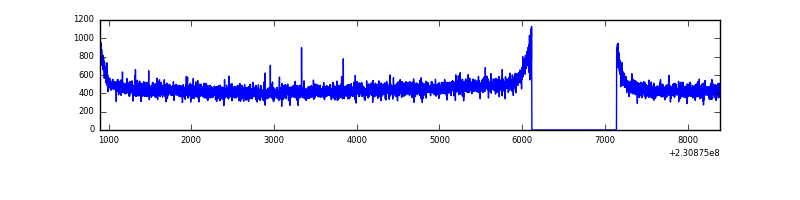 |
| D | 7496 | 6472 | 33 | 33 | 0.44% | 0.51% | 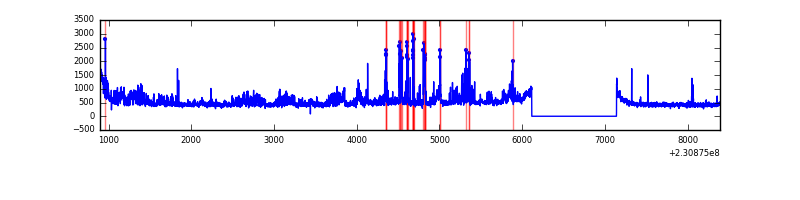 |
Top three noisy pixels from each quadrant. If the there are fewer than three noisy pixels in the level2.evt file, extra rows are filled as -1
| Pixel properties | Quadrant properties | ||||||
|---|---|---|---|---|---|---|---|
| Quadrant | DetID | PixID | Counts | Sigma | Mean | Median | Sigma |
| A | 15 | 223 | 28159 | 175.56 | 773 | 755 | 156.1 |
| A | 13 | 248 | 26672 | 166.03 | 773 | 755 | 156.1 |
| A | 15 | 239 | 12045 | 72.33 | 773 | 755 | 156.1 |
| B | 10 | 16 | 149065 | 1005.13 | 772 | 755 | 147.6 |
| B | 0 | 214 | 49222 | 328.47 | 772 | 755 | 147.6 |
| B | 5 | 255 | 23382 | 153.35 | 772 | 755 | 147.6 |
| C | 13 | 61 | 5619 | 27.84 | 747 | 751 | 174.9 |
| C | 8 | 222 | 3506 | 15.76 | 747 | 751 | 174.9 |
| C | 3 | 202 | 1922 | 6.7 | 747 | 751 | 174.9 |
| D | 1 | 52 | 547962 | 2987.06 | 735 | 717 | 183.2 |
| D | 12 | 233 | 231567 | 1260.06 | 735 | 717 | 183.2 |
| D | 2 | 234 | 19976 | 105.12 | 735 | 717 | 183.2 |
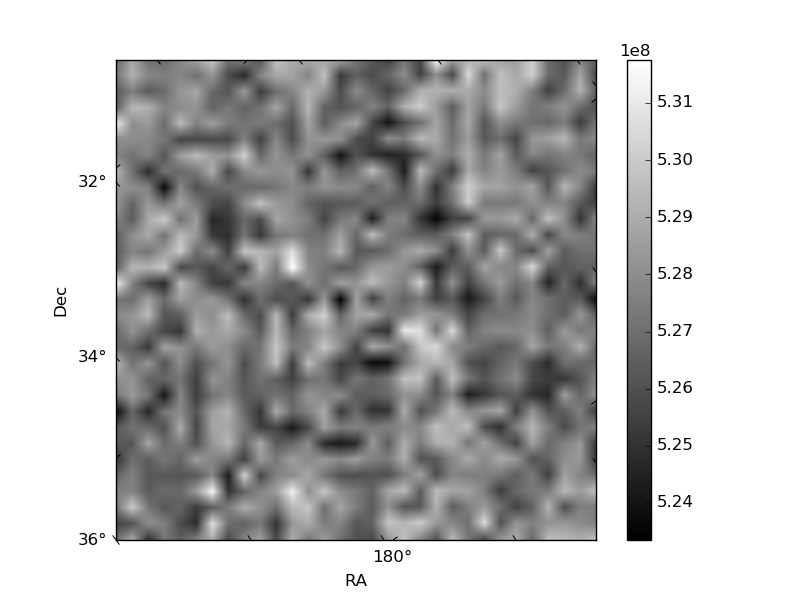
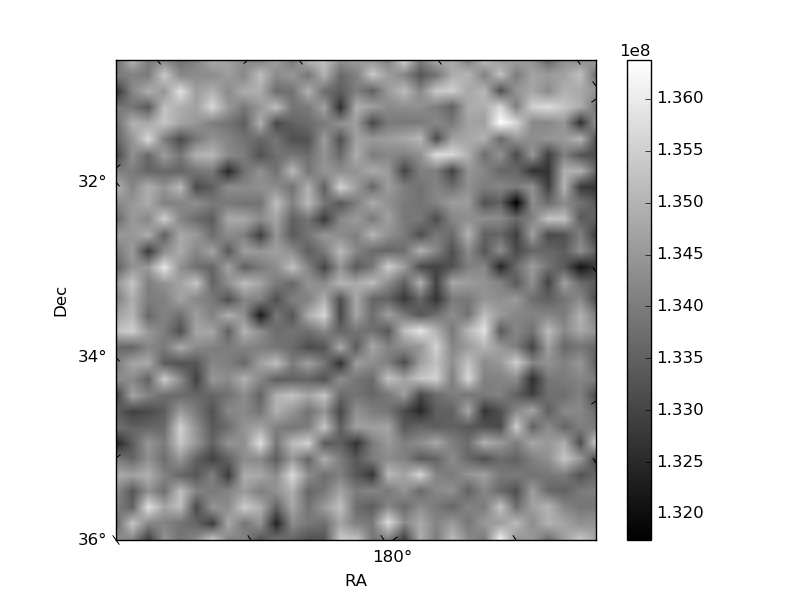
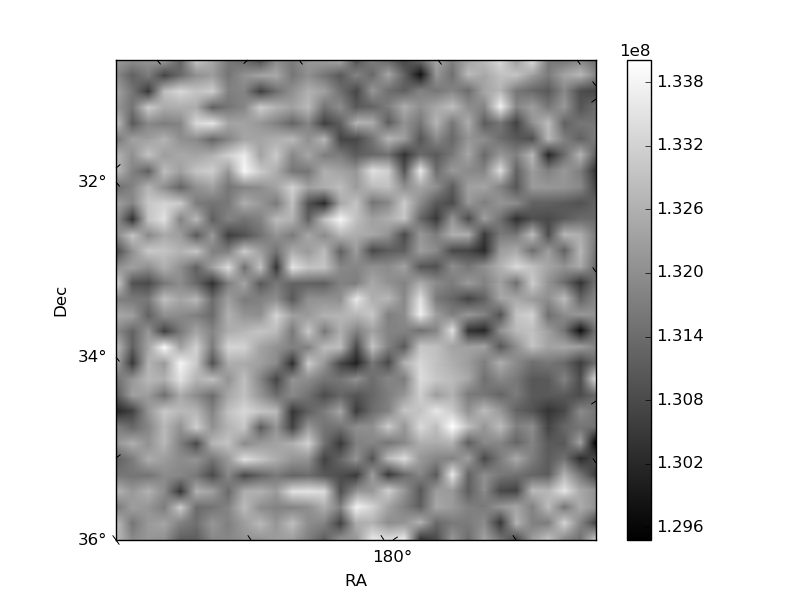
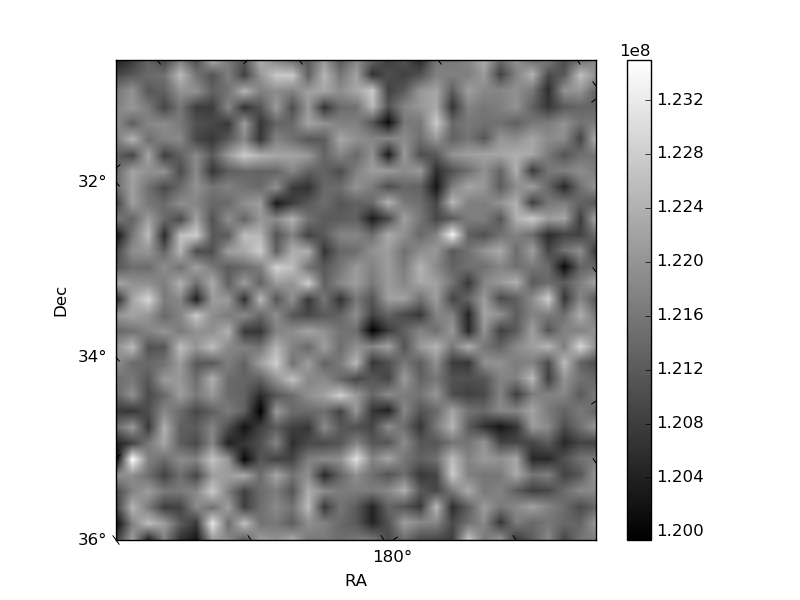
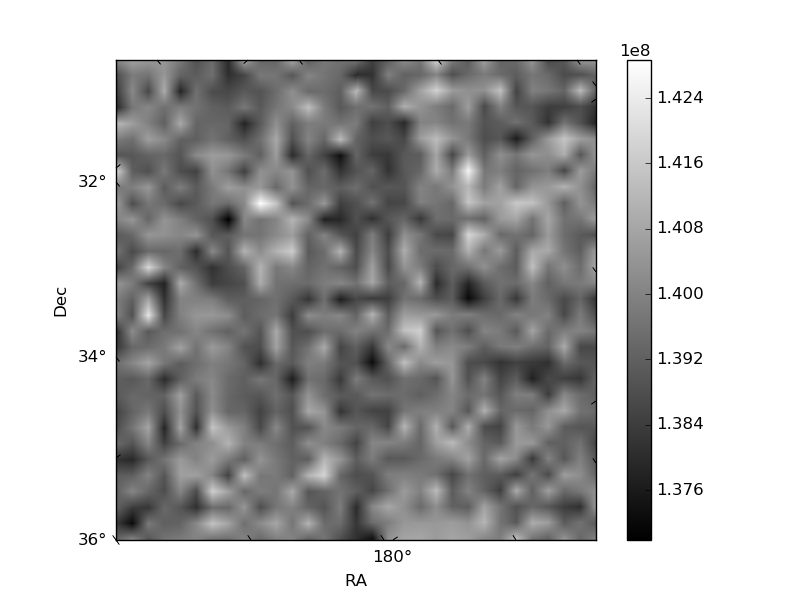
Histogram calculated using DETX and DETY for each event in the final _common_clean file
| Quadrant A | 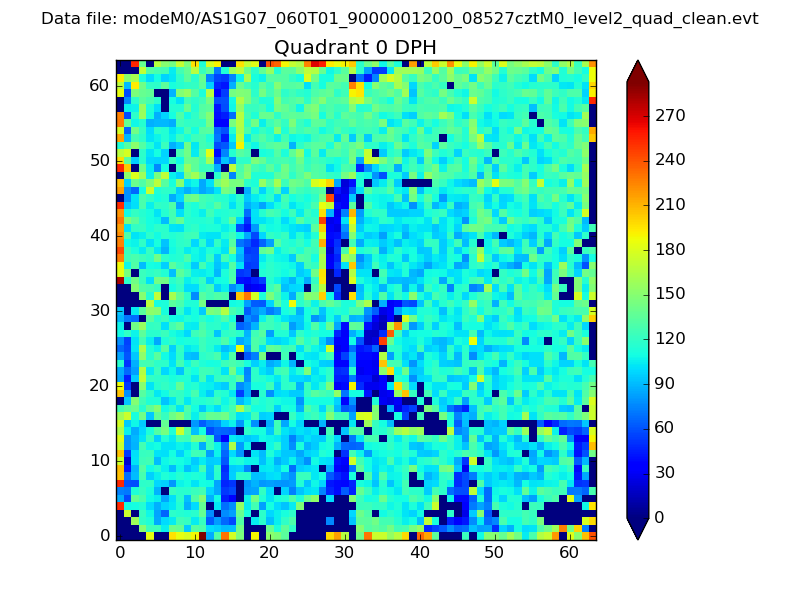 |
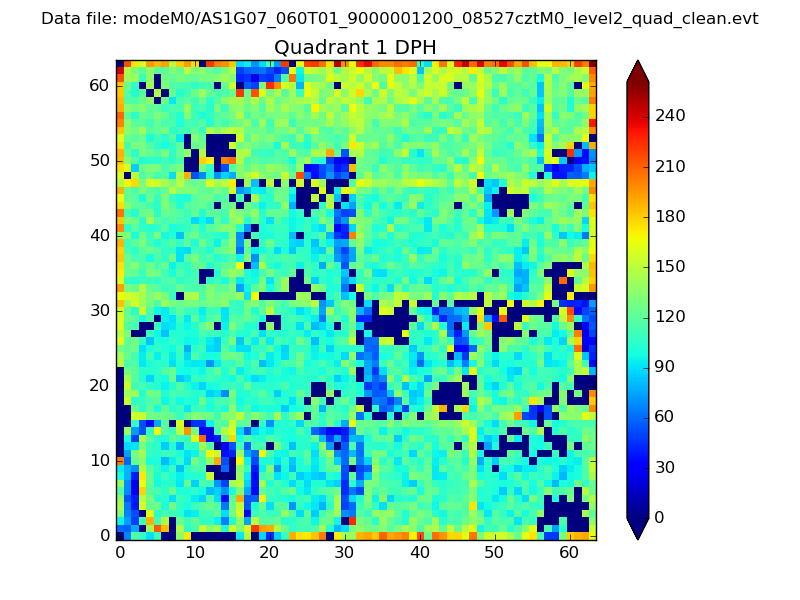 |
Quadrant B |
|---|---|---|---|
| Quadrant D | 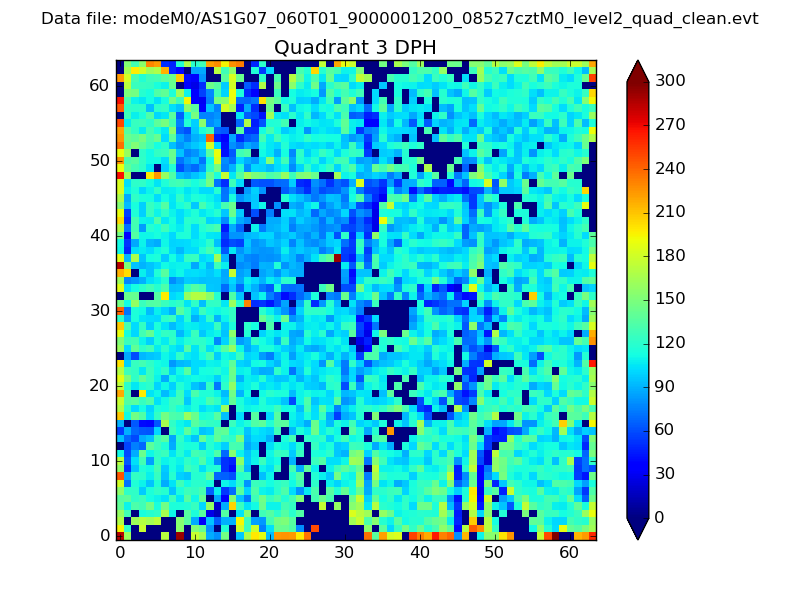 |
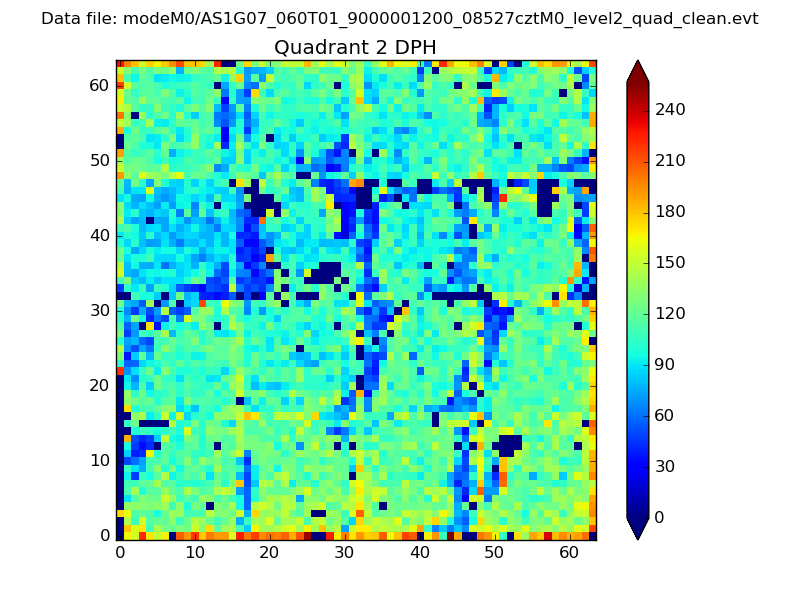 |
Quadrant C |
| Plot type | Count rate plots | Images |
|---|---|---|
| Comparison with Poisson distribution Blue bars denote a histogram of data divided into 1 sec bins. Red curve is a Poisson curve with rate = median count rate of data. |
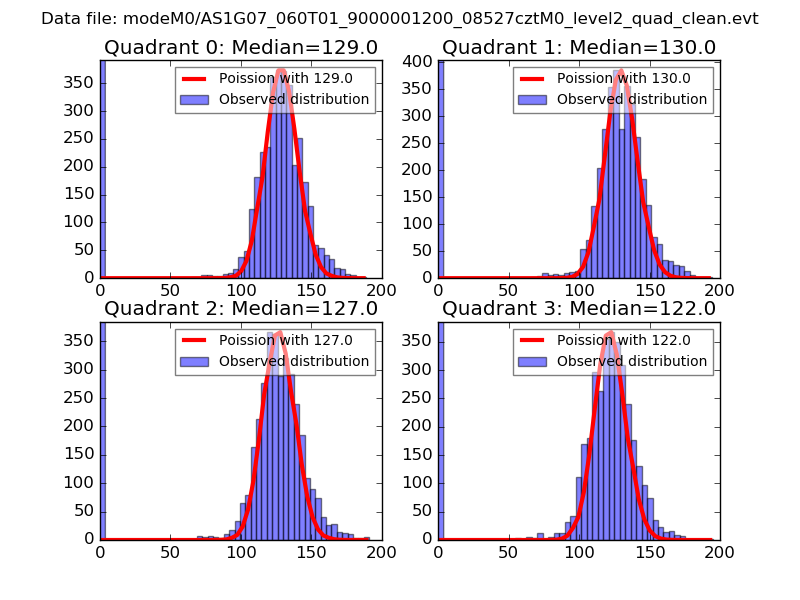 |
 |
| Quadrant-wise count rates Data is divided into 100 sec bins |
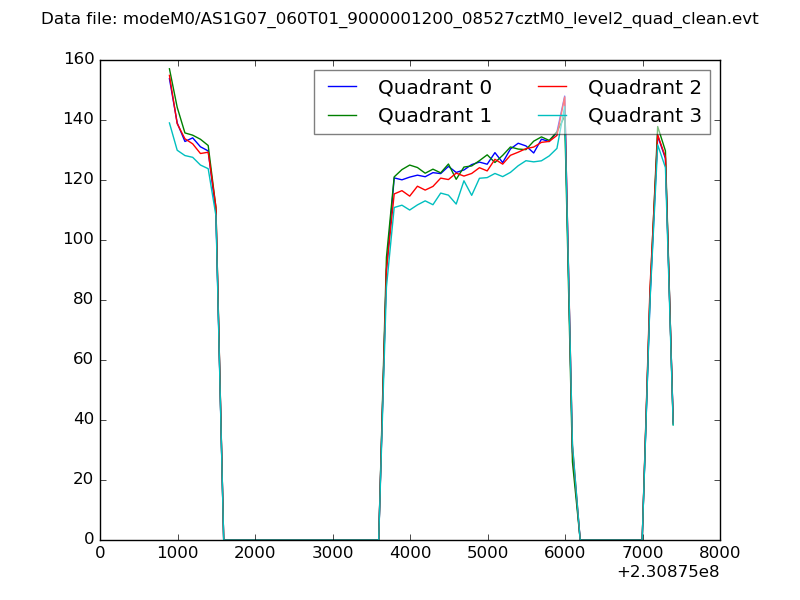 |
|
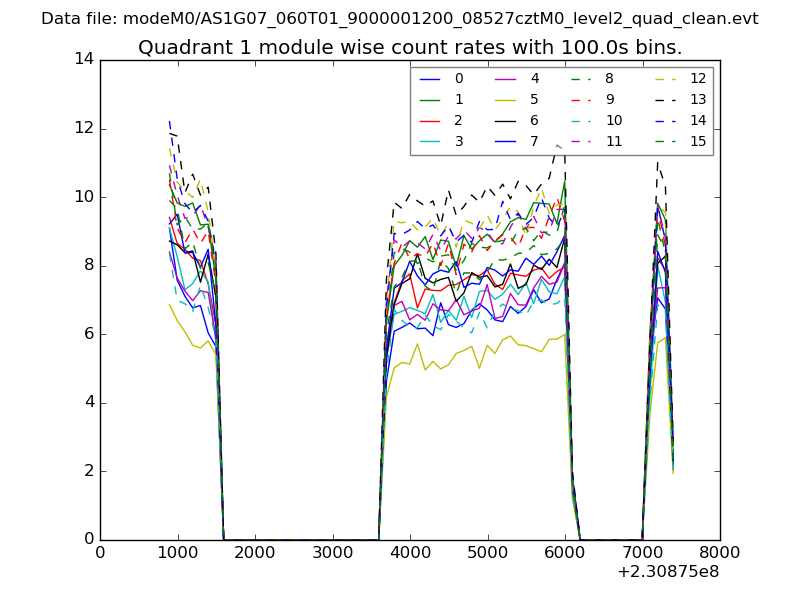
| Module-wise count rates for Quadrant A Data is divided into 100 sec bins |
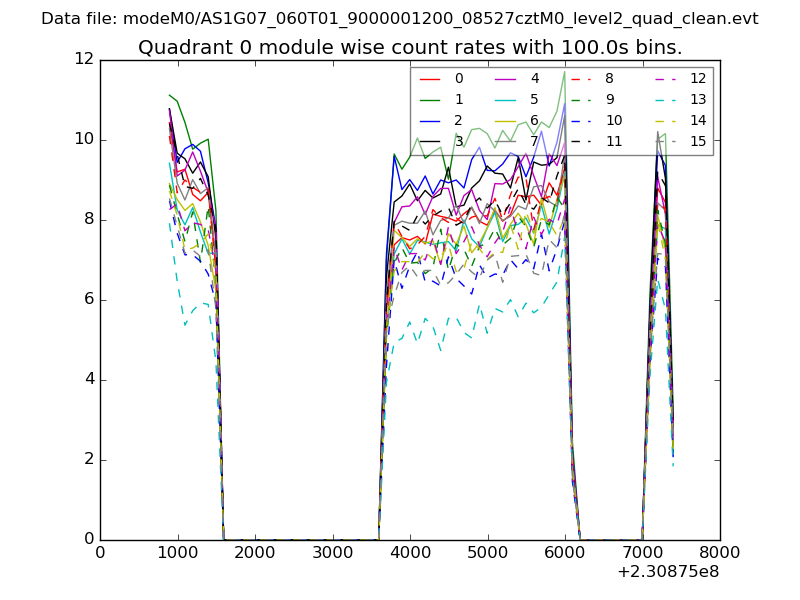 |
 |
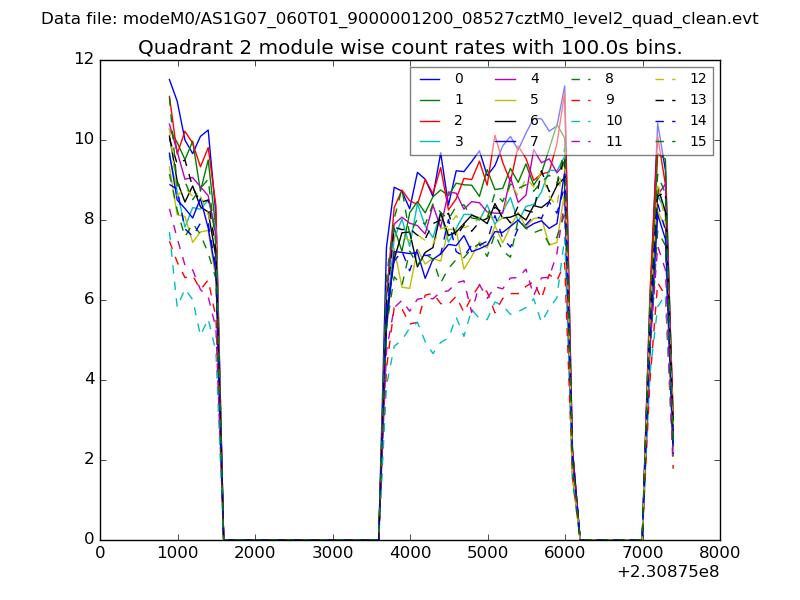
| Module-wise count rates for Quadrant B Data is divided into 100 sec bins |
 |
 |
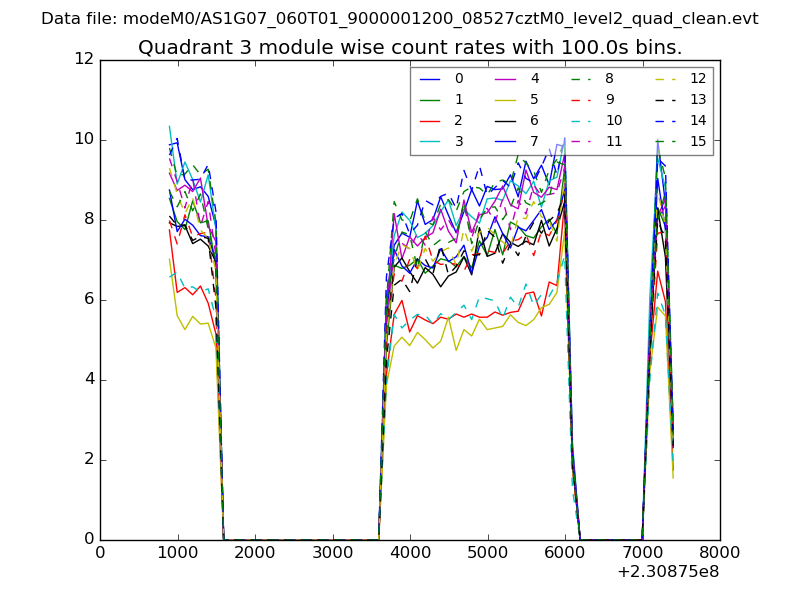
| Module-wise count rates for Quadrant C Data is divided into 100 sec bins |
 |
 |
| Module-wise count rates for Quadrant D Data is divided into 100 sec bins |
 |
 |
| Parameter | Plot |
|---|---|
| CZT HV Monitor | 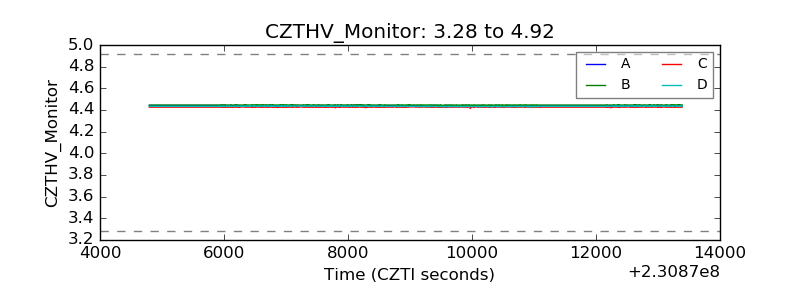 |
| D_VDD | 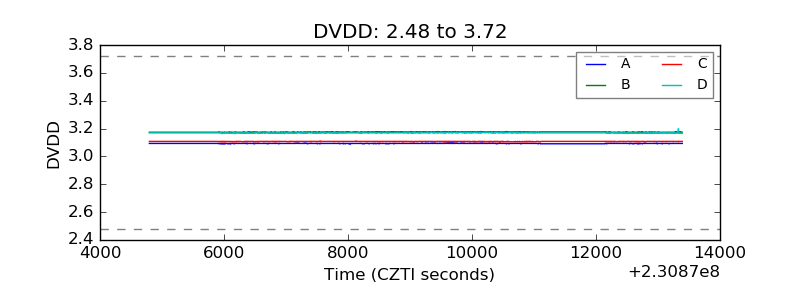 |
| Temperature 1 | 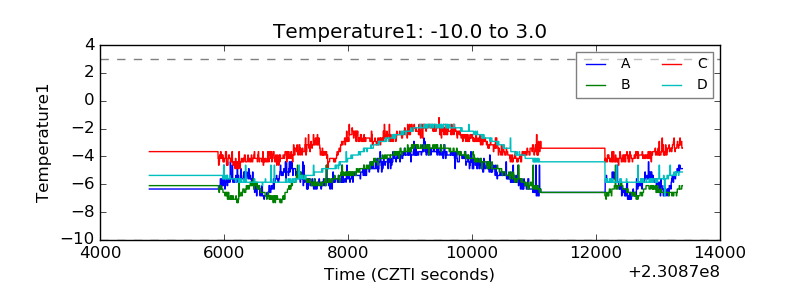 |
| Veto HV Monitor | 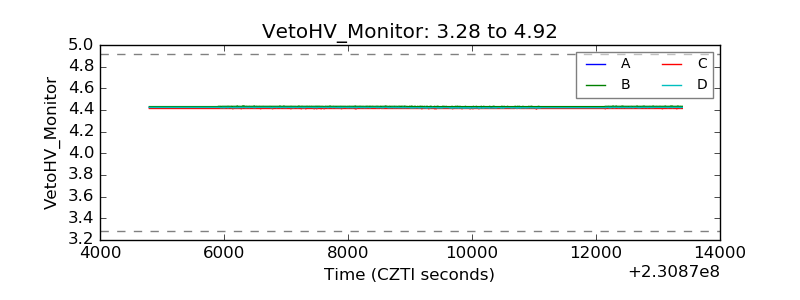 |
| Veto LLD | 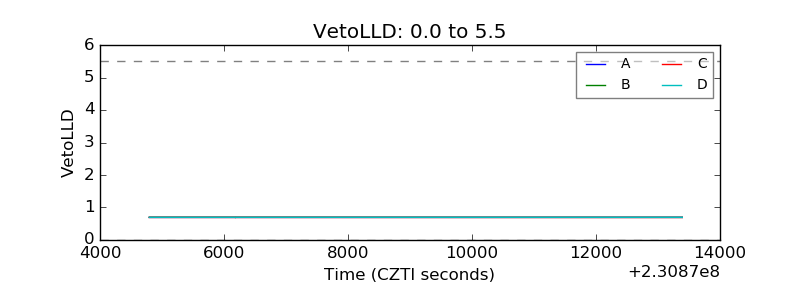 |
| Alpha Counter | 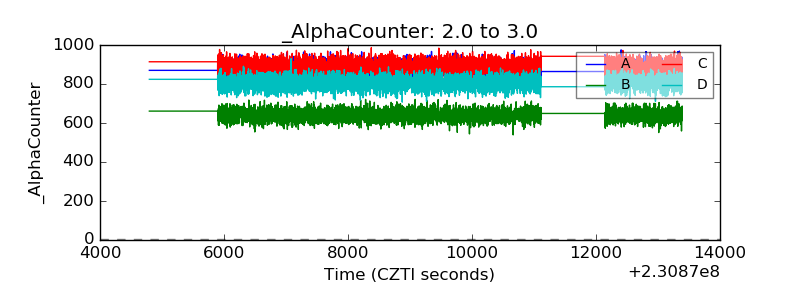 |
| _CPM_Rate | 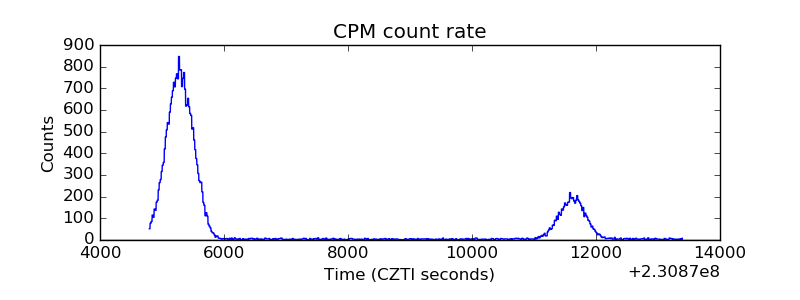 |
| CZT Counter | 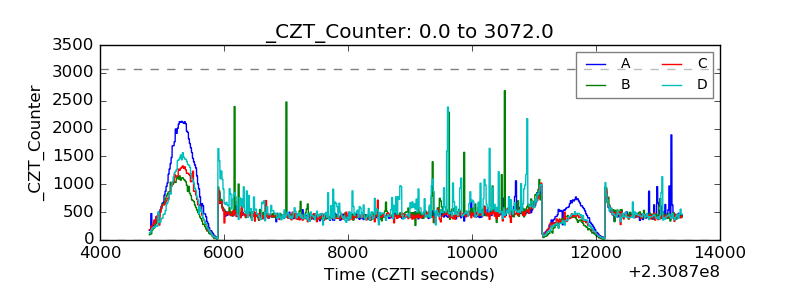 |
| +2.5 Volts monitor |  |
| +5 Volts monitor |  |
| _ROLL_ROT | 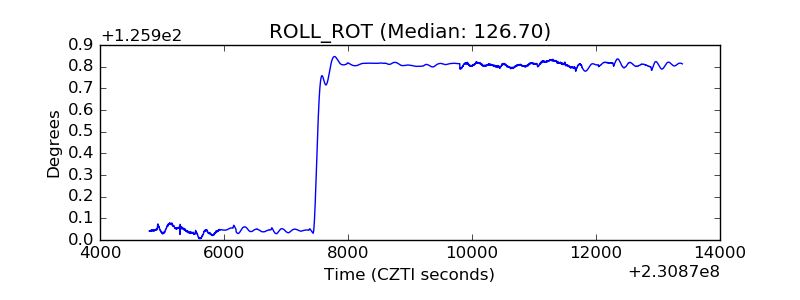 |
| _Roll_DEC | 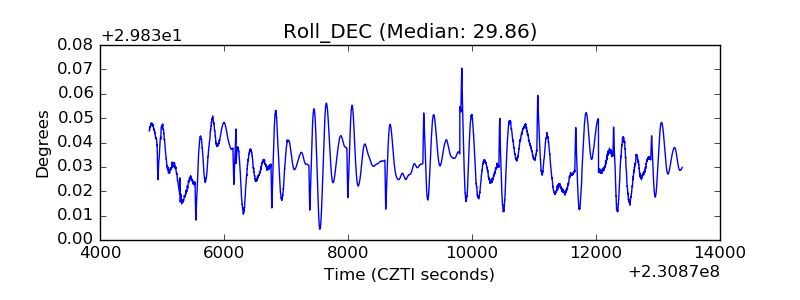 |
| _Roll_RA | 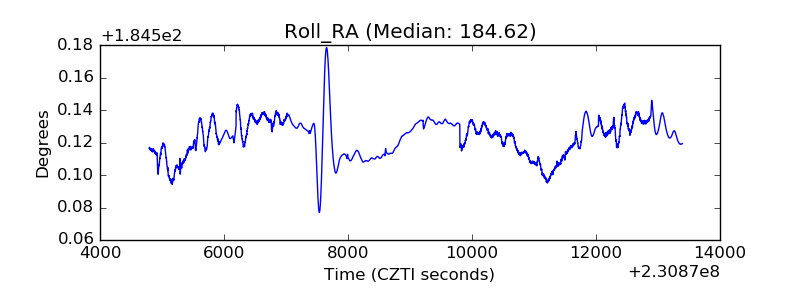 |
| Veto Counter | 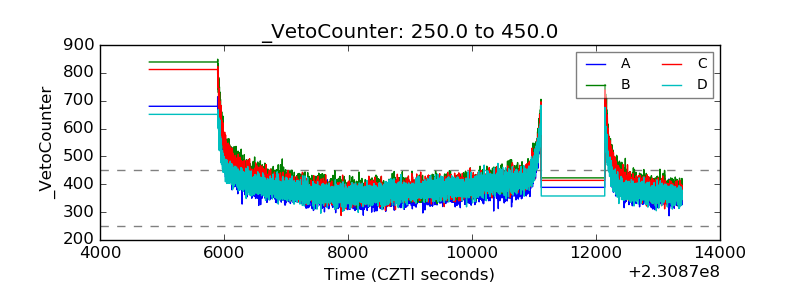 |