| Param | Original file | Final file |
|---|---|---|
| Filename | modeM0/AS1G07_060T01_9000001200_08528cztM0_level2.evt | modeM0/AS1G07_060T01_9000001200_08528cztM0_level2_quad_clean.evt |
| Size (bytes) | 549,527,040 | 88,715,520 |
| Size | 524.1 MB | 84.6 MB |
| Events in quadrant A | 3,848,432 | 542,427 |
| Events in quadrant B | 3,965,942 | 547,769 |
| Events in quadrant C | 3,604,486 | 542,264 |
| Events in quadrant D | 4,691,756 | 509,107 |
| Mode SS | |||
|---|---|---|---|
| Quadrant | BADHDUFLAG | Total packets | Discarded packets |
| A | 0 | 162 | 0 |
| B | 0 | 162 | 0 |
| C | 0 | 162 | 0 |
| D | 0 | 162 | 0 |
| Mode M0 | |||
|---|---|---|---|
| Quadrant | BADHDUFLAG | Total packets | Discarded packets |
| A | 0 | 16740 | 3 |
| B | 0 | 16924 | 2 |
| C | 0 | 16262 | 2 |
| D | 0 | 19522 | 2 |
| Mode M9 | |||
|---|---|---|---|
| Quadrant | BADHDUFLAG | Total packets | Discarded packets |
| A | 0 | 16 | 0 |
| B | 0 | 16 | 0 |
| C | 0 | 16 | 0 |
| D | 0 | 16 | 0 |
| Quadrant | Total seconds | Saturated seconds | Saturation percentage |
|---|---|---|---|
| A | 7827 | 214 | 2.734125% |
| B | 7827 | 248 | 3.168519% |
| C | 7827 | 137 | 1.750351% |
| D | 7827 | 404 | 5.161620% |
Noise dominated data is calculated using 1-second bins in cleaned event files. If a bin has >2000 counts, and if more than 50% of those come from <1% of pixels, then it is considered to be noise-dominated and hence unusable.
| Quadrant | # 1 sec bins | Bins with >0 counts | Bins with >2000 counts | High rate bins dominated by noise | Noise dominated (total time) | Noise dominated (detector-on time) | Marked lightcurve |
|---|---|---|---|---|---|---|---|
| A | 9437 | 7828 | 19 | 19 | 0.20% | 0.24% | 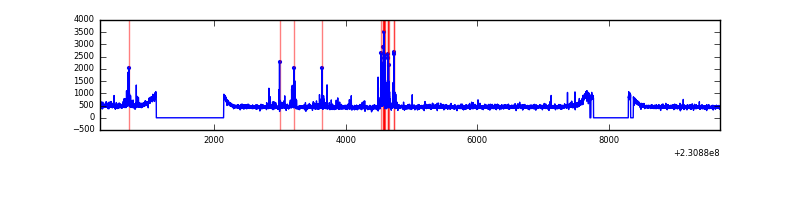 |
| B | 9437 | 7829 | 25 | 25 | 0.26% | 0.32% | 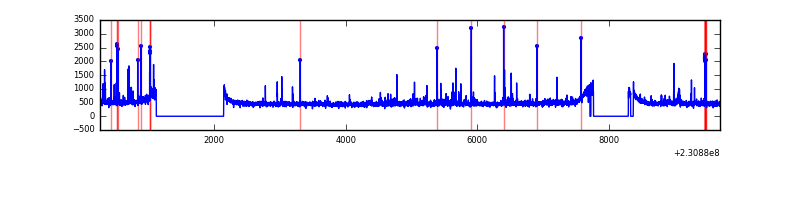 |
| C | 9437 | 7830 | 0 | 0 | 0.00% | 0.00% | 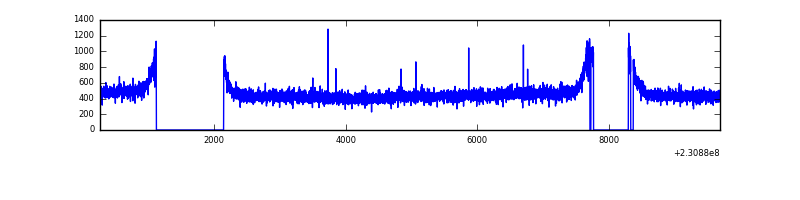 |
| D | 9437 | 7830 | 230 | 230 | 2.44% | 2.94% | 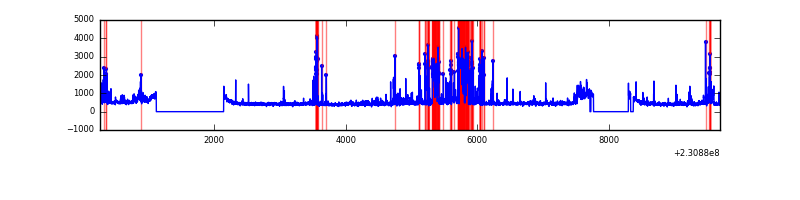 |
Top three noisy pixels from each quadrant. If the there are fewer than three noisy pixels in the level2.evt file, extra rows are filled as -1
| Pixel properties | Quadrant properties | ||||||
|---|---|---|---|---|---|---|---|
| Quadrant | DetID | PixID | Counts | Sigma | Mean | Median | Sigma |
| A | 15 | 223 | 110940 | 569.45 | 946 | 924 | 193.2 |
| A | 15 | 239 | 48315 | 245.3 | 946 | 924 | 193.2 |
| A | 13 | 248 | 29418 | 147.49 | 946 | 924 | 193.2 |
| B | 10 | 16 | 145691 | 787.28 | 946 | 921 | 183.9 |
| B | 0 | 214 | 48384 | 258.11 | 946 | 921 | 183.9 |
| B | 15 | 255 | 28227 | 148.49 | 946 | 921 | 183.9 |
| C | 13 | 61 | 6923 | 27.71 | 922 | 926 | 216.4 |
| C | 8 | 222 | 4643 | 17.17 | 922 | 926 | 216.4 |
| C | 5 | 220 | 4190 | 15.08 | 922 | 926 | 216.4 |
| D | 1 | 52 | 990859 | 4418.27 | 899 | 874 | 224.1 |
| D | 12 | 233 | 238952 | 1062.53 | 899 | 874 | 224.1 |
| D | 2 | 234 | 24412 | 105.05 | 899 | 874 | 224.1 |
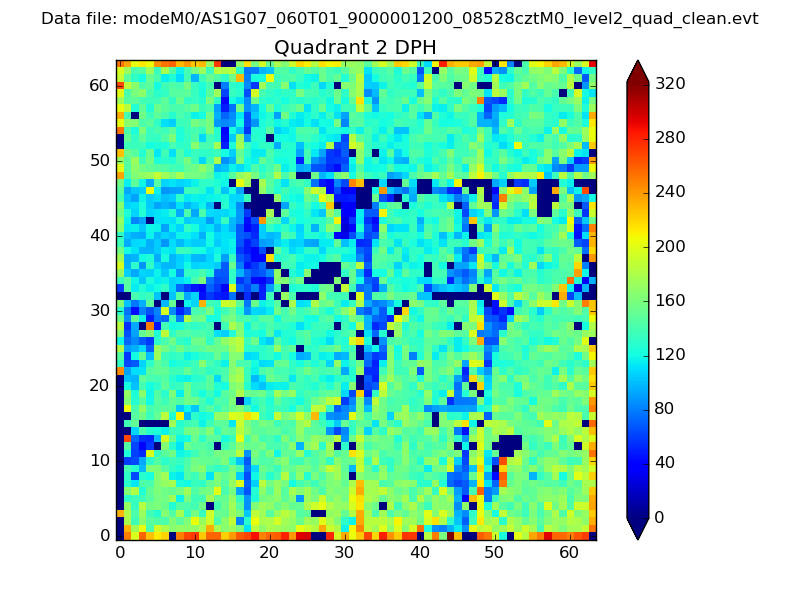
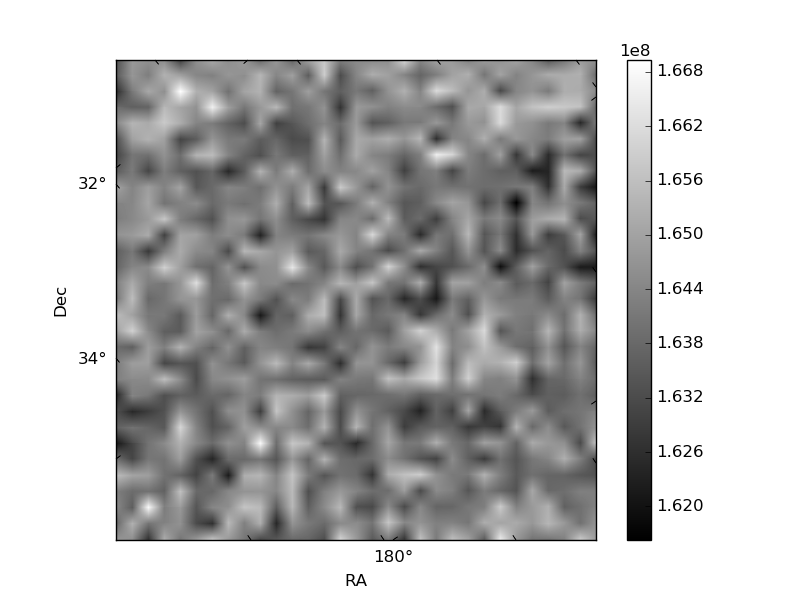
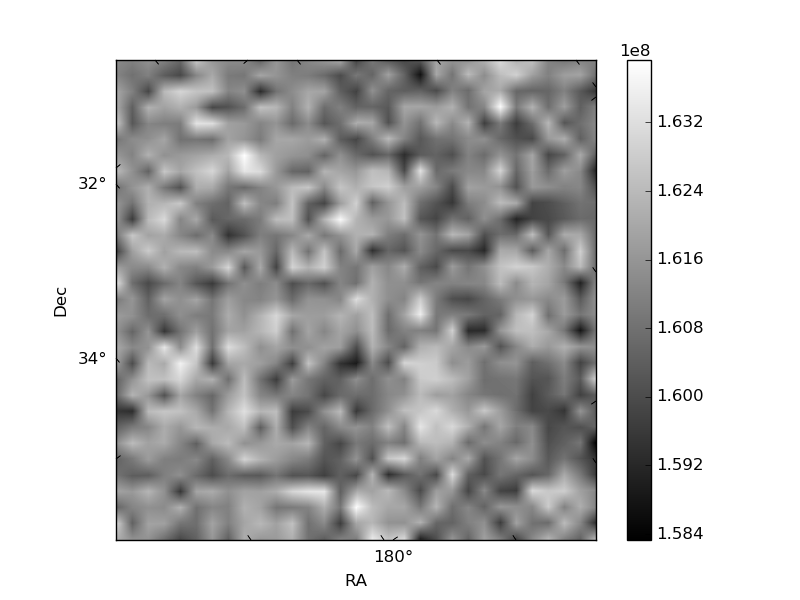
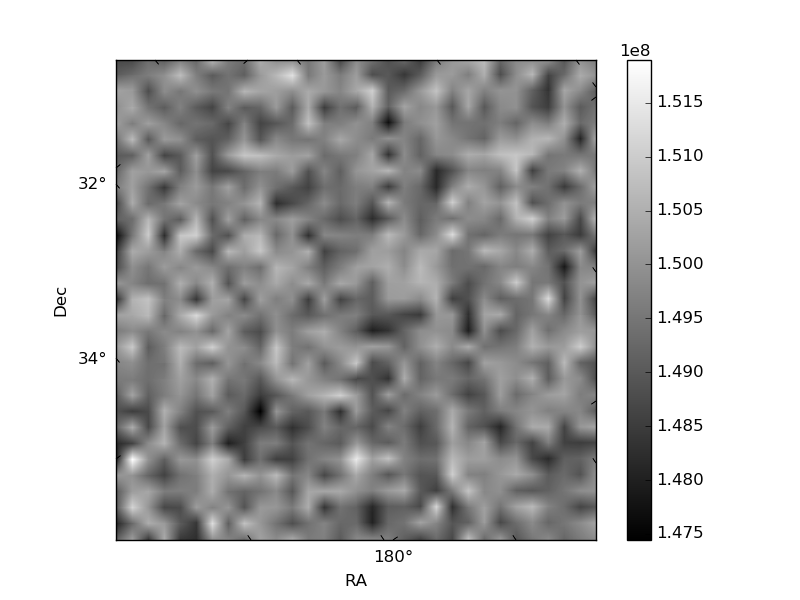
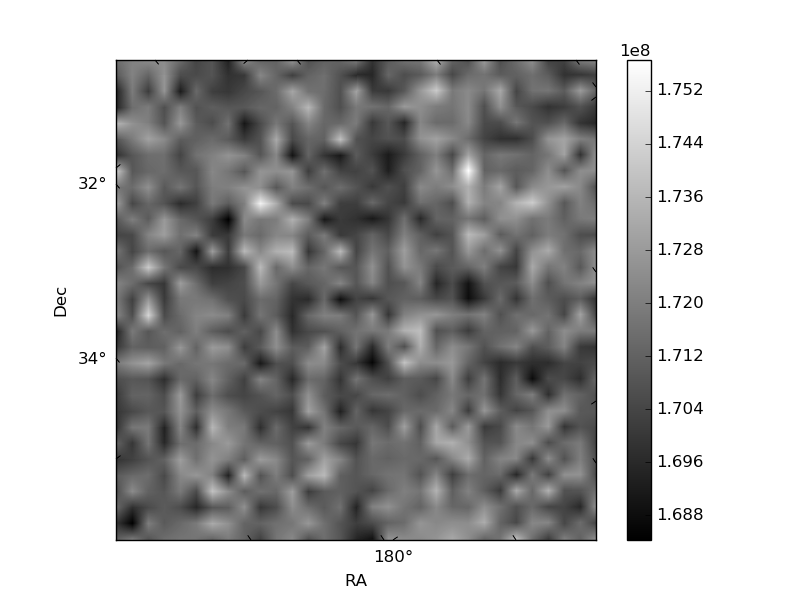
Histogram calculated using DETX and DETY for each event in the final _common_clean file
| Quadrant A | 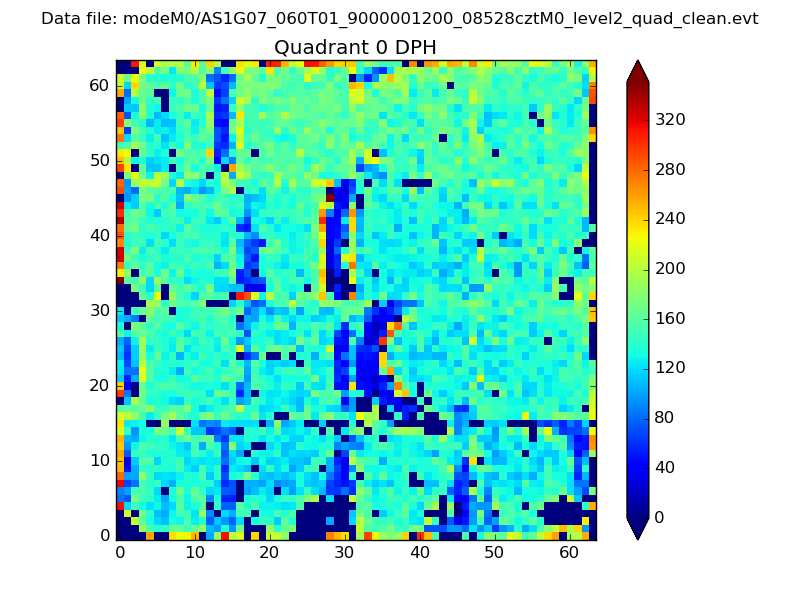 |
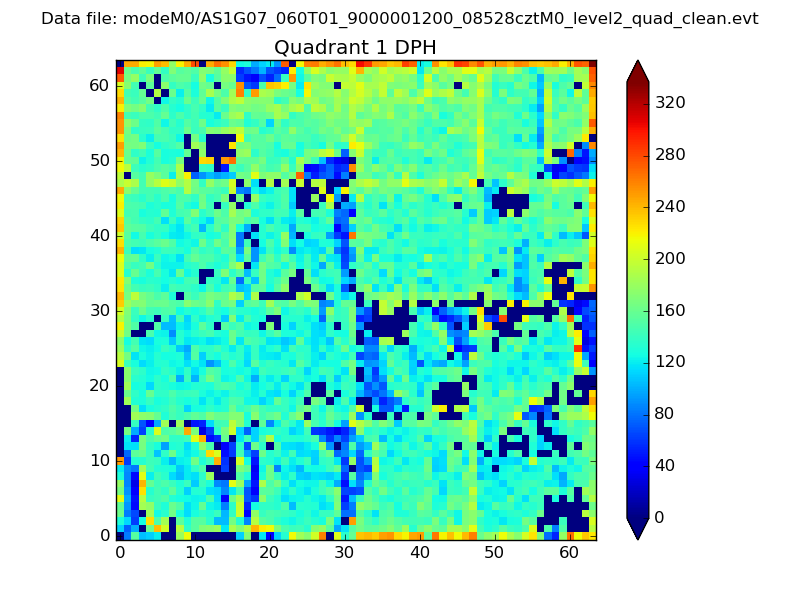 |
Quadrant B |
|---|---|---|---|
| Quadrant D | 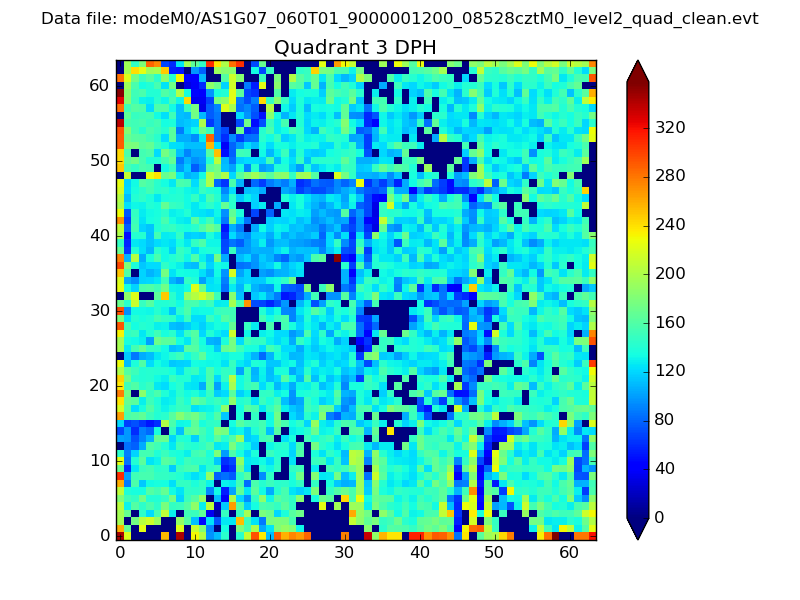 |
 |
Quadrant C |
| Plot type | Count rate plots | Images |
|---|---|---|
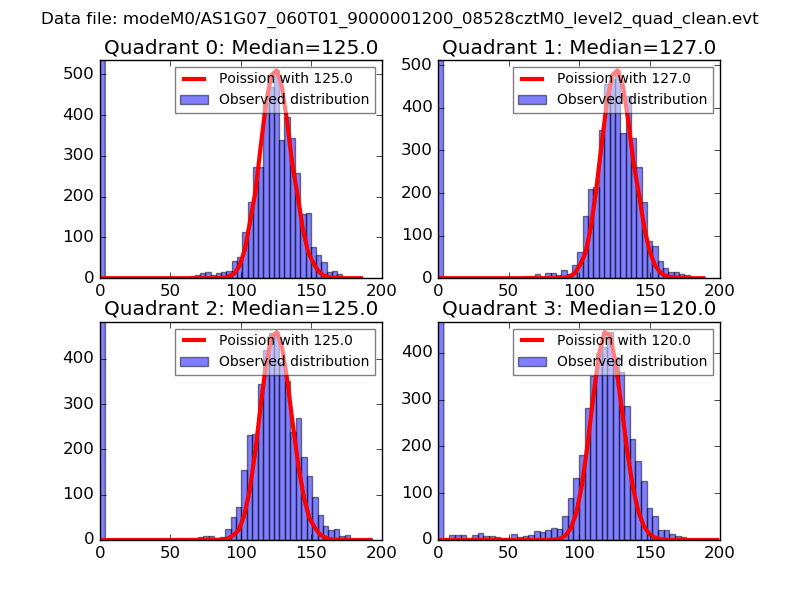
| Comparison with Poisson distribution Blue bars denote a histogram of data divided into 1 sec bins. Red curve is a Poisson curve with rate = median count rate of data. |
 |
 |
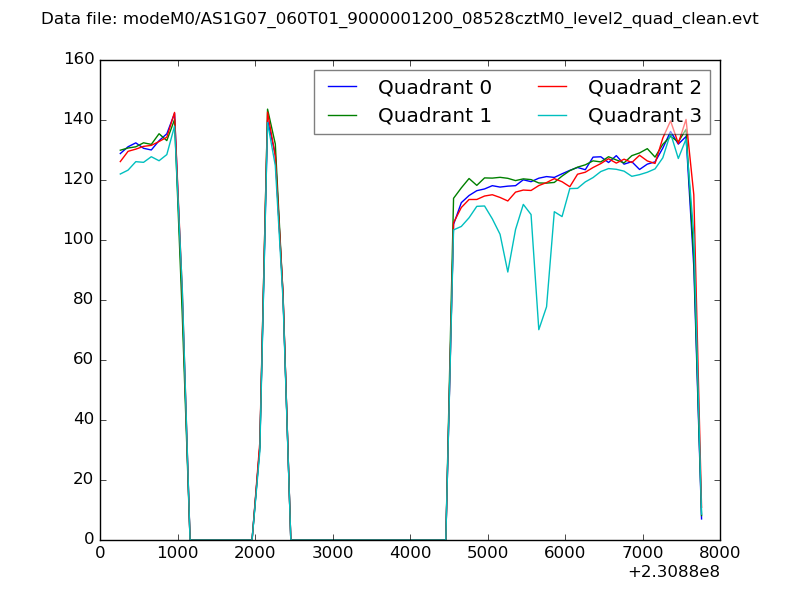
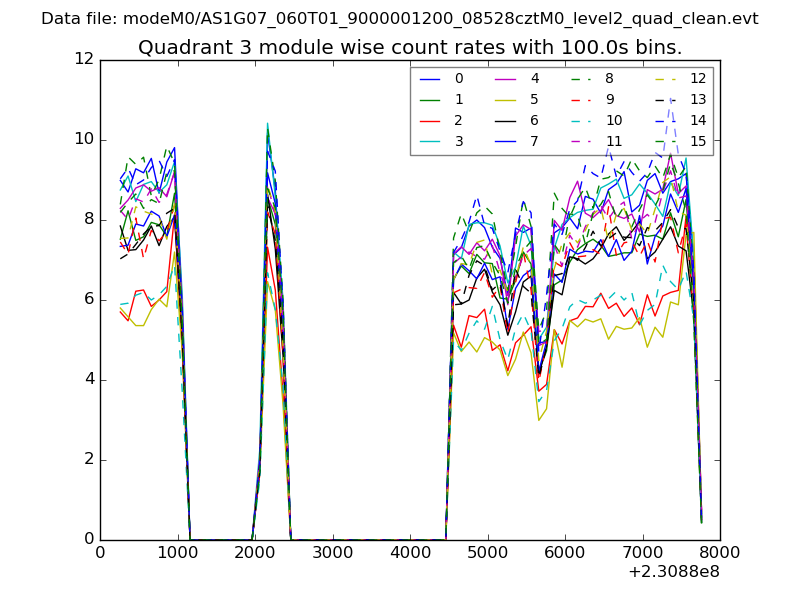
| Quadrant-wise count rates Data is divided into 100 sec bins |
 |
|
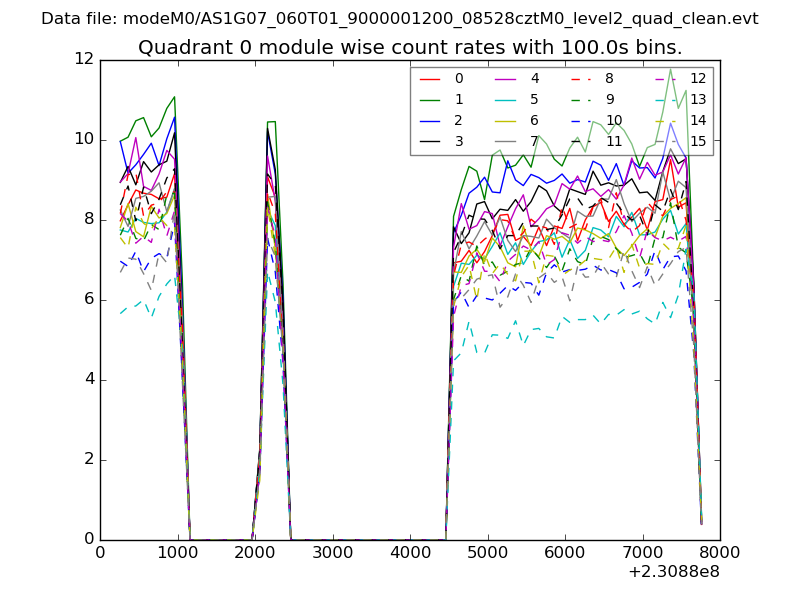
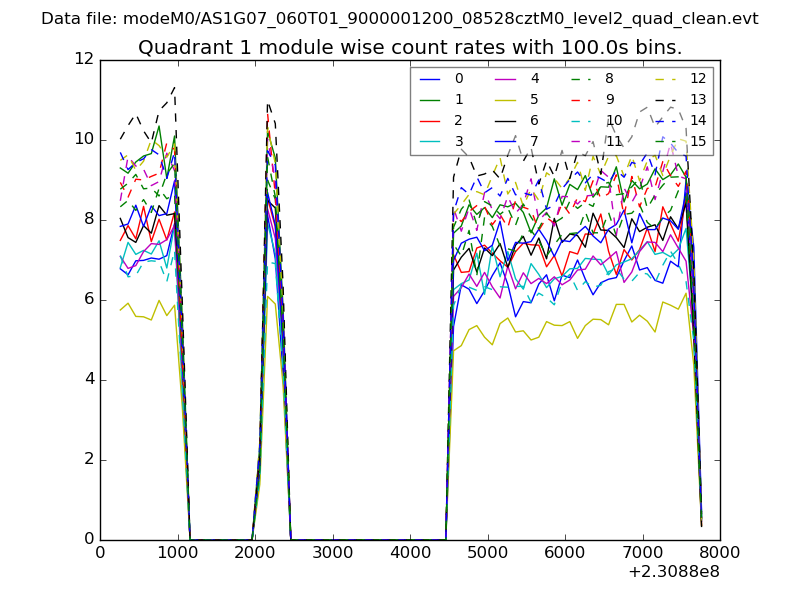
| Module-wise count rates for Quadrant A Data is divided into 100 sec bins |
 |
 |
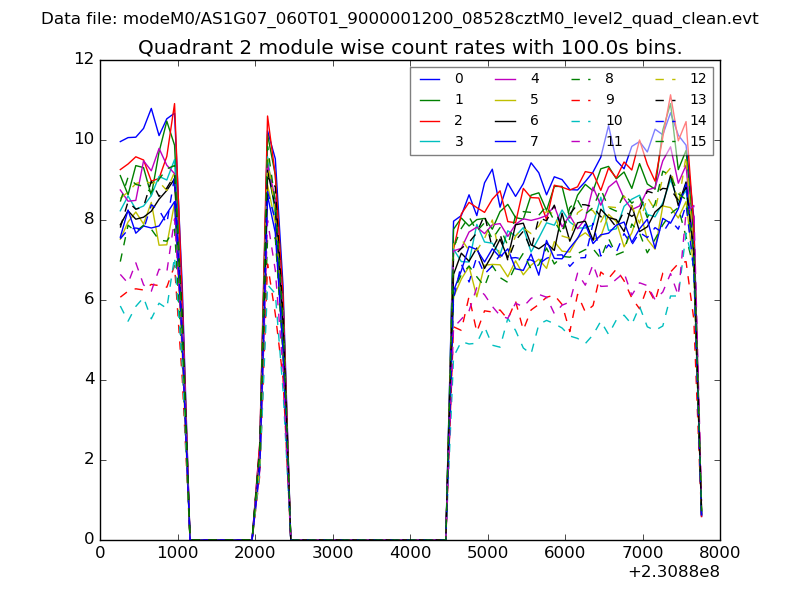
| Module-wise count rates for Quadrant B Data is divided into 100 sec bins |
 |
 |
| Module-wise count rates for Quadrant C Data is divided into 100 sec bins |
 |
 |
| Module-wise count rates for Quadrant D Data is divided into 100 sec bins |
 |
 |
| Parameter | Plot |
|---|---|
| CZT HV Monitor | 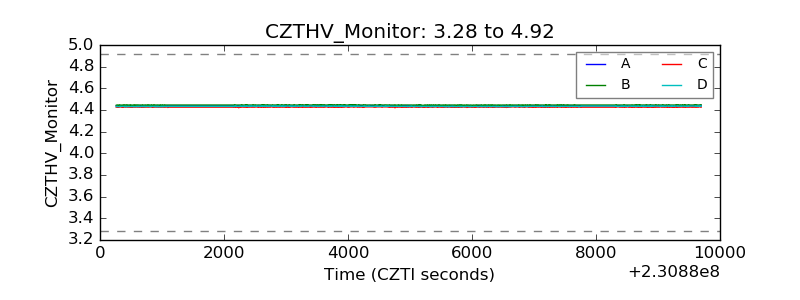 |
| D_VDD | 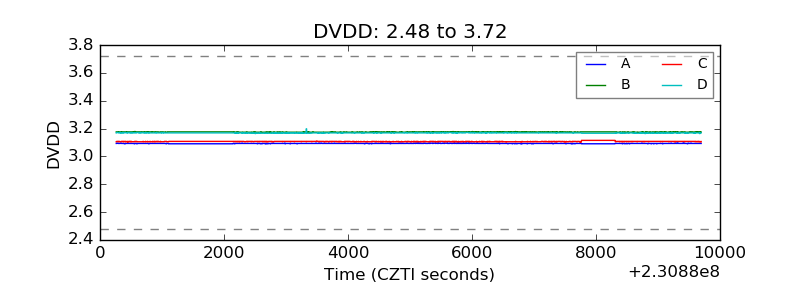 |
| Temperature 1 | 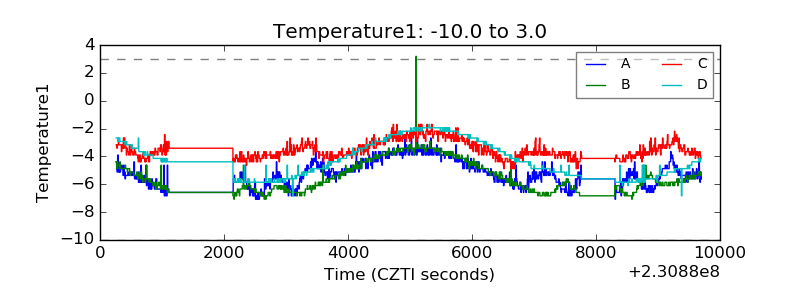 |
| Veto HV Monitor | 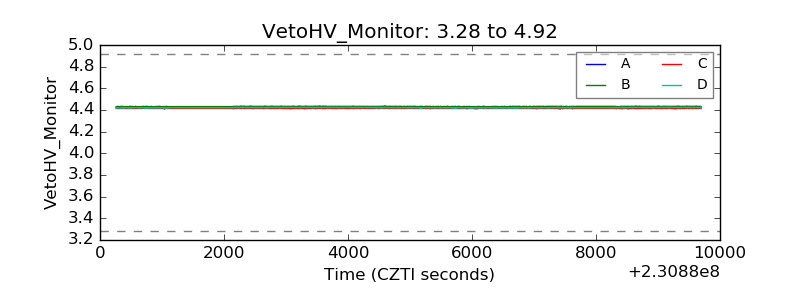 |
| Veto LLD | 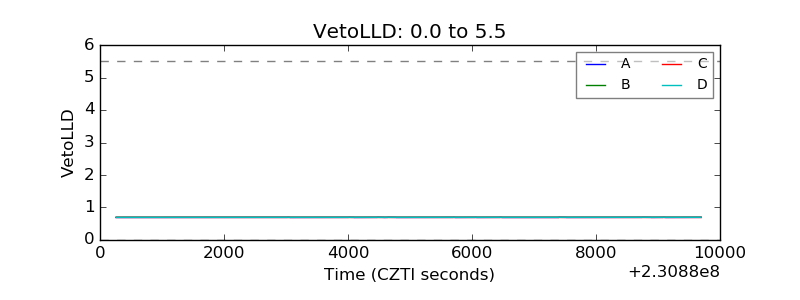 |
| Alpha Counter | 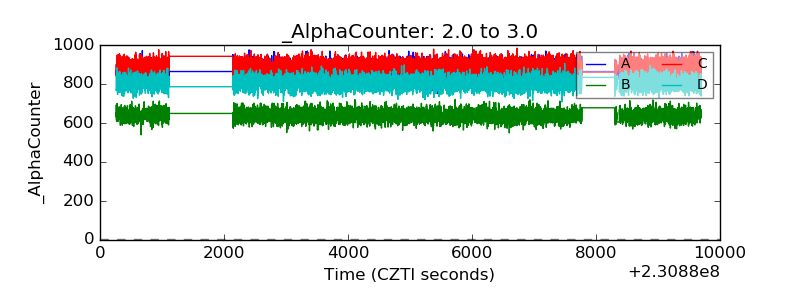 |
| _CPM_Rate | 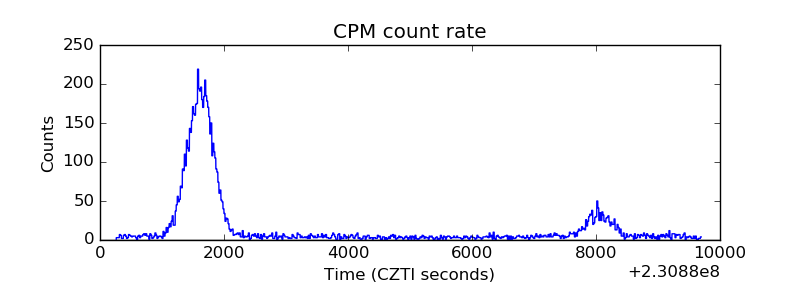 |
| CZT Counter | 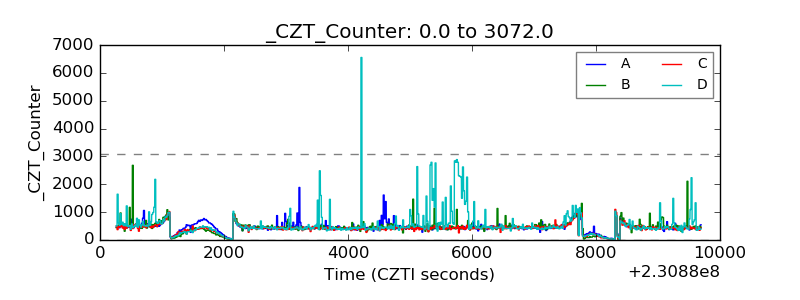 |
| +2.5 Volts monitor |  |
| +5 Volts monitor |  |
| _ROLL_ROT | 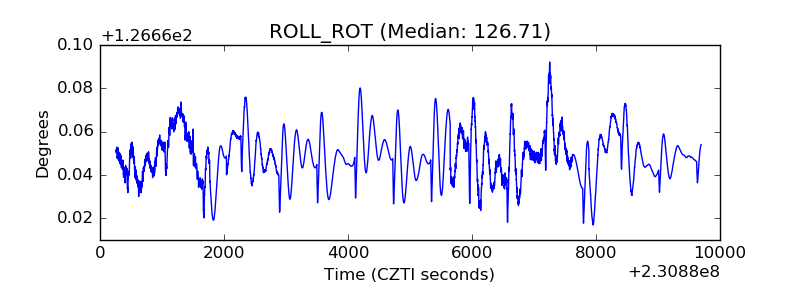 |
| _Roll_DEC | 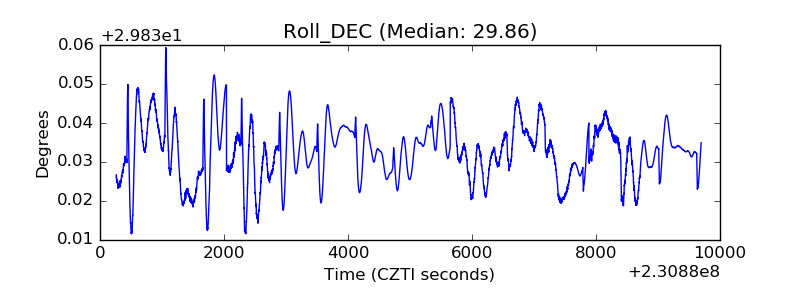 |
| _Roll_RA | 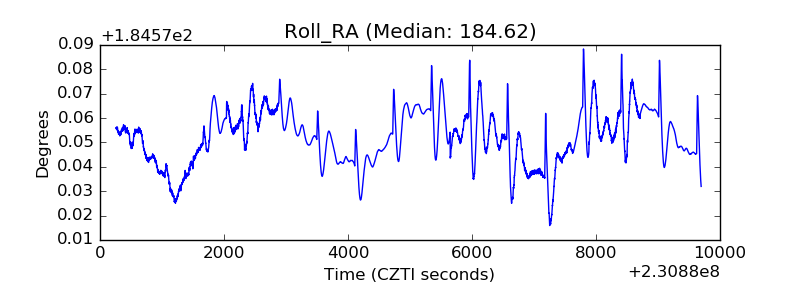 |
| Veto Counter | 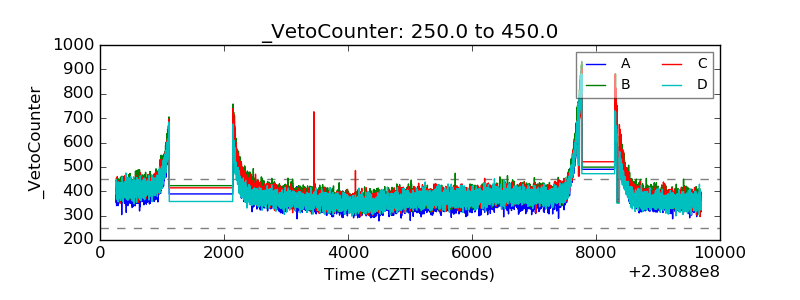 |