| Param | Original file | Final file |
|---|---|---|
| Filename | modeM0/AS1G07_060T01_9000001200_08530cztM0_level2.evt | modeM0/AS1G07_060T01_9000001200_08530cztM0_level2_quad_clean.evt |
| Size (bytes) | 596,125,440 | 92,499,840 |
| Size | 568.5 MB | 88.2 MB |
| Events in quadrant A | 4,420,762 | 552,426 |
| Events in quadrant B | 4,728,767 | 553,313 |
| Events in quadrant C | 4,127,040 | 546,767 |
| Events in quadrant D | 4,175,734 | 534,117 |
| Mode SS | |||
|---|---|---|---|
| Quadrant | BADHDUFLAG | Total packets | Discarded packets |
| A | 0 | 178 | 0 |
| B | 0 | 178 | 0 |
| C | 0 | 178 | 0 |
| D | 0 | 178 | 0 |
| Mode M0 | |||
|---|---|---|---|
| Quadrant | BADHDUFLAG | Total packets | Discarded packets |
| A | 0 | 19293 | 4 |
| B | 0 | 19821 | 3 |
| C | 0 | 18619 | 3 |
| D | 0 | 18941 | 3 |
| Mode M9 | |||
|---|---|---|---|
| Quadrant | BADHDUFLAG | Total packets | Discarded packets |
| A | 0 | 2 | 0 |
| B | 0 | 2 | 0 |
| C | 0 | 2 | 0 |
| D | 0 | 2 | 0 |
| Quadrant | Total seconds | Saturated seconds | Saturation percentage |
|---|---|---|---|
| A | 8861 | 573 | 6.466539% |
| B | 8861 | 632 | 7.132378% |
| C | 8861 | 423 | 4.773728% |
| D | 8861 | 482 | 5.439567% |
Noise dominated data is calculated using 1-second bins in cleaned event files. If a bin has >2000 counts, and if more than 50% of those come from <1% of pixels, then it is considered to be noise-dominated and hence unusable.
| Quadrant | # 1 sec bins | Bins with >0 counts | Bins with >2000 counts | High rate bins dominated by noise | Noise dominated (total time) | Noise dominated (detector-on time) | Marked lightcurve |
|---|---|---|---|---|---|---|---|
| A | 8986 | 8862 | 14 | 14 | 0.16% | 0.16% | 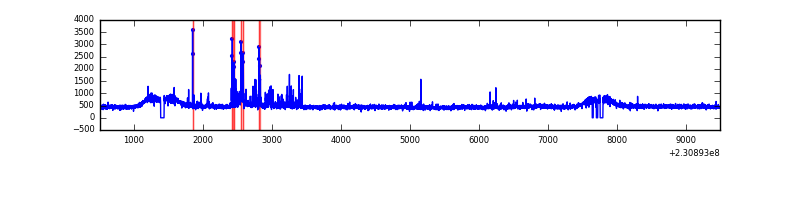 |
| B | 8986 | 8864 | 34 | 34 | 0.38% | 0.38% | 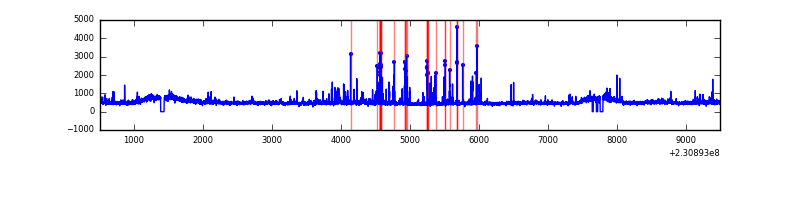 |
| C | 8986 | 8865 | 0 | 0 | 0.00% | 0.00% | 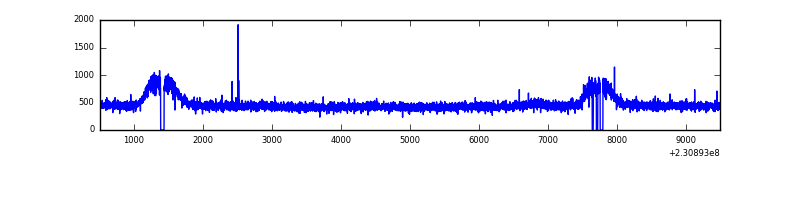 |
| D | 8986 | 8863 | 9 | 9 | 0.10% | 0.10% | 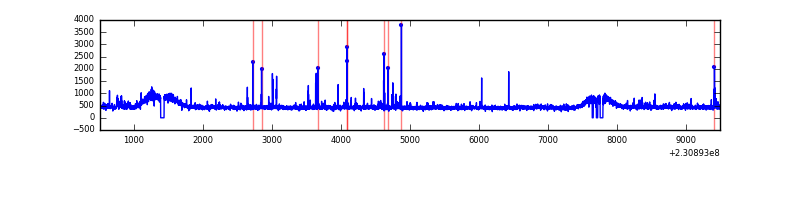 |
Top three noisy pixels from each quadrant. If the there are fewer than three noisy pixels in the level2.evt file, extra rows are filled as -1
| Pixel properties | Quadrant properties | ||||||
|---|---|---|---|---|---|---|---|
| Quadrant | DetID | PixID | Counts | Sigma | Mean | Median | Sigma |
| A | 15 | 223 | 160403 | 716.44 | 1078 | 1050 | 222.4 |
| A | 15 | 239 | 49171 | 216.35 | 1078 | 1050 | 222.4 |
| A | 13 | 251 | 40706 | 178.29 | 1078 | 1050 | 222.4 |
| B | 10 | 16 | 235587 | 1122.75 | 1079 | 1048 | 208.9 |
| B | 15 | 255 | 89298 | 422.46 | 1079 | 1048 | 208.9 |
| B | 0 | 214 | 70466 | 332.31 | 1079 | 1048 | 208.9 |
| C | 13 | 61 | 8146 | 28.82 | 1054 | 1053 | 246.1 |
| C | 14 | 234 | 6723 | 23.04 | 1054 | 1053 | 246.1 |
| C | 8 | 222 | 6415 | 21.79 | 1054 | 1053 | 246.1 |
| D | 1 | 52 | 130066 | 498.78 | 1048 | 1018 | 258.7 |
| D | 2 | 234 | 25841 | 95.94 | 1048 | 1018 | 258.7 |
| D | 12 | 233 | 24899 | 92.3 | 1048 | 1018 | 258.7 |
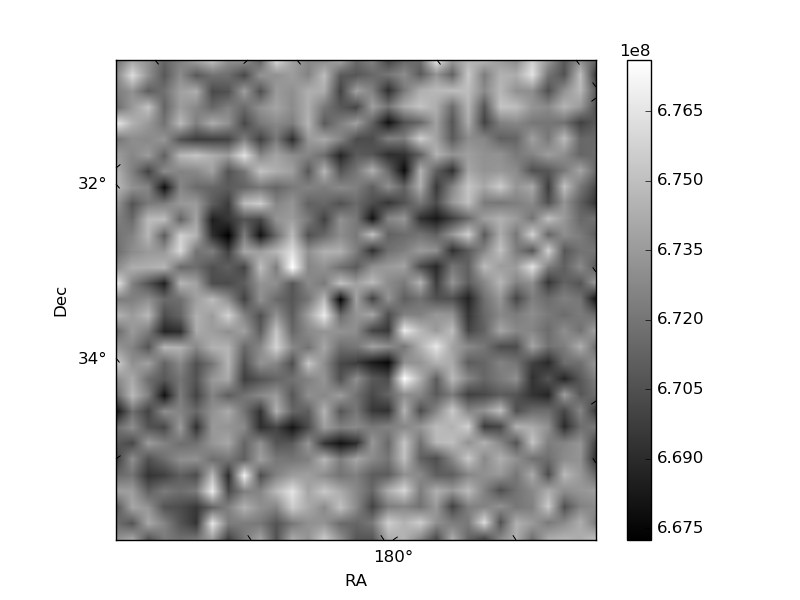
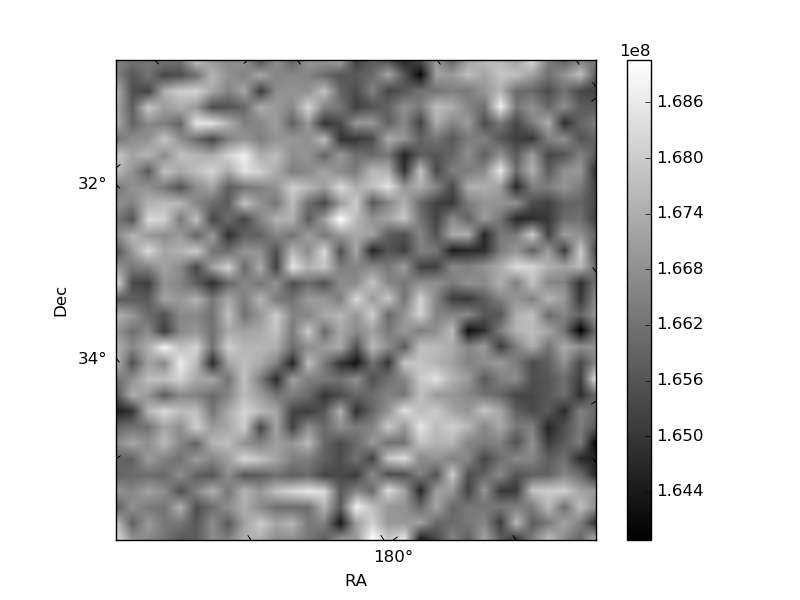
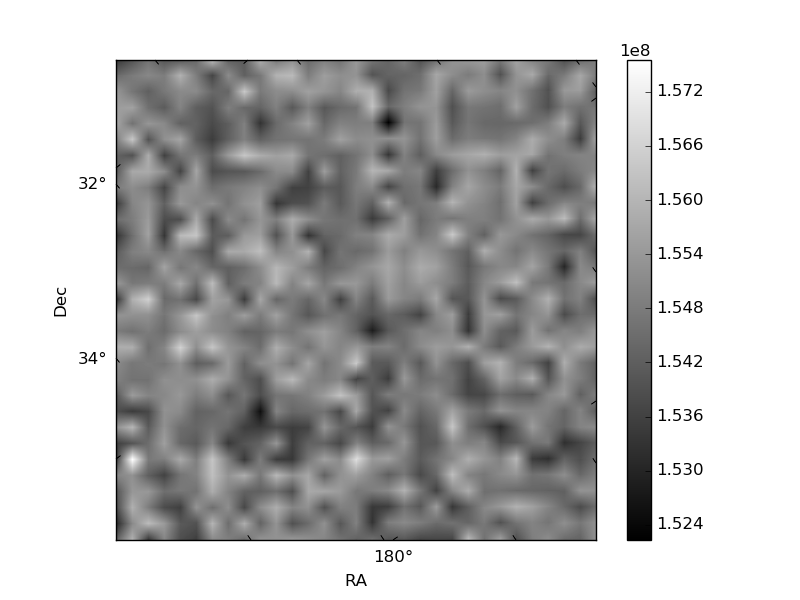
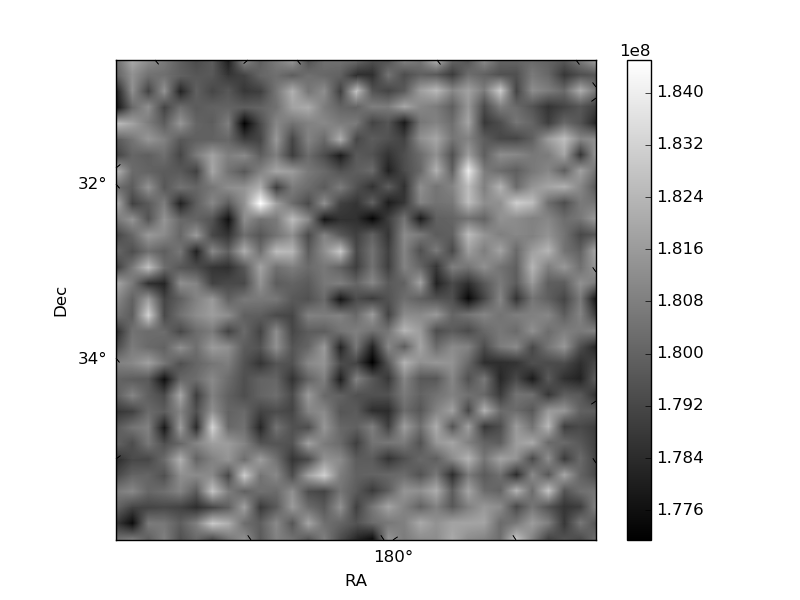
Histogram calculated using DETX and DETY for each event in the final _common_clean file
| Quadrant A | 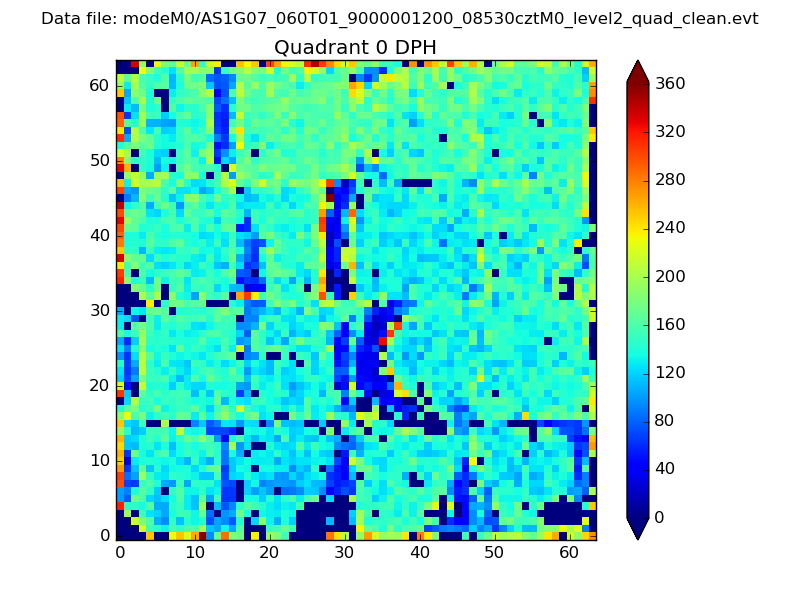 |
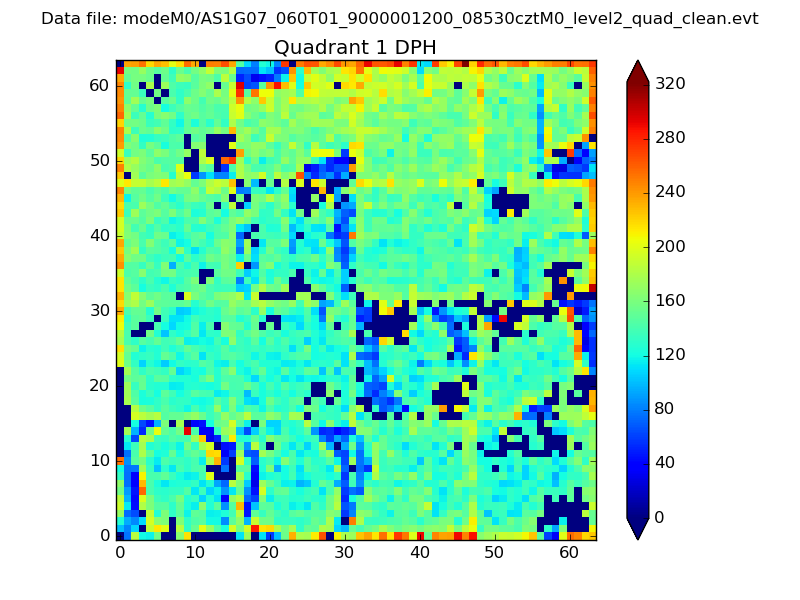 |
Quadrant B |
|---|---|---|---|
| Quadrant D | 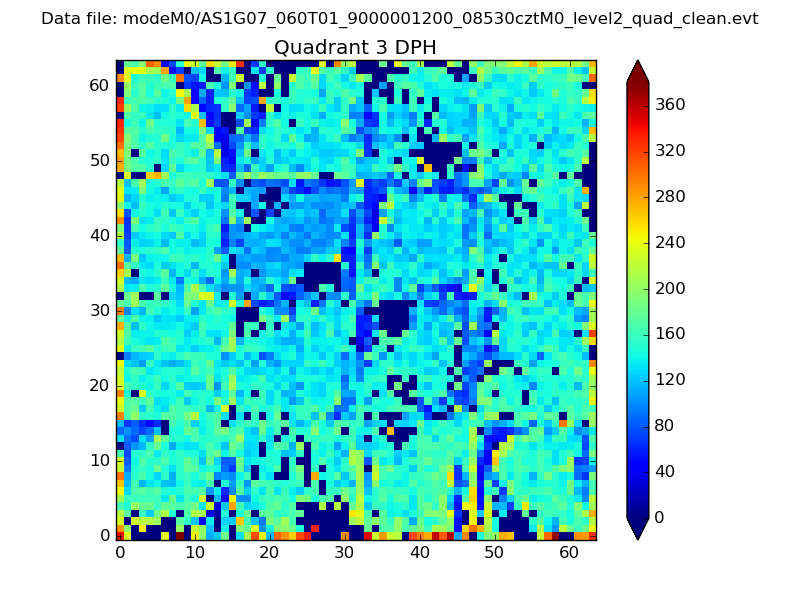 |
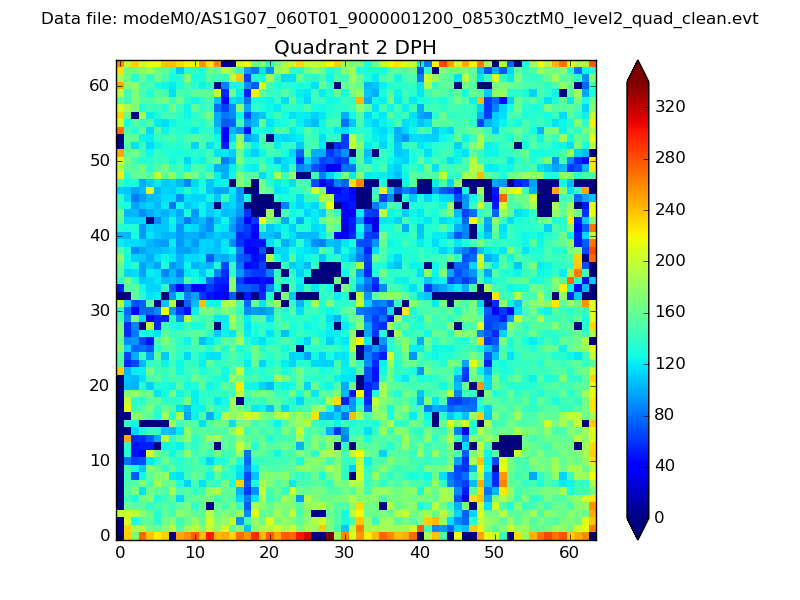 |
Quadrant C |
| Plot type | Count rate plots | Images |
|---|---|---|
| Comparison with Poisson distribution Blue bars denote a histogram of data divided into 1 sec bins. Red curve is a Poisson curve with rate = median count rate of data. |
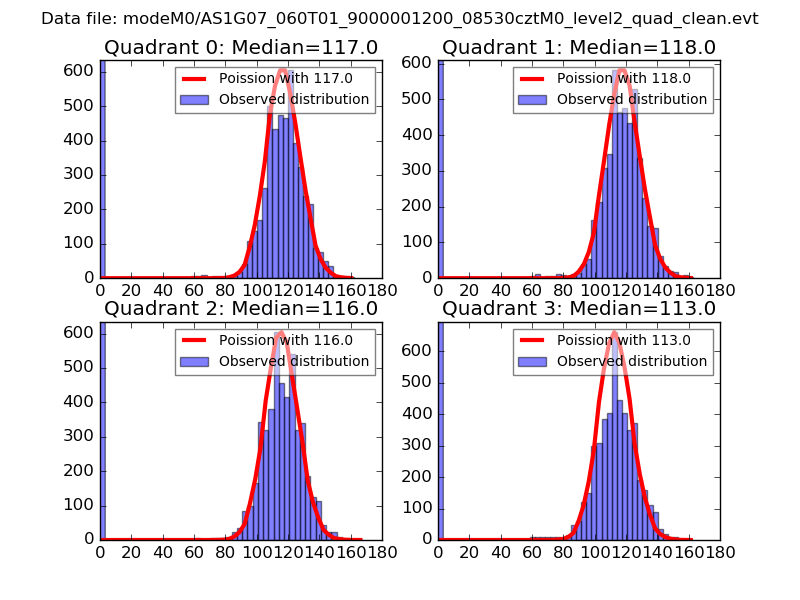 |
 |
| Quadrant-wise count rates Data is divided into 100 sec bins |
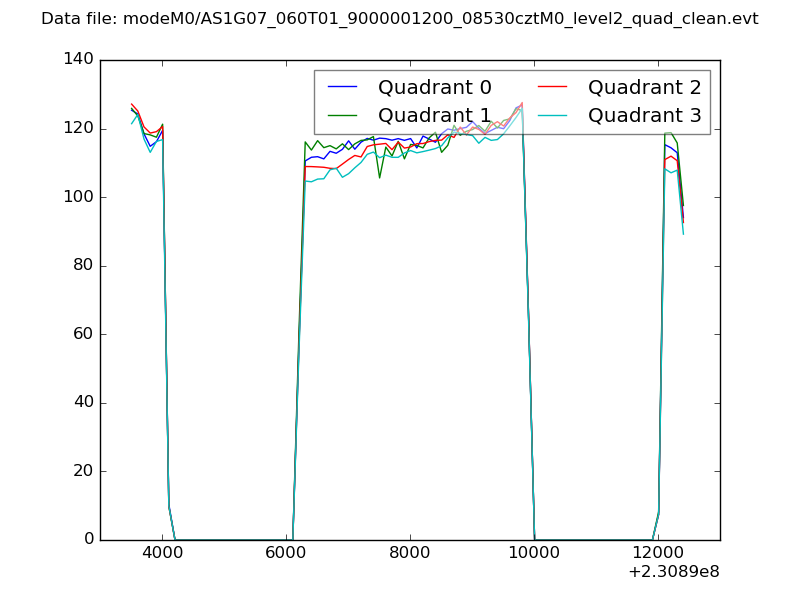 |
|
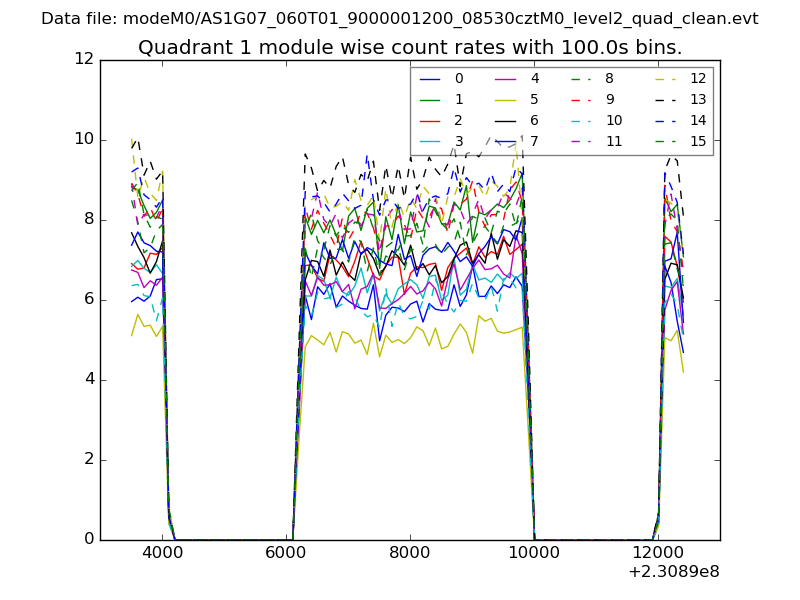
| Module-wise count rates for Quadrant A Data is divided into 100 sec bins |
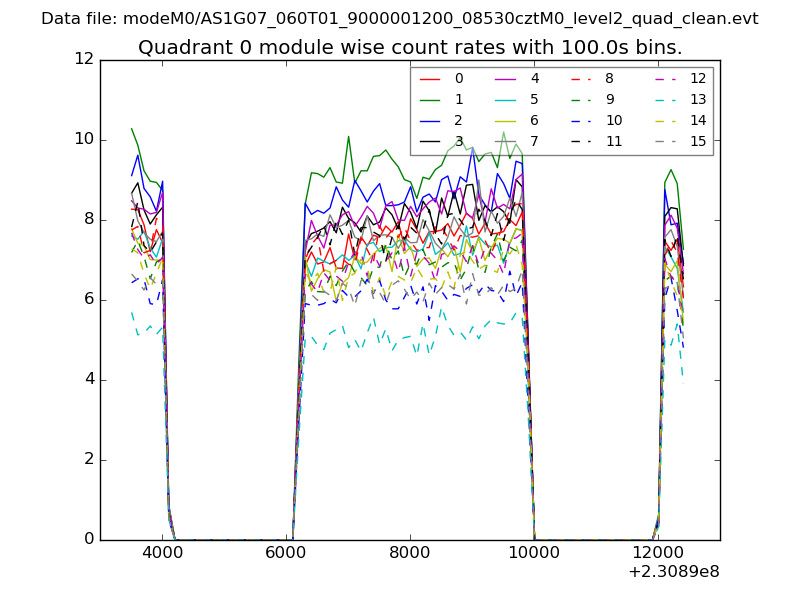 |
 |
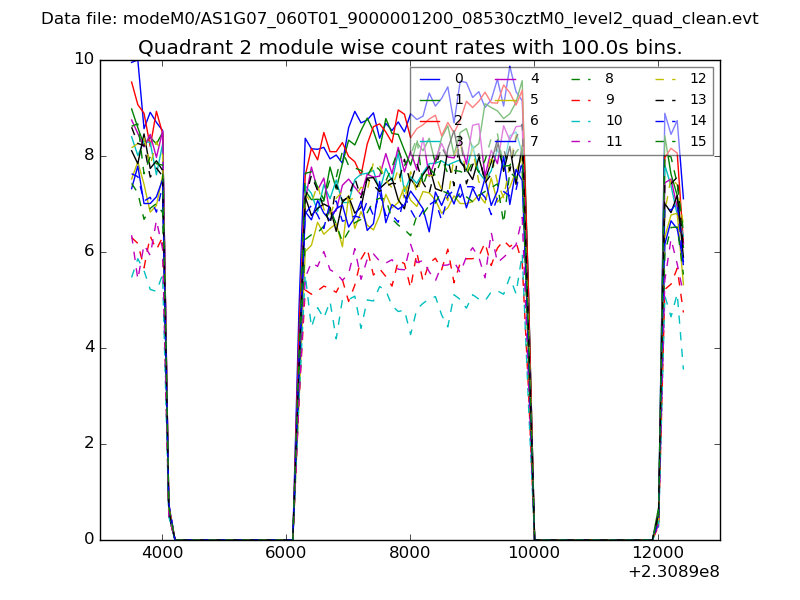
| Module-wise count rates for Quadrant B Data is divided into 100 sec bins |
 |
 |
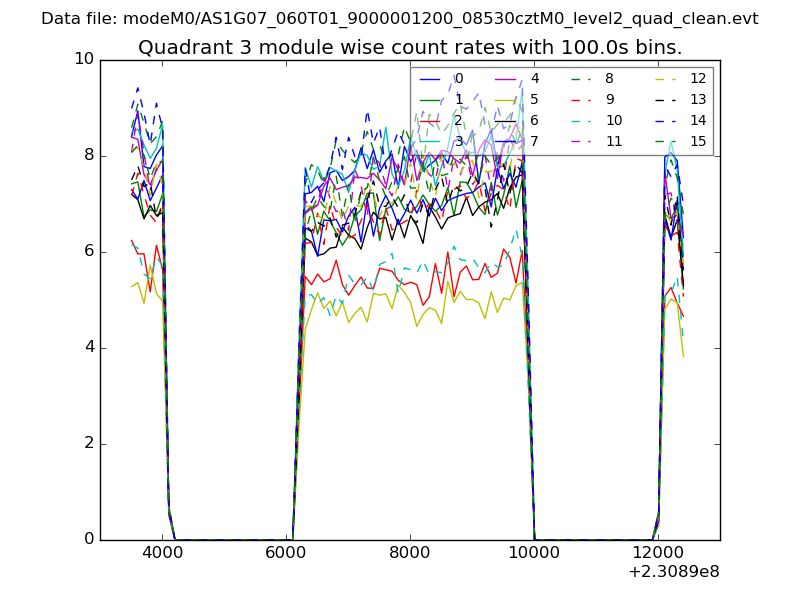
| Module-wise count rates for Quadrant C Data is divided into 100 sec bins |
 |
 |
| Module-wise count rates for Quadrant D Data is divided into 100 sec bins |
 |
 |
| Parameter | Plot |
|---|---|
| CZT HV Monitor | 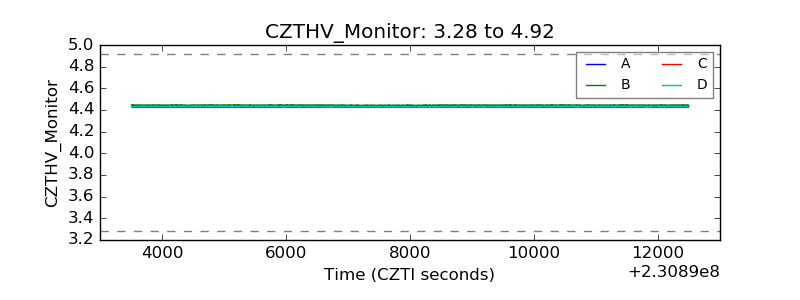 |
| D_VDD | 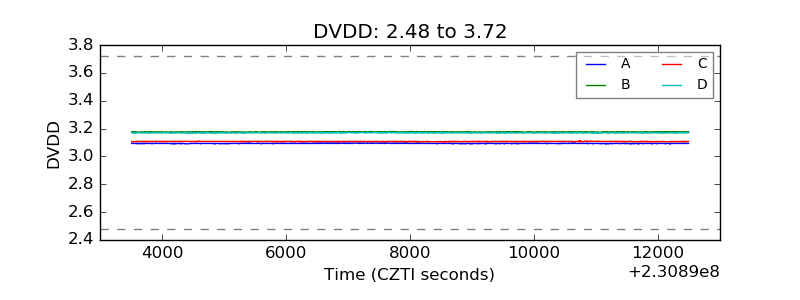 |
| Temperature 1 | 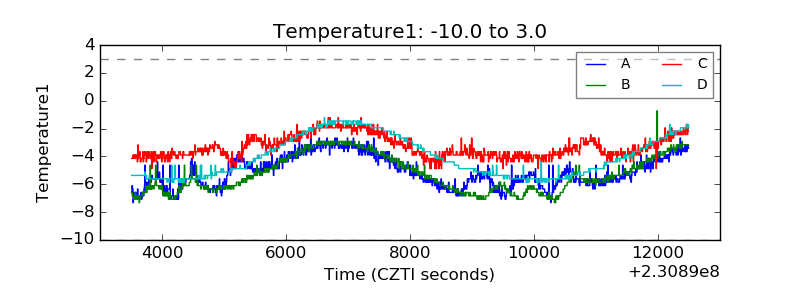 |
| Veto HV Monitor | 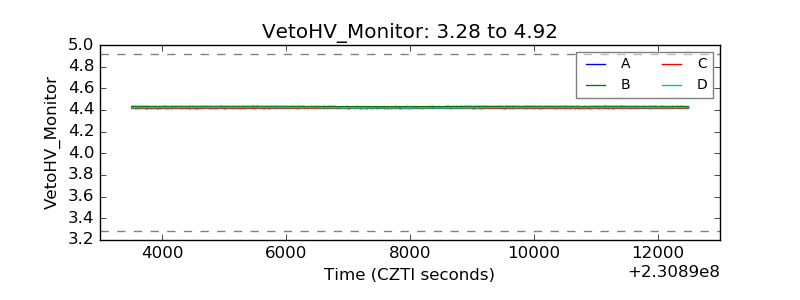 |
| Veto LLD |  |
| Alpha Counter | 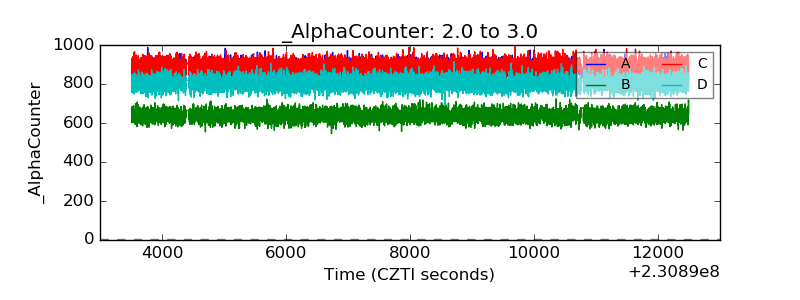 |
| _CPM_Rate | 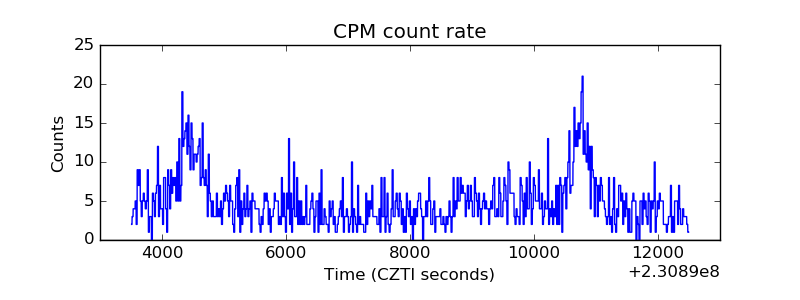 |
| CZT Counter | 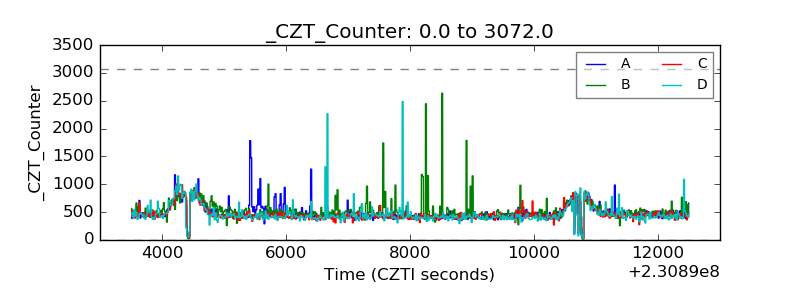 |
| +2.5 Volts monitor |  |
| +5 Volts monitor |  |
| _ROLL_ROT | 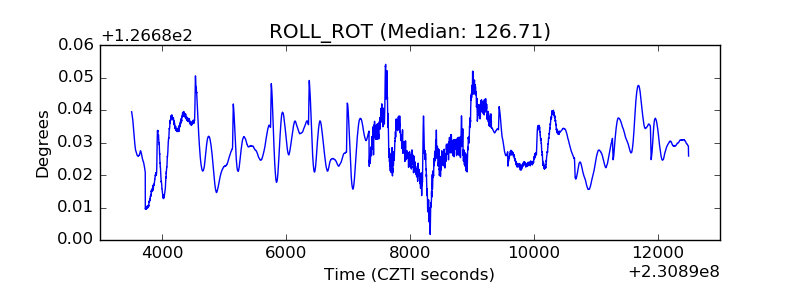 |
| _Roll_DEC | 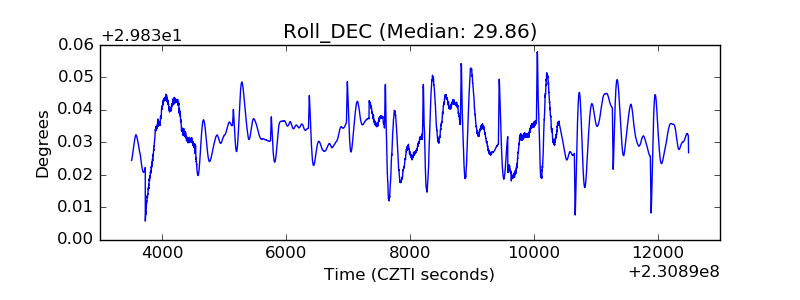 |
| _Roll_RA | 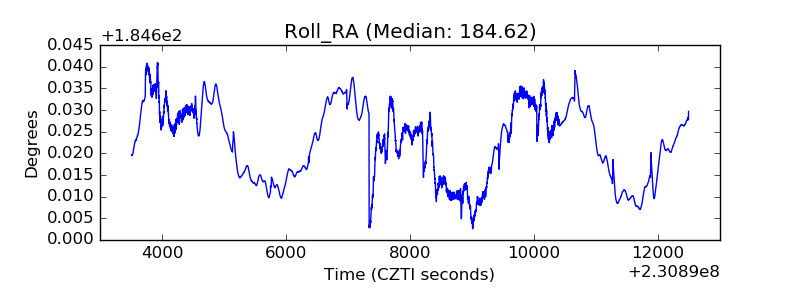 |
| Veto Counter | 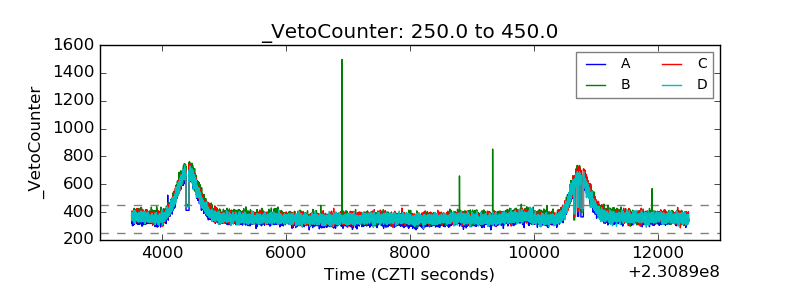 |