| Param | Original file | Final file |
|---|---|---|
| Filename | modeM0/AS1G07_060T01_9000001200_08533cztM0_level2.evt | modeM0/AS1G07_060T01_9000001200_08533cztM0_level2_quad_clean.evt |
| Size (bytes) | 558,403,200 | 94,878,720 |
| Size | 532.5 MB | 90.5 MB |
| Events in quadrant A | 3,932,012 | 579,849 |
| Events in quadrant B | 4,440,882 | 579,617 |
| Events in quadrant C | 3,875,431 | 569,425 |
| Events in quadrant D | 4,086,360 | 555,135 |
| Mode SS | |||
|---|---|---|---|
| Quadrant | BADHDUFLAG | Total packets | Discarded packets |
| A | 0 | 174 | 0 |
| B | 0 | 174 | 0 |
| C | 0 | 174 | 0 |
| D | 0 | 174 | 0 |
| Mode M0 | |||
|---|---|---|---|
| Quadrant | BADHDUFLAG | Total packets | Discarded packets |
| A | 0 | 17632 | 4 |
| B | 0 | 18773 | 7 |
| C | 0 | 17584 | 3 |
| D | 0 | 18224 | 3 |
| Mode M9 | |||
|---|---|---|---|
| Quadrant | BADHDUFLAG | Total packets | Discarded packets |
| A | 0 | 4 | 0 |
| B | 0 | 4 | 0 |
| C | 0 | 4 | 0 |
| D | 0 | 4 | 0 |
| Quadrant | Total seconds | Saturated seconds | Saturation percentage |
|---|---|---|---|
| A | 8482 | 382 | 4.503655% |
| B | 8480 | 456 | 5.377358% |
| C | 8482 | 291 | 3.430795% |
| D | 8482 | 333 | 3.925961% |
Noise dominated data is calculated using 1-second bins in cleaned event files. If a bin has >2000 counts, and if more than 50% of those come from <1% of pixels, then it is considered to be noise-dominated and hence unusable.
| Quadrant | # 1 sec bins | Bins with >0 counts | Bins with >2000 counts | High rate bins dominated by noise | Noise dominated (total time) | Noise dominated (detector-on time) | Marked lightcurve |
|---|---|---|---|---|---|---|---|
| A | 8852 | 8483 | 0 | 0 | 0.00% | 0.00% | 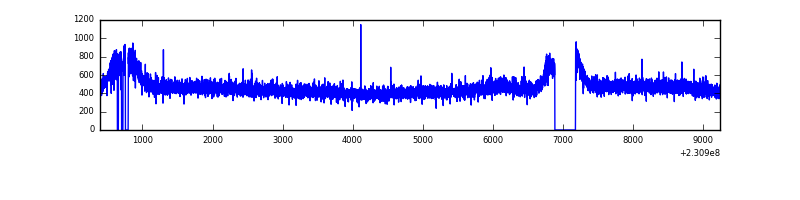 |
| B | 8852 | 8485 | 40 | 40 | 0.45% | 0.47% | 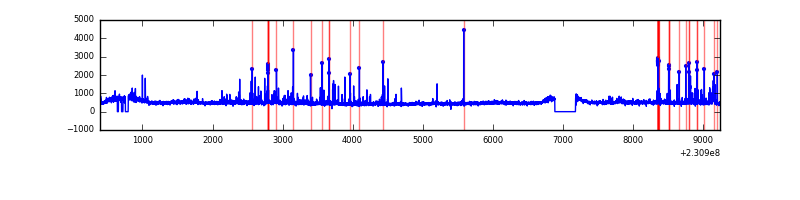 |
| C | 8852 | 8485 | 0 | 0 | 0.00% | 0.00% | 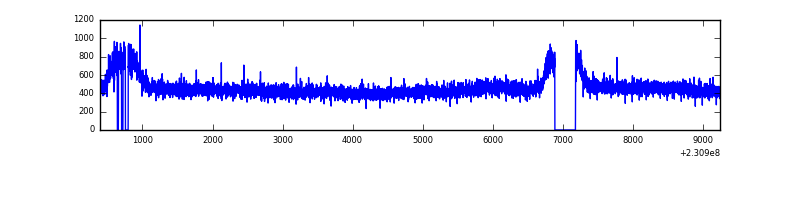 |
| D | 8852 | 8484 | 34 | 34 | 0.38% | 0.40% | 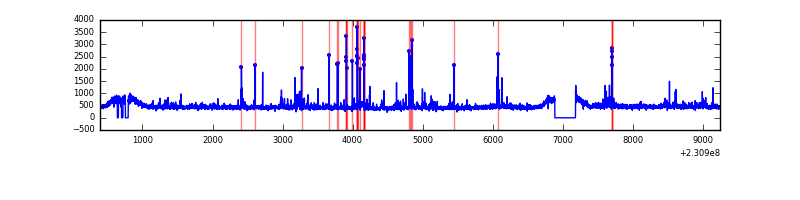 |
Top three noisy pixels from each quadrant. If the there are fewer than three noisy pixels in the level2.evt file, extra rows are filled as -1
| Pixel properties | Quadrant properties | ||||||
|---|---|---|---|---|---|---|---|
| Quadrant | DetID | PixID | Counts | Sigma | Mean | Median | Sigma |
| A | 13 | 251 | 16720 | 75.08 | 1015 | 988 | 209.5 |
| A | 8 | 5 | 13079 | 57.7 | 1015 | 988 | 209.5 |
| A | 0 | 226 | 9551 | 40.87 | 1015 | 988 | 209.5 |
| B | 10 | 16 | 204723 | 1040.05 | 1011 | 981 | 195.9 |
| B | 0 | 214 | 149056 | 755.89 | 1011 | 981 | 195.9 |
| B | 15 | 255 | 53784 | 269.55 | 1011 | 981 | 195.9 |
| C | 8 | 128 | 7458 | 27.86 | 989 | 988 | 232.2 |
| C | 13 | 61 | 7401 | 27.62 | 989 | 988 | 232.2 |
| C | 8 | 222 | 4752 | 16.21 | 989 | 988 | 232.2 |
| D | 1 | 52 | 268856 | 1112.0 | 987 | 958 | 240.9 |
| D | 2 | 234 | 26495 | 106.0 | 987 | 958 | 240.9 |
| D | 9 | 64 | 26300 | 105.19 | 987 | 958 | 240.9 |
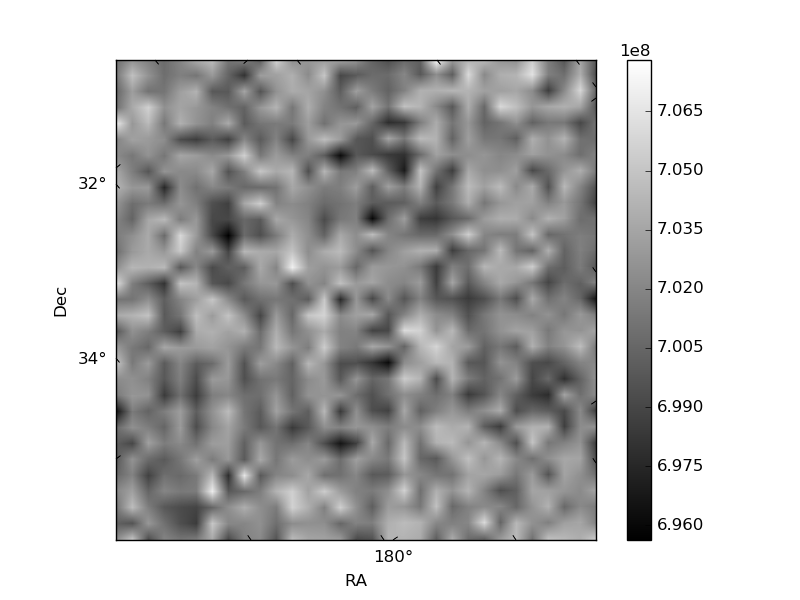
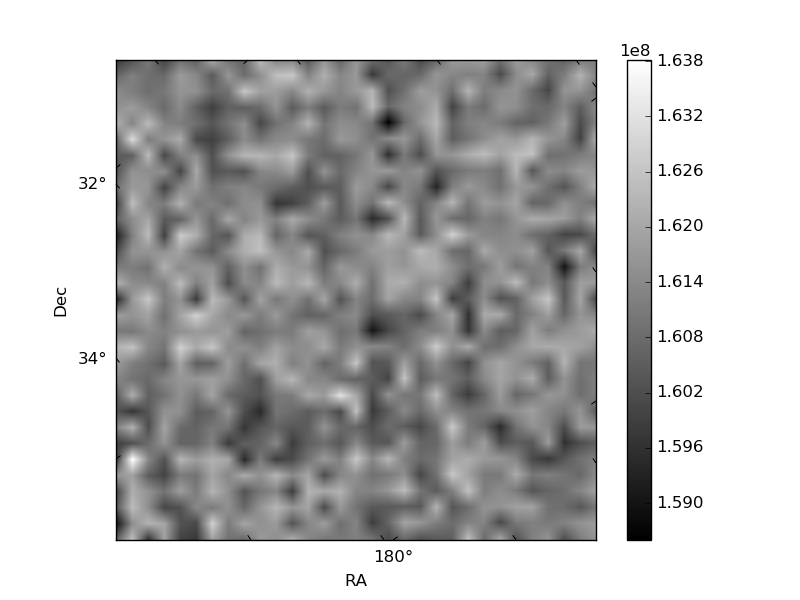
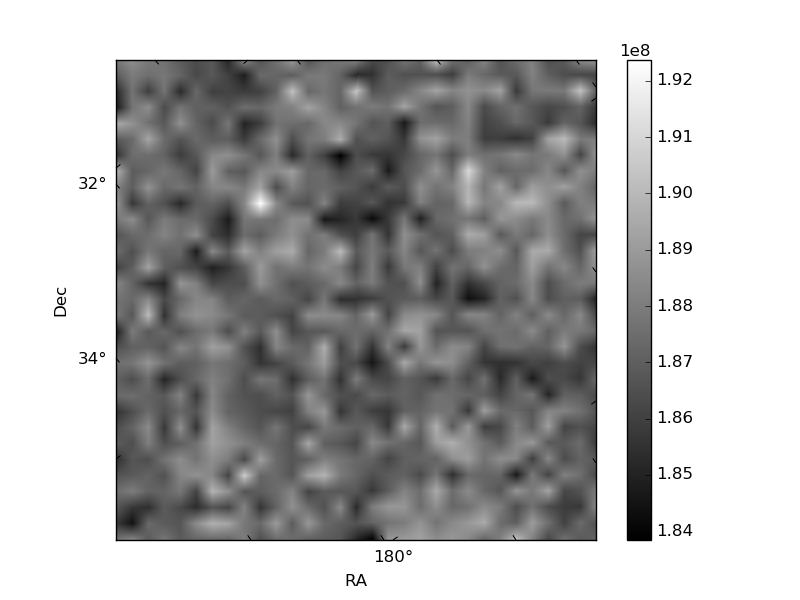
Histogram calculated using DETX and DETY for each event in the final _common_clean file
| Quadrant A | 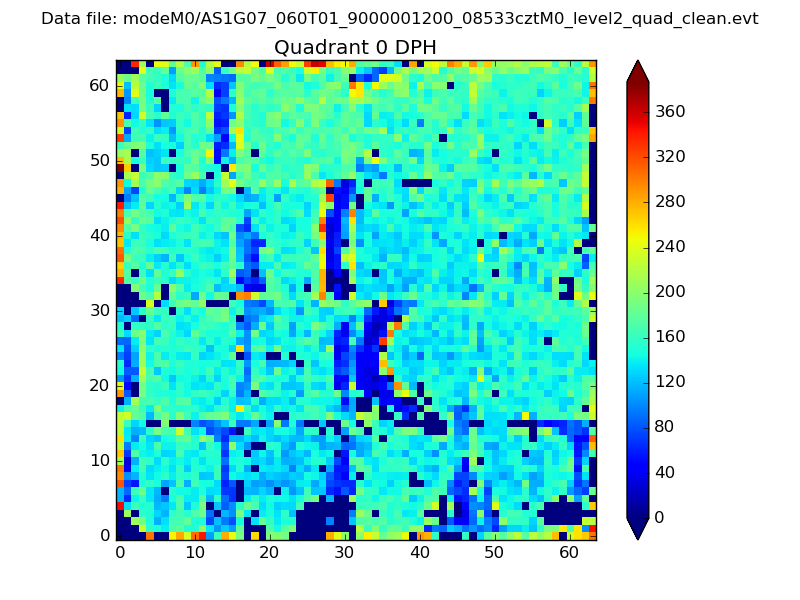 |
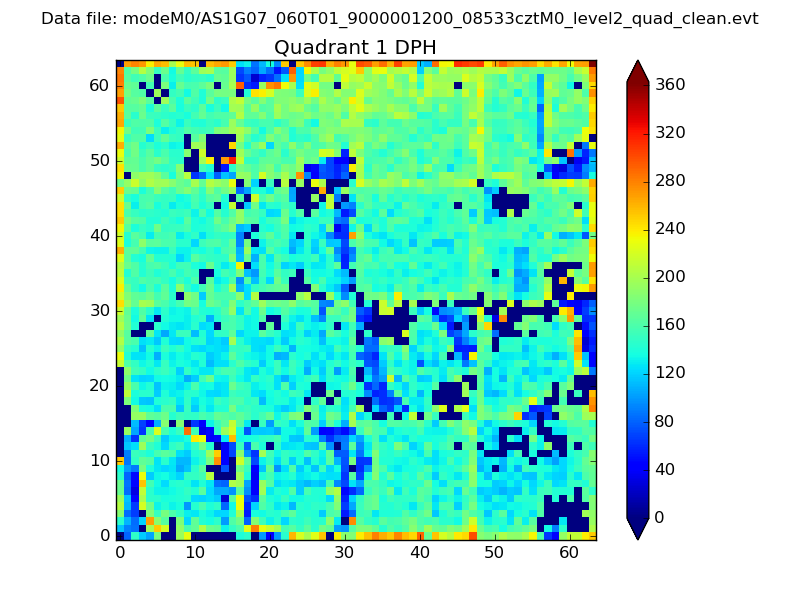 |
Quadrant B |
|---|---|---|---|
| Quadrant D | 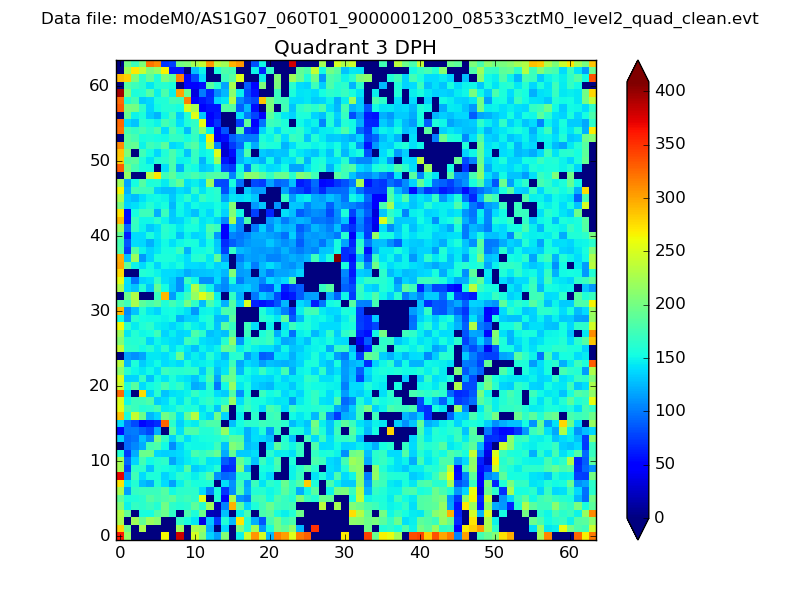 |
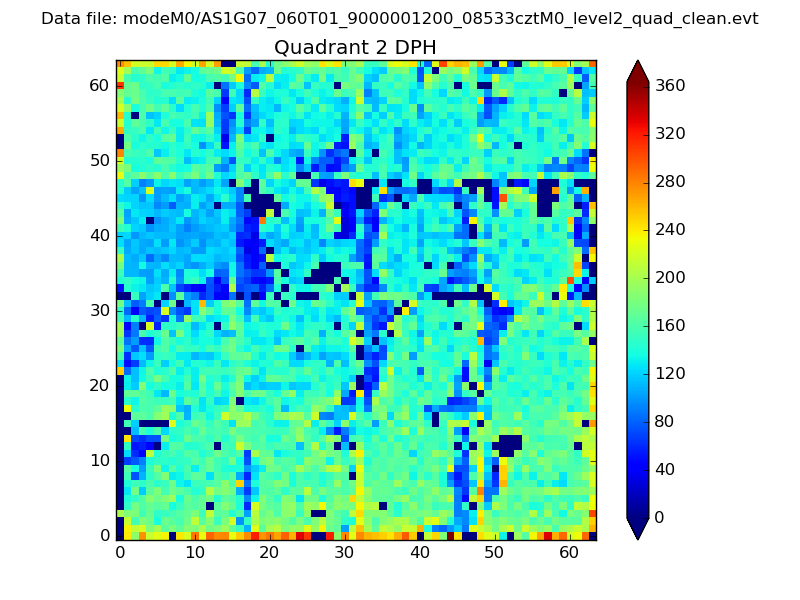 |
Quadrant C |
| Plot type | Count rate plots | Images |
|---|---|---|
| Comparison with Poisson distribution Blue bars denote a histogram of data divided into 1 sec bins. Red curve is a Poisson curve with rate = median count rate of data. |
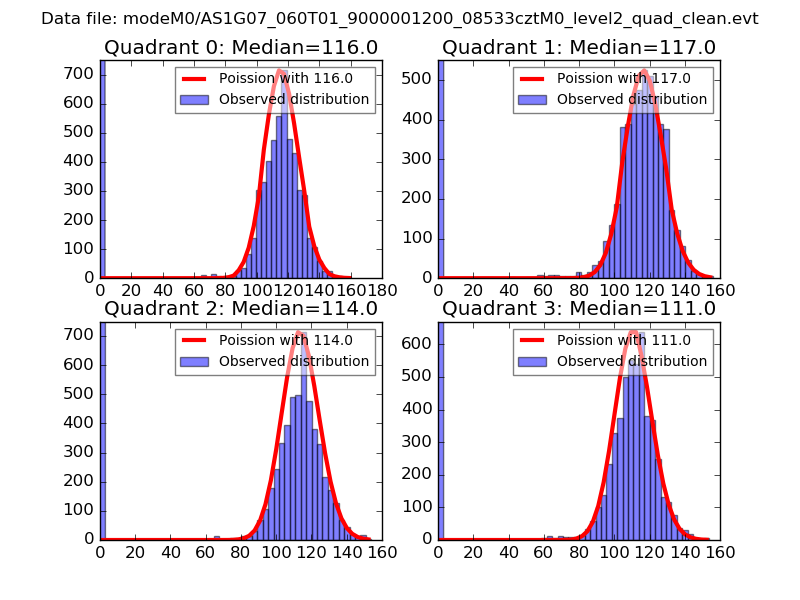 |
 |
| Quadrant-wise count rates Data is divided into 100 sec bins |
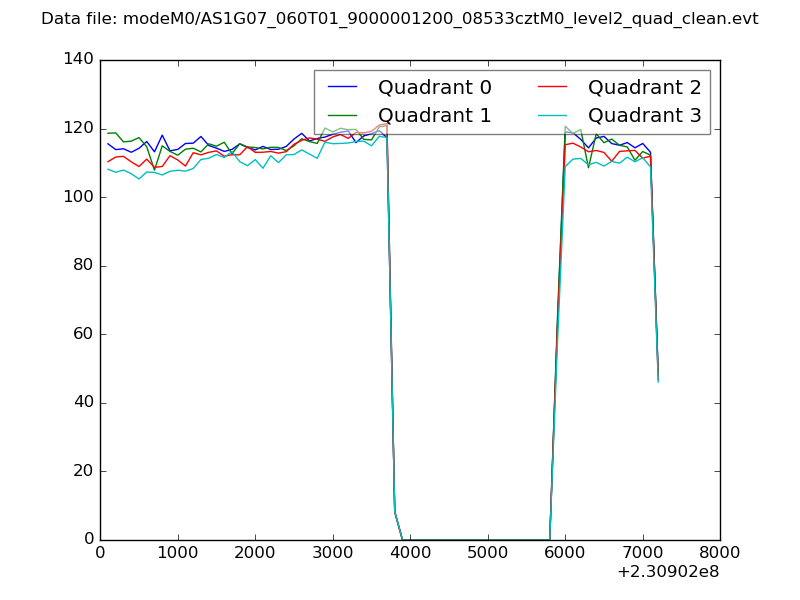 |
|
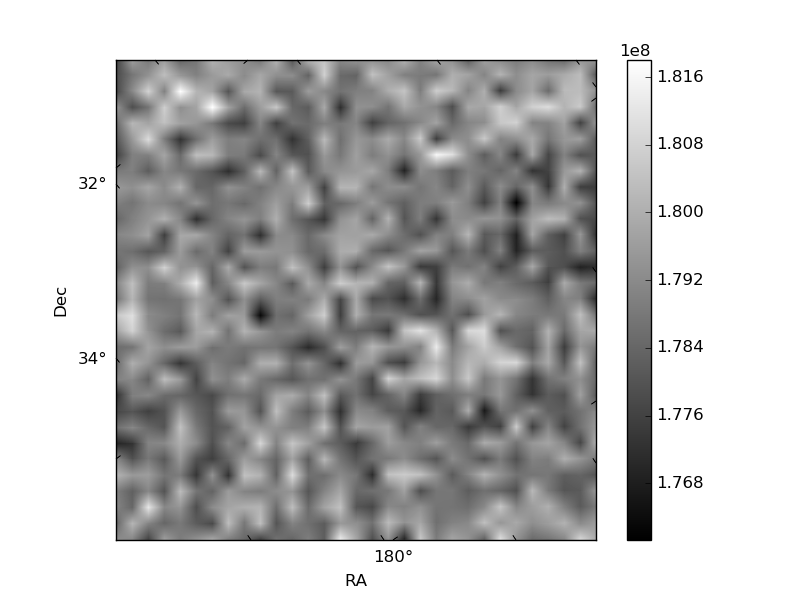
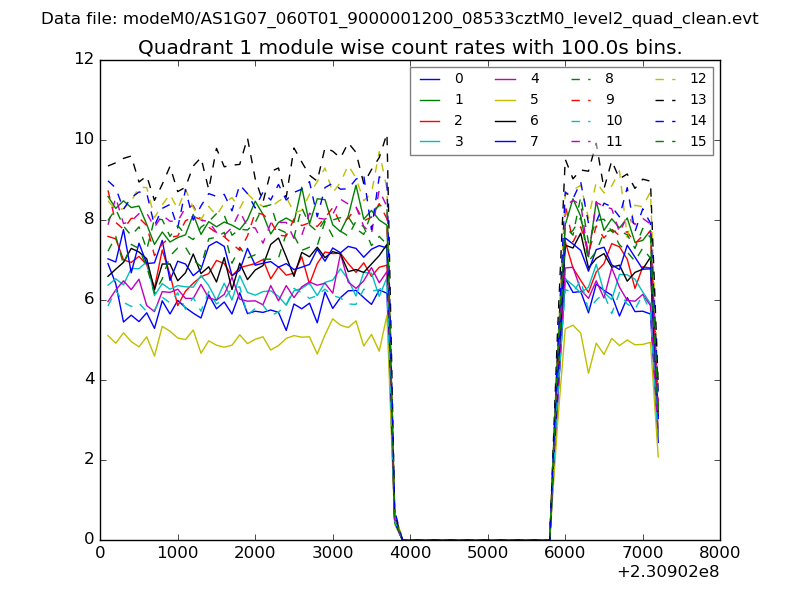
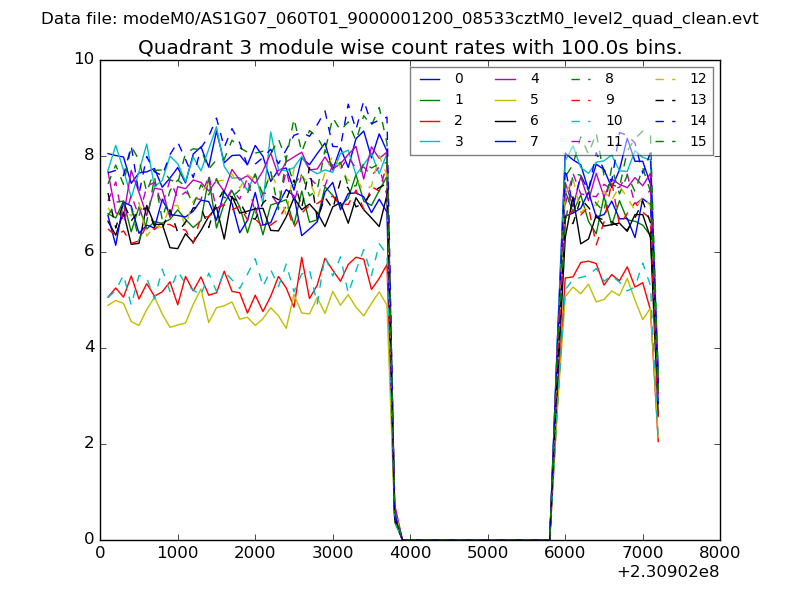
| Module-wise count rates for Quadrant A Data is divided into 100 sec bins |
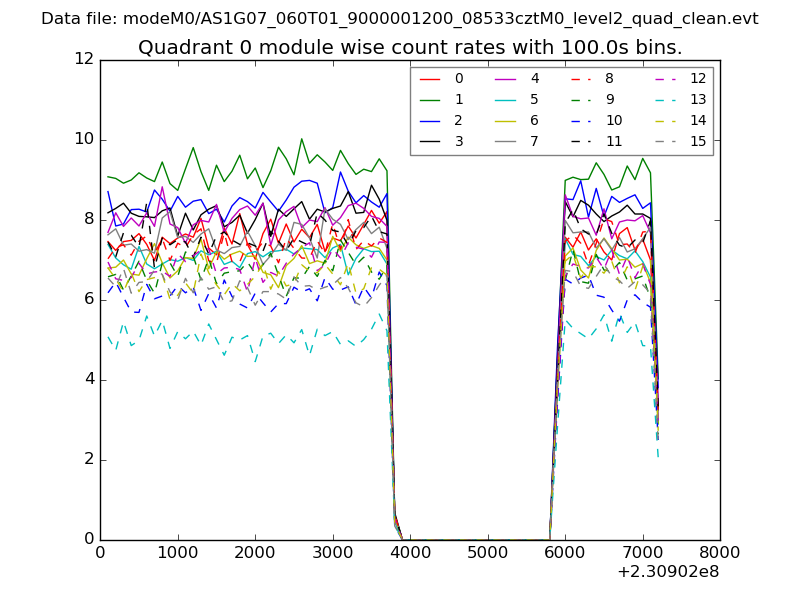 |
 |
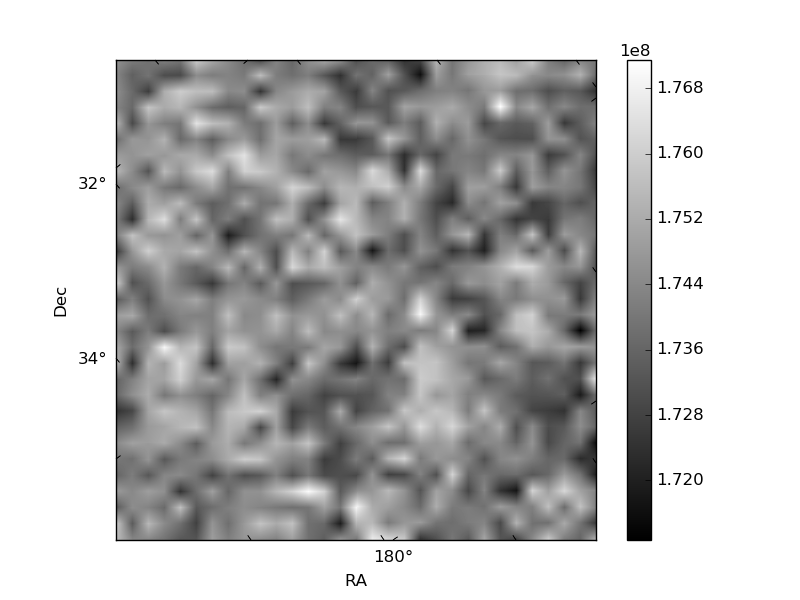
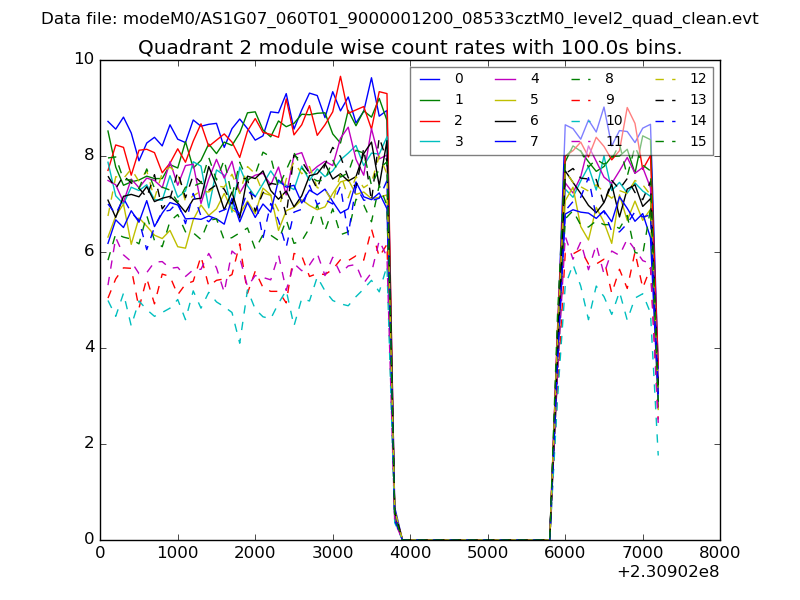
| Module-wise count rates for Quadrant B Data is divided into 100 sec bins |
 |
 |
| Module-wise count rates for Quadrant C Data is divided into 100 sec bins |
 |
 |
| Module-wise count rates for Quadrant D Data is divided into 100 sec bins |
 |
 |
| Parameter | Plot |
|---|---|
| CZT HV Monitor | 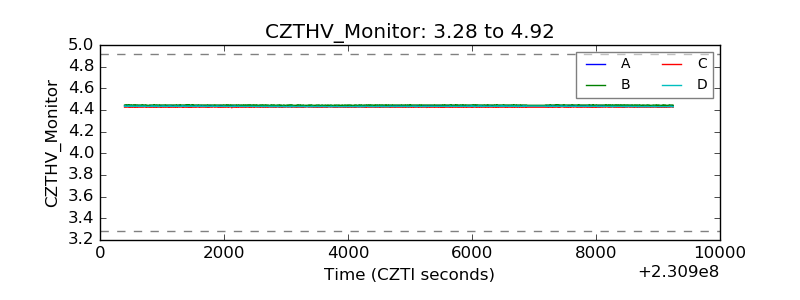 |
| D_VDD |  |
| Temperature 1 | 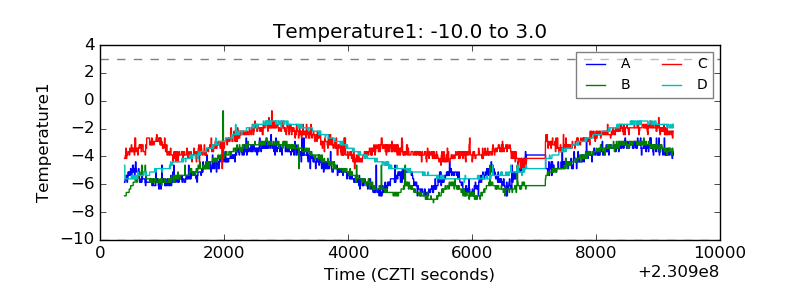 |
| Veto HV Monitor | 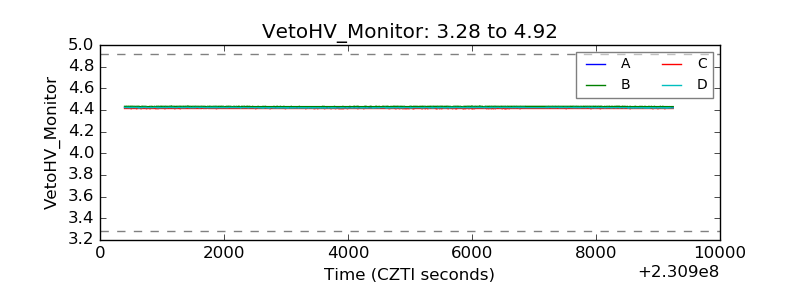 |
| Veto LLD | 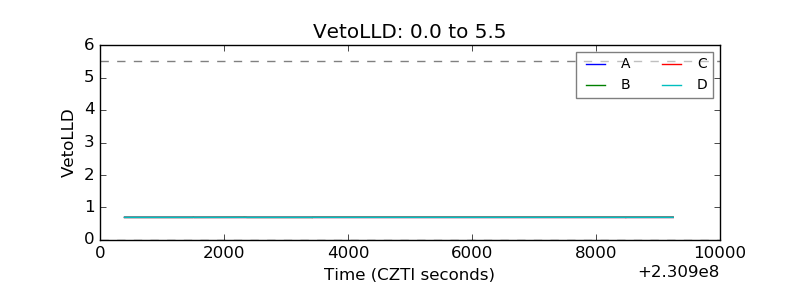 |
| Alpha Counter | 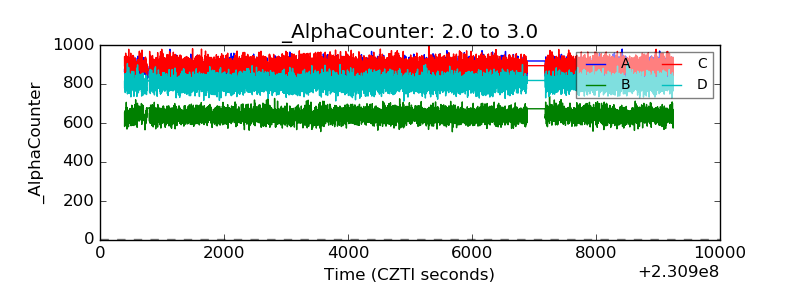 |
| _CPM_Rate | 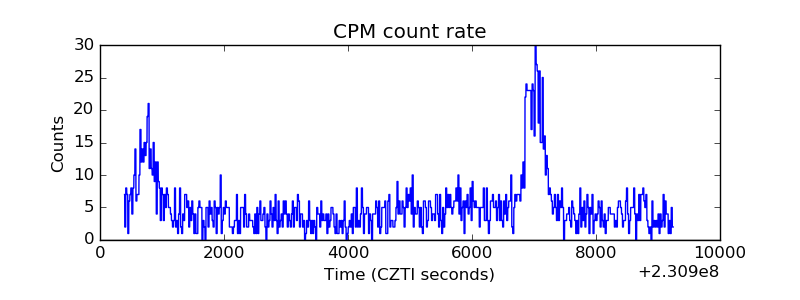 |
| CZT Counter | 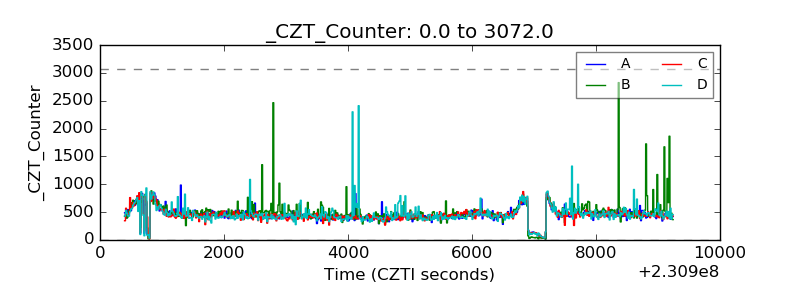 |
| +2.5 Volts monitor | 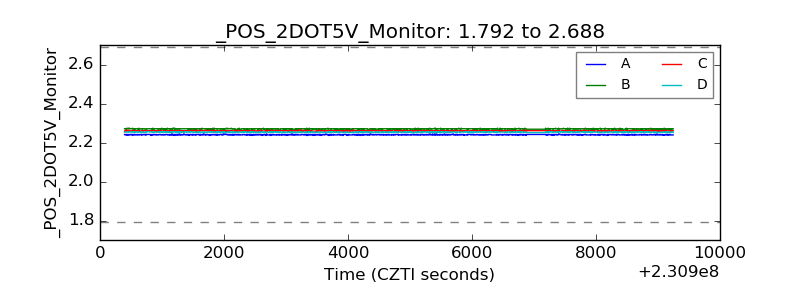 |
| +5 Volts monitor | 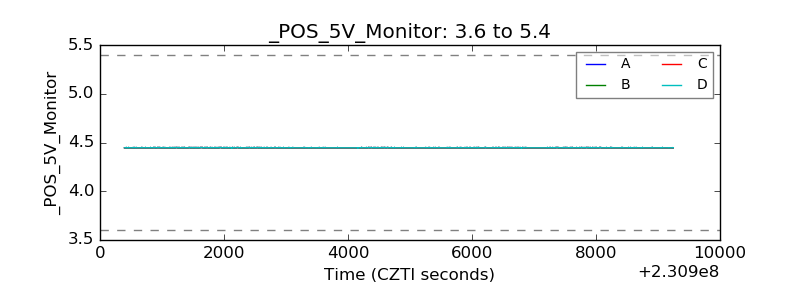 |
| _ROLL_ROT | 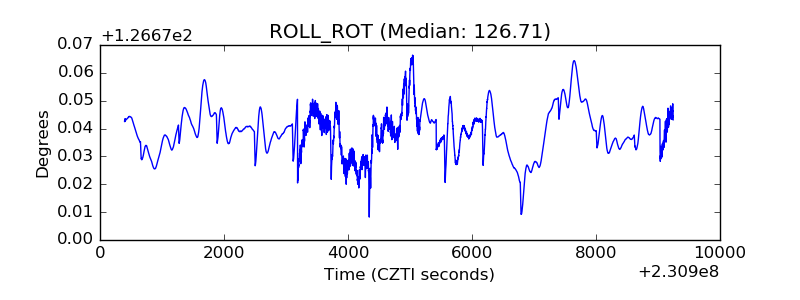 |
| _Roll_DEC |  |
| _Roll_RA | 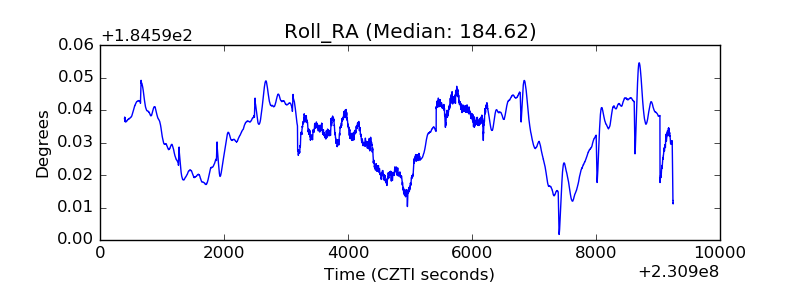 |
| Veto Counter | 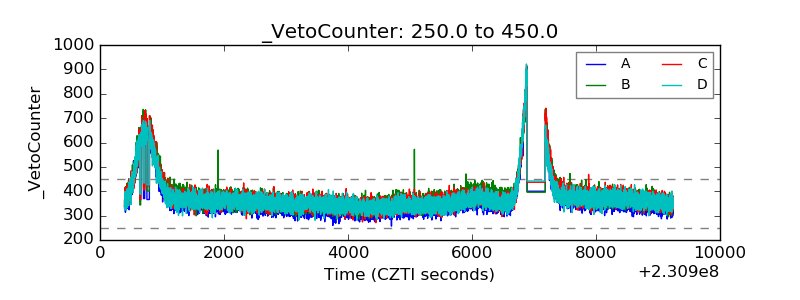 |