| Param | Original file | Final file |
|---|---|---|
| Filename | modeM0/AS1G07_060T01_9000001200_08534cztM0_level2.evt | modeM0/AS1G07_060T01_9000001200_08534cztM0_level2_quad_clean.evt |
| Size (bytes) | 1,077,088,320 | 216,636,480 |
| Size | 1.0 GB | 206.6 MB |
| Events in quadrant A | 7,465,613 | 1,366,863 |
| Events in quadrant B | 8,647,218 | 1,361,381 |
| Events in quadrant C | 7,382,493 | 1,357,573 |
| Events in quadrant D | 7,987,088 | 1,317,488 |
| Mode SS | |||
|---|---|---|---|
| Quadrant | BADHDUFLAG | Total packets | Discarded packets |
| A | 0 | 340 | 0 |
| B | 0 | 340 | 0 |
| C | 0 | 340 | 0 |
| D | 0 | 340 | 0 |
| Mode M0 | |||
|---|---|---|---|
| Quadrant | BADHDUFLAG | Total packets | Discarded packets |
| A | 0 | 34316 | 4 |
| B | 0 | 37228 | 3 |
| C | 0 | 34190 | 7 |
| D | 0 | 36369 | 10 |
| Mode M9 | |||
|---|---|---|---|
| Quadrant | BADHDUFLAG | Total packets | Discarded packets |
| A | 0 | 22 | 0 |
| B | 0 | 22 | 0 |
| C | 0 | 22 | 0 |
| D | 0 | 22 | 0 |
| Quadrant | Total seconds | Saturated seconds | Saturation percentage |
|---|---|---|---|
| A | 16804 | 167 | 0.993811% |
| B | 16804 | 340 | 2.023328% |
| C | 16802 | 135 | 0.803476% |
| D | 16803 | 260 | 1.547343% |
Noise dominated data is calculated using 1-second bins in cleaned event files. If a bin has >2000 counts, and if more than 50% of those come from <1% of pixels, then it is considered to be noise-dominated and hence unusable.
| Quadrant | # 1 sec bins | Bins with >0 counts | Bins with >2000 counts | High rate bins dominated by noise | Noise dominated (total time) | Noise dominated (detector-on time) | Marked lightcurve |
|---|---|---|---|---|---|---|---|
| A | 18914 | 16805 | 1 | 1 | 0.01% | 0.01% | 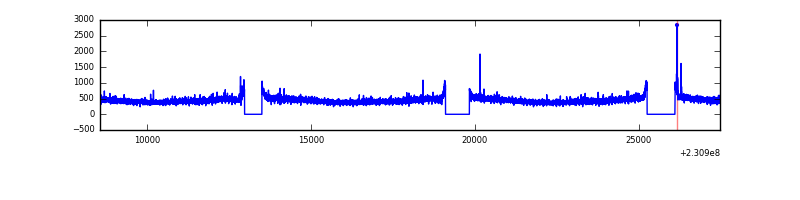 |
| B | 18914 | 16805 | 156 | 156 | 0.82% | 0.93% | 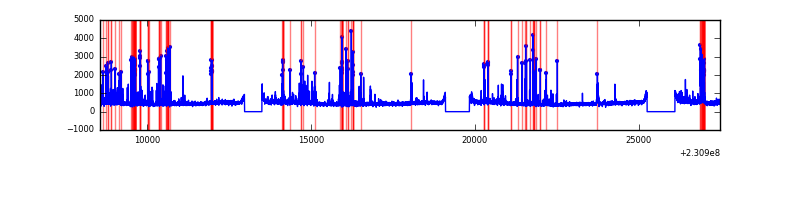 |
| C | 18914 | 16806 | 0 | 0 | 0.00% | 0.00% | 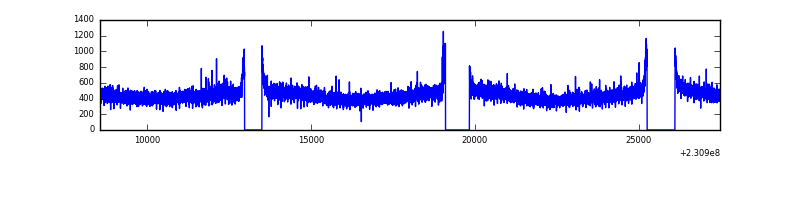 |
| D | 18914 | 16805 | 77 | 77 | 0.41% | 0.46% | 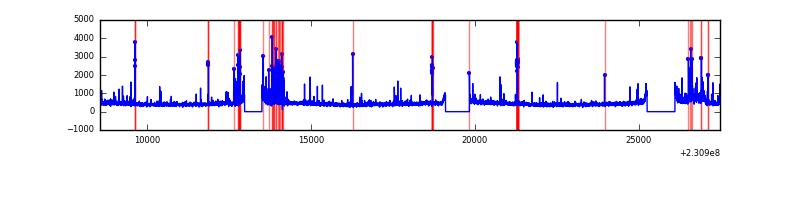 |
Top three noisy pixels from each quadrant. If the there are fewer than three noisy pixels in the level2.evt file, extra rows are filled as -1
| Pixel properties | Quadrant properties | ||||||
|---|---|---|---|---|---|---|---|
| Quadrant | DetID | PixID | Counts | Sigma | Mean | Median | Sigma |
| A | 5 | 16 | 26525 | 62.3 | 1929 | 1885 | 395.5 |
| A | 8 | 5 | 21693 | 50.09 | 1929 | 1885 | 395.5 |
| A | 0 | 226 | 17876 | 40.43 | 1929 | 1885 | 395.5 |
| B | 10 | 16 | 881425 | 2397.73 | 1922 | 1876 | 366.8 |
| B | 0 | 214 | 113084 | 303.16 | 1922 | 1876 | 366.8 |
| B | 10 | 252 | 63016 | 166.67 | 1922 | 1876 | 366.8 |
| C | 13 | 61 | 14022 | 27.63 | 1886 | 1892 | 439.1 |
| C | 8 | 222 | 10657 | 19.96 | 1886 | 1892 | 439.1 |
| C | 8 | 128 | 9637 | 17.64 | 1886 | 1892 | 439.1 |
| D | 1 | 52 | 431535 | 946.46 | 1865 | 1821 | 454.0 |
| D | 14 | 34 | 117424 | 254.62 | 1865 | 1821 | 454.0 |
| D | 13 | 122 | 72433 | 155.53 | 1865 | 1821 | 454.0 |
Histogram calculated using DETX and DETY for each event in the final _common_clean file
| Quadrant A |  |
 |
Quadrant B |
|---|---|---|---|
| Quadrant D |  |
 |
Quadrant C |
| Plot type | Count rate plots | Images |
|---|---|---|
| Comparison with Poisson distribution Blue bars denote a histogram of data divided into 1 sec bins. Red curve is a Poisson curve with rate = median count rate of data. |
 |
 |
| Quadrant-wise count rates Data is divided into 100 sec bins |
 |
|
| Module-wise count rates for Quadrant A Data is divided into 100 sec bins |
 |
 |
| Module-wise count rates for Quadrant B Data is divided into 100 sec bins |
 |
 |
| Module-wise count rates for Quadrant C Data is divided into 100 sec bins |
 |
 |
| Module-wise count rates for Quadrant D Data is divided into 100 sec bins |
 |
 |
| Parameter | Plot |
|---|---|
| CZT HV Monitor |  |
| D_VDD |  |
| Temperature 1 |  |
| Veto HV Monitor |  |
| Veto LLD |  |
| Alpha Counter |  |
| _CPM_Rate |  |
| CZT Counter |  |
| +2.5 Volts monitor |  |
| +5 Volts monitor |  |
| _ROLL_ROT |  |
| _Roll_DEC |  |
| _Roll_RA |  |
| Veto Counter |  |