| Param | Original file | Final file |
|---|---|---|
| Filename | modeM0/AS1G07_060T01_9000001200_08539cztM0_level2.evt | modeM0/AS1G07_060T01_9000001200_08539cztM0_level2_quad_clean.evt |
| Size (bytes) | 397,134,720 | 86,518,080 |
| Size | 378.7 MB | 82.5 MB |
| Events in quadrant A | 2,929,623 | 552,137 |
| Events in quadrant B | 3,124,434 | 564,028 |
| Events in quadrant C | 2,809,718 | 546,882 |
| Events in quadrant D | 2,744,523 | 527,142 |
| Mode SS | |||
|---|---|---|---|
| Quadrant | BADHDUFLAG | Total packets | Discarded packets |
| A | 0 | 124 | 0 |
| B | 0 | 124 | 0 |
| C | 0 | 124 | 0 |
| D | 0 | 124 | 0 |
| Mode M0 | |||
|---|---|---|---|
| Quadrant | BADHDUFLAG | Total packets | Discarded packets |
| A | 0 | 12726 | 7 |
| B | 0 | 13315 | 5 |
| C | 0 | 12559 | 12 |
| D | 0 | 12628 | 6 |
| Mode M9 | |||
|---|---|---|---|
| Quadrant | BADHDUFLAG | Total packets | Discarded packets |
| A | 0 | 19 | 0 |
| B | 0 | 19 | 0 |
| C | 0 | 19 | 0 |
| D | 0 | 20 | 0 |
| Quadrant | Total seconds | Saturated seconds | Saturation percentage |
|---|---|---|---|
| A | 6161 | 10 | 0.162311% |
| B | 6162 | 60 | 0.973710% |
| C | 6158 | 4 | 0.064956% |
| D | 6161 | 4 | 0.064925% |
Noise dominated data is calculated using 1-second bins in cleaned event files. If a bin has >2000 counts, and if more than 50% of those come from <1% of pixels, then it is considered to be noise-dominated and hence unusable.
| Quadrant | # 1 sec bins | Bins with >0 counts | Bins with >2000 counts | High rate bins dominated by noise | Noise dominated (total time) | Noise dominated (detector-on time) | Marked lightcurve |
|---|---|---|---|---|---|---|---|
| A | 7493 | 6164 | 0 | 0 | 0.00% | 0.00% | 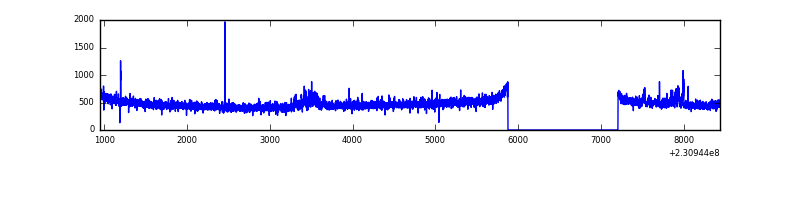 |
| B | 7493 | 6164 | 25 | 25 | 0.33% | 0.41% | 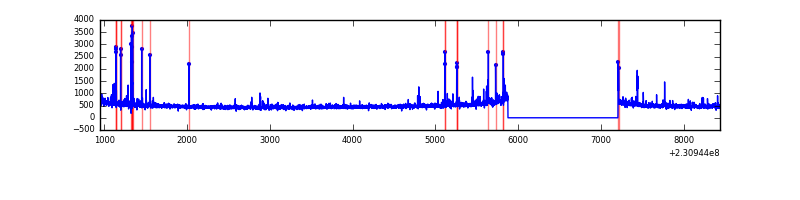 |
| C | 7493 | 6164 | 0 | 0 | 0.00% | 0.00% | 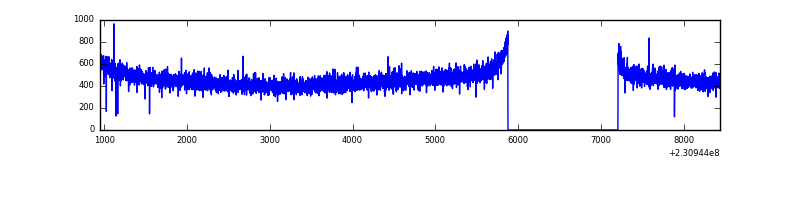 |
| D | 7493 | 6164 | 1 | 1 | 0.01% | 0.02% | 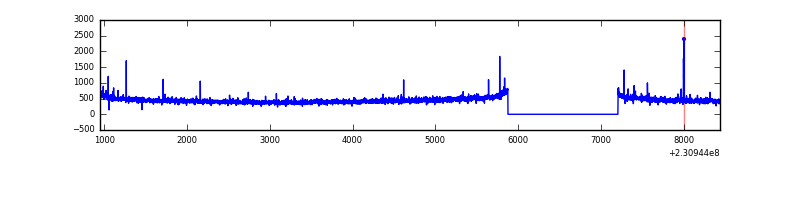 |
Top three noisy pixels from each quadrant. If the there are fewer than three noisy pixels in the level2.evt file, extra rows are filled as -1
| Pixel properties | Quadrant properties | ||||||
|---|---|---|---|---|---|---|---|
| Quadrant | DetID | PixID | Counts | Sigma | Mean | Median | Sigma |
| A | 13 | 251 | 85483 | 564.04 | 738 | 722 | 150.3 |
| A | 0 | 226 | 6916 | 41.22 | 738 | 722 | 150.3 |
| A | 12 | 194 | 6403 | 37.8 | 738 | 722 | 150.3 |
| B | 10 | 16 | 112919 | 788.66 | 745 | 728 | 142.3 |
| B | 0 | 214 | 65879 | 457.98 | 745 | 728 | 142.3 |
| B | 4 | 81 | 34798 | 239.5 | 745 | 728 | 142.3 |
| C | 13 | 61 | 5421 | 28.14 | 719 | 724 | 166.9 |
| C | 8 | 222 | 3353 | 15.75 | 719 | 724 | 166.9 |
| C | 3 | 202 | 1760 | 6.21 | 719 | 724 | 166.9 |
| D | 13 | 137 | 21669 | 122.0 | 706 | 688 | 172.0 |
| D | 2 | 234 | 20734 | 116.57 | 706 | 688 | 172.0 |
| D | 1 | 52 | 18652 | 104.46 | 706 | 688 | 172.0 |
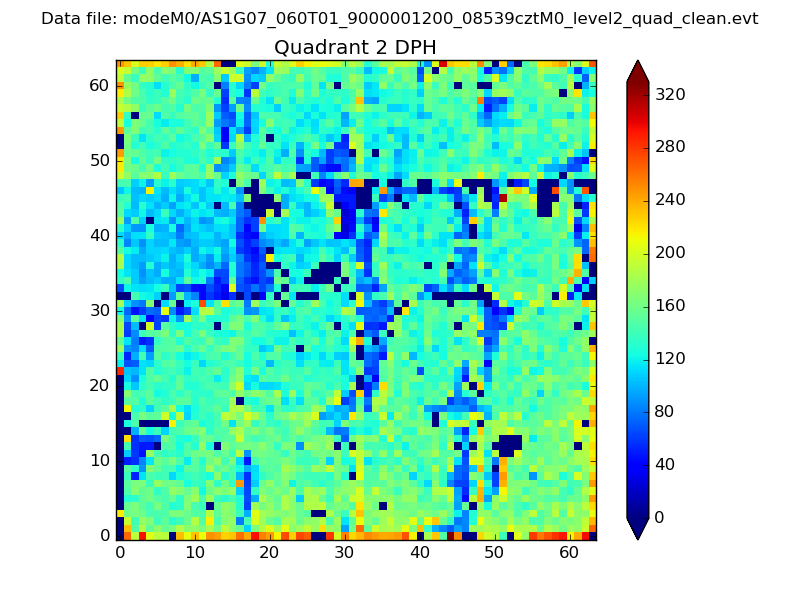
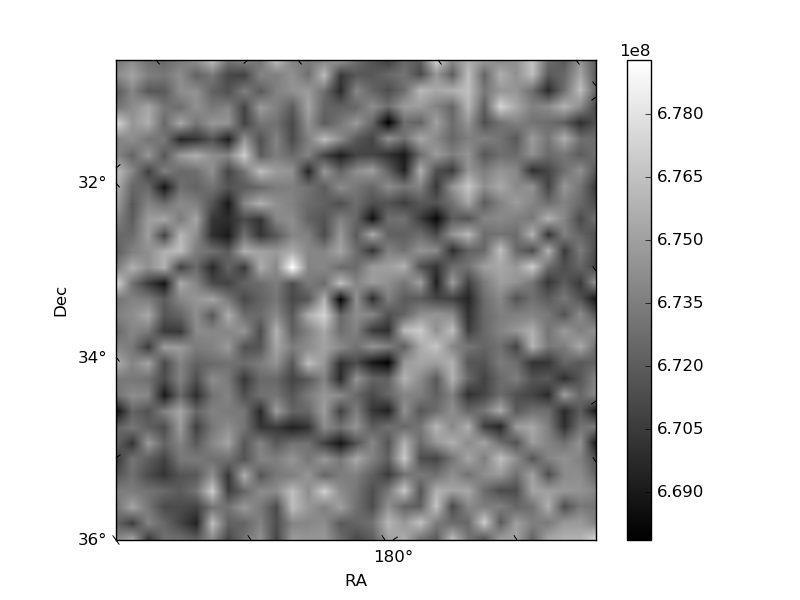
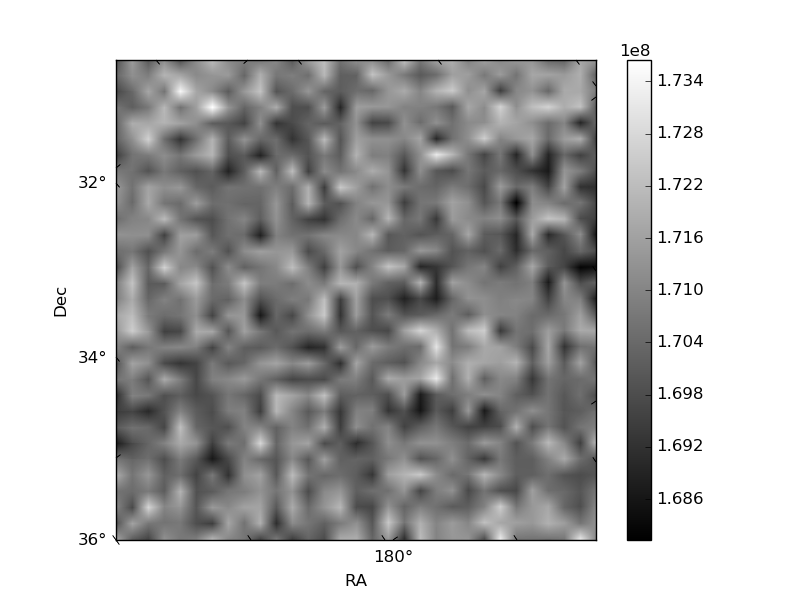
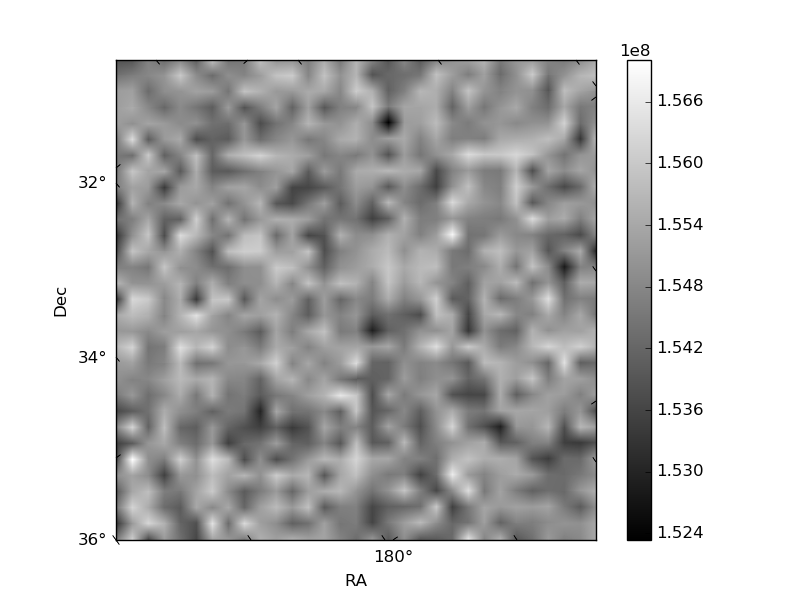
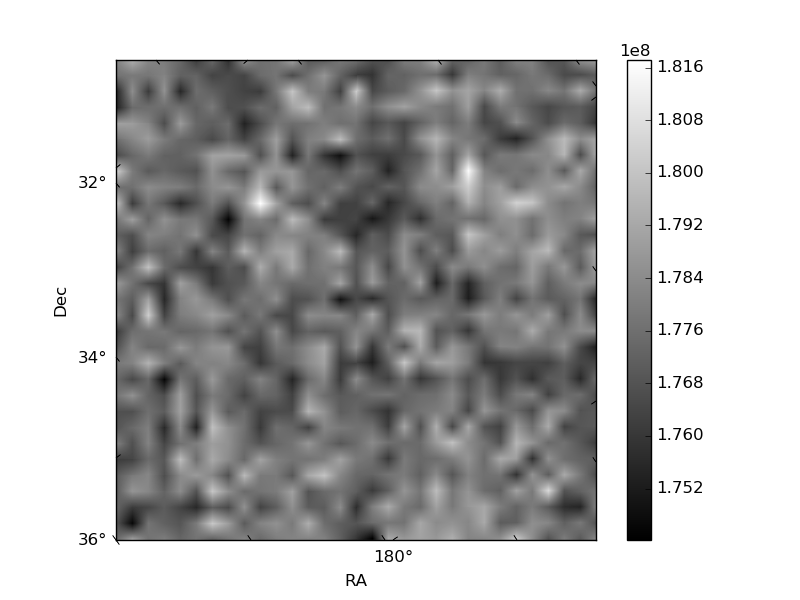
Histogram calculated using DETX and DETY for each event in the final _common_clean file
| Quadrant A | 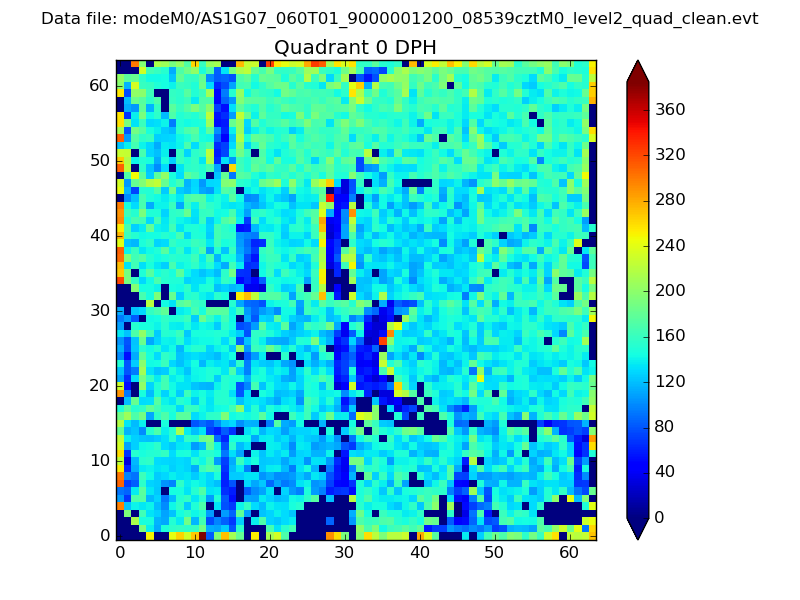 |
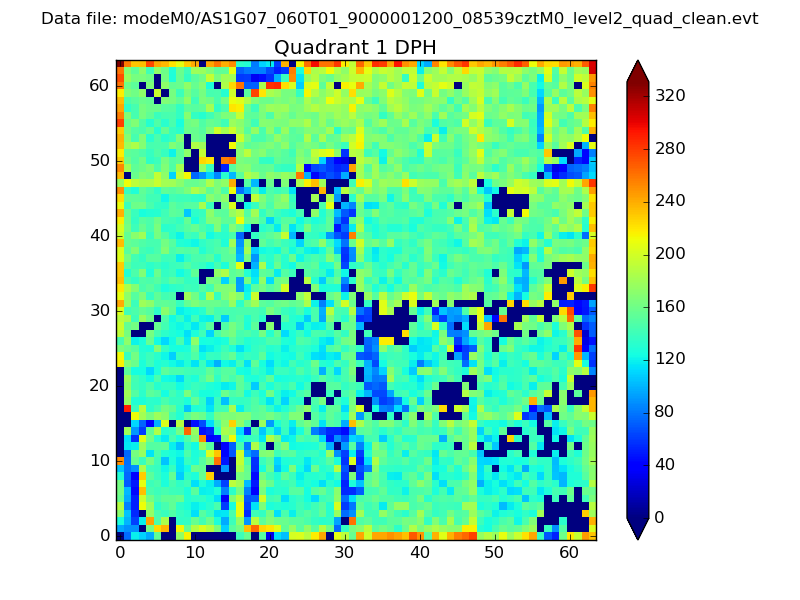 |
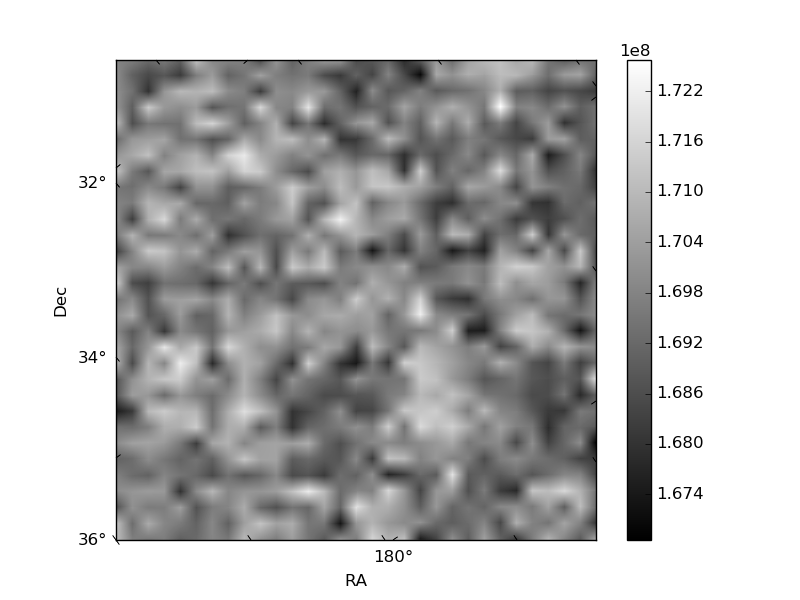
Quadrant B |
|---|---|---|---|
| Quadrant D | 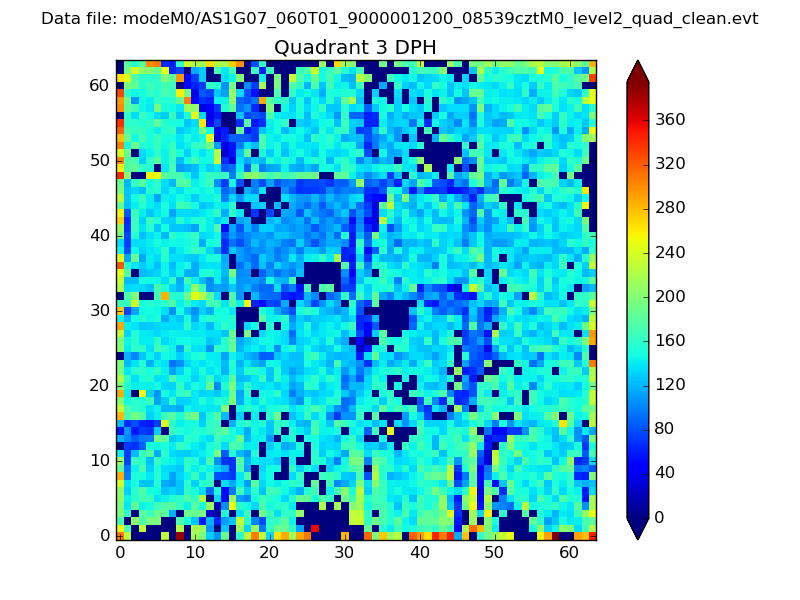 |
 |
Quadrant C |
| Plot type | Count rate plots | Images |
|---|---|---|
| Comparison with Poisson distribution Blue bars denote a histogram of data divided into 1 sec bins. Red curve is a Poisson curve with rate = median count rate of data. |
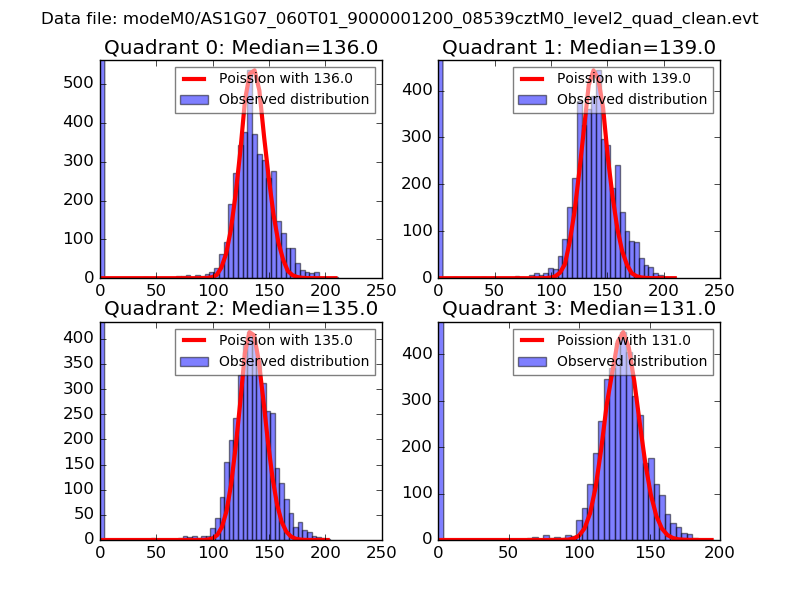 |
 |
| Quadrant-wise count rates Data is divided into 100 sec bins |
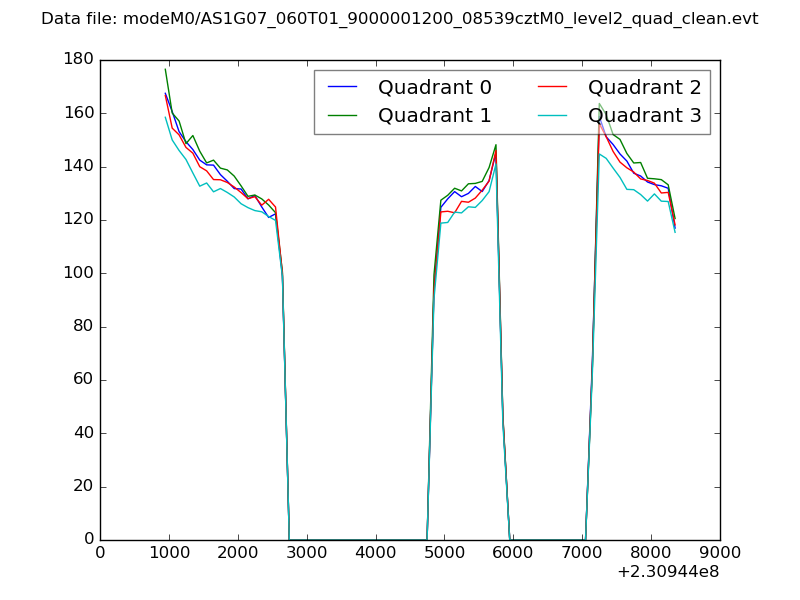 |
|
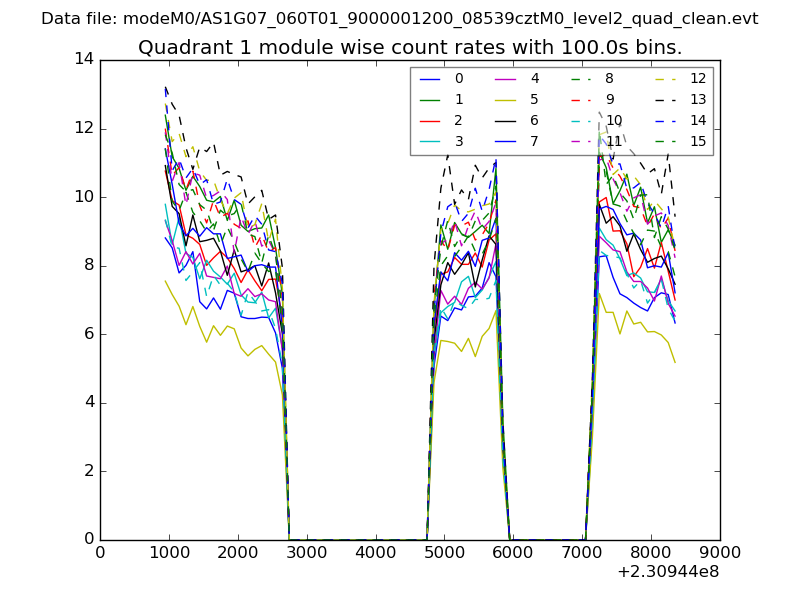
| Module-wise count rates for Quadrant A Data is divided into 100 sec bins |
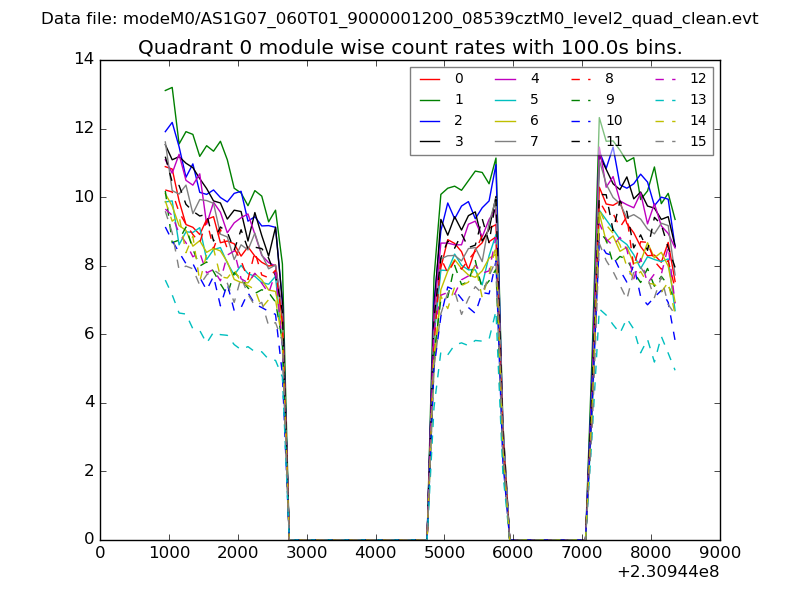 |
 |
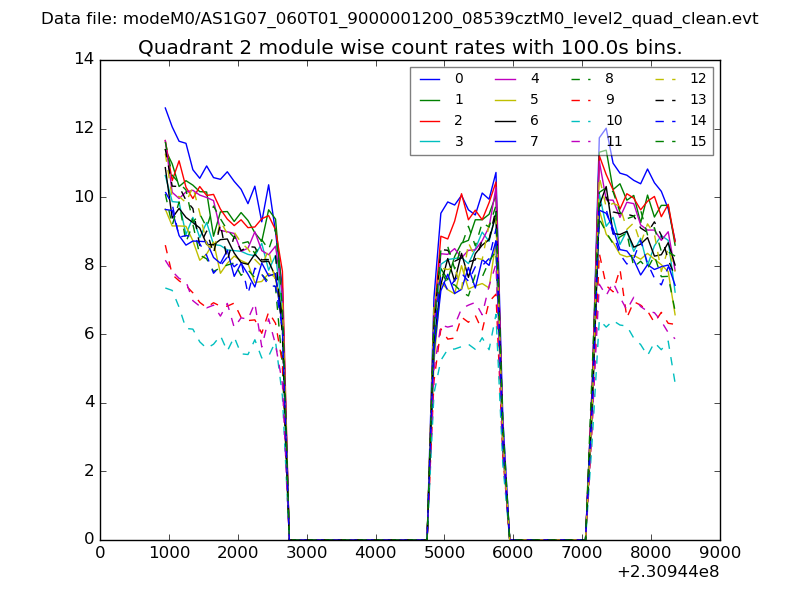
| Module-wise count rates for Quadrant B Data is divided into 100 sec bins |
 |
 |
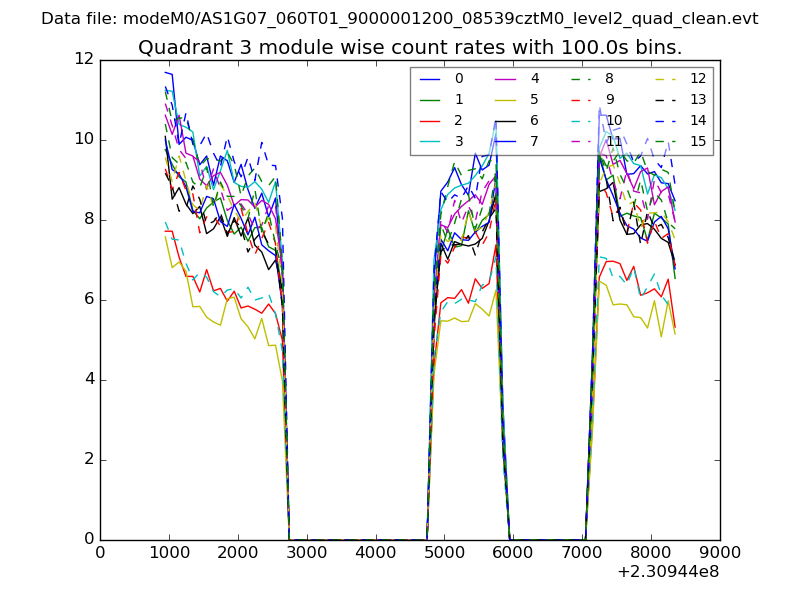
| Module-wise count rates for Quadrant C Data is divided into 100 sec bins |
 |
 |
| Module-wise count rates for Quadrant D Data is divided into 100 sec bins |
 |
 |
| Parameter | Plot |
|---|---|
| CZT HV Monitor | 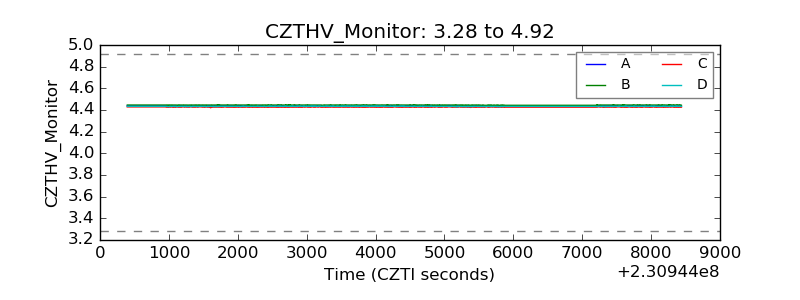 |
| D_VDD | 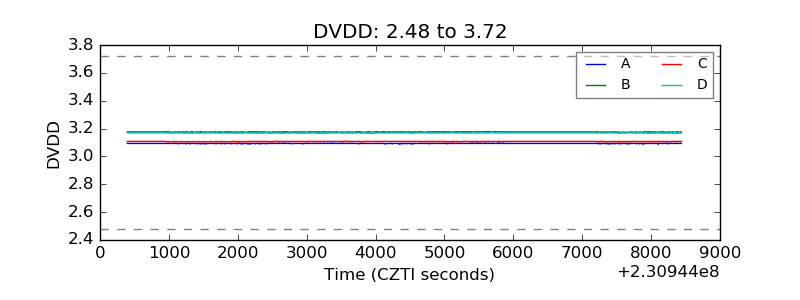 |
| Temperature 1 | 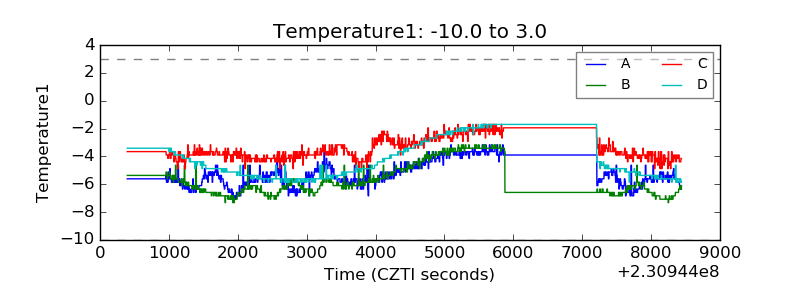 |
| Veto HV Monitor | 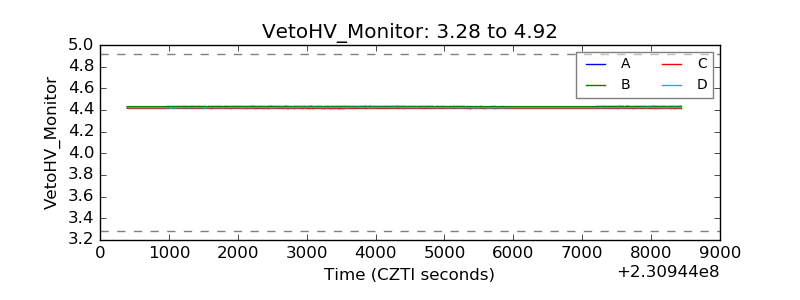 |
| Veto LLD | 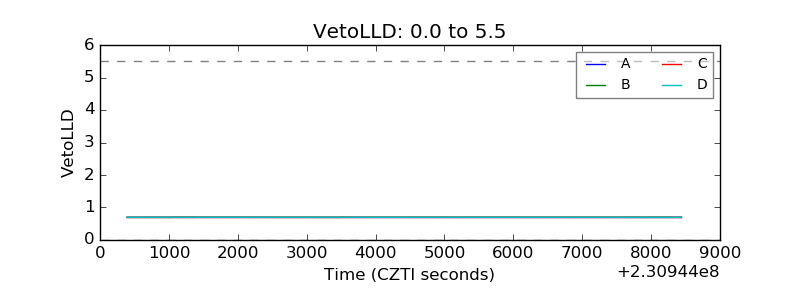 |
| Alpha Counter | 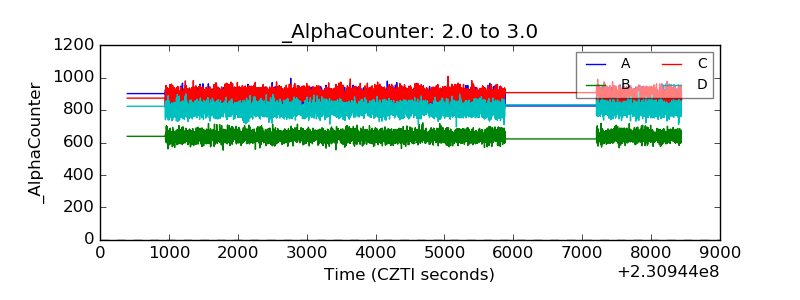 |
| _CPM_Rate | 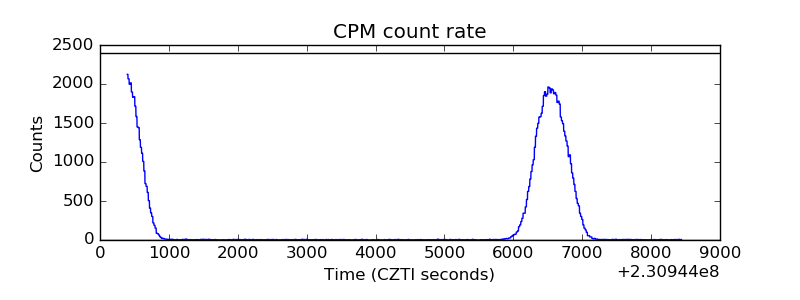 |
| CZT Counter | 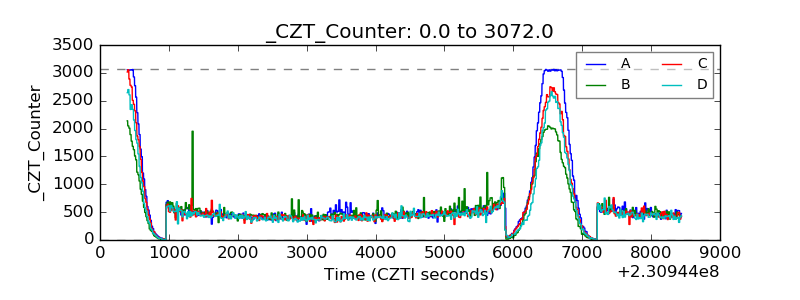 |
| +2.5 Volts monitor | 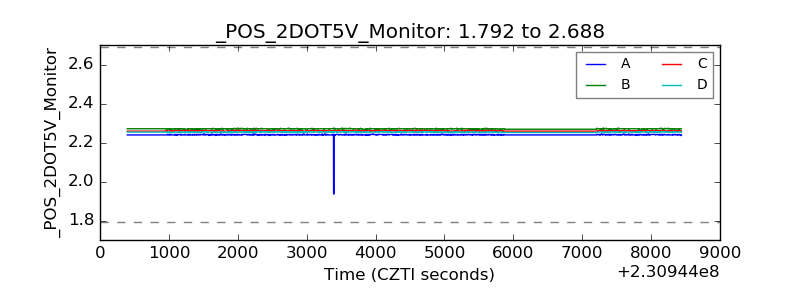 |
| +5 Volts monitor |  |
| _ROLL_ROT | 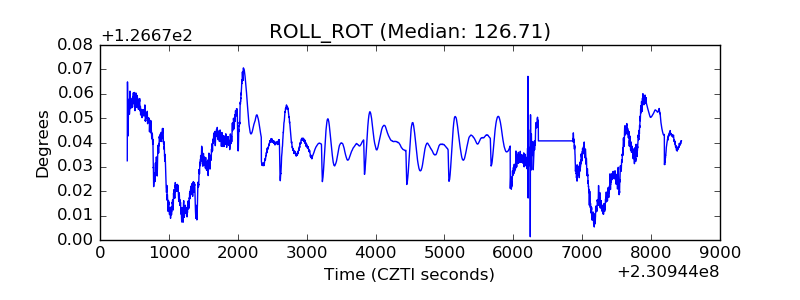 |
| _Roll_DEC | 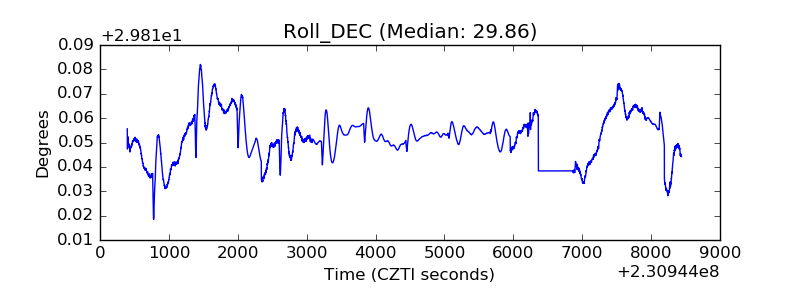 |
| _Roll_RA | 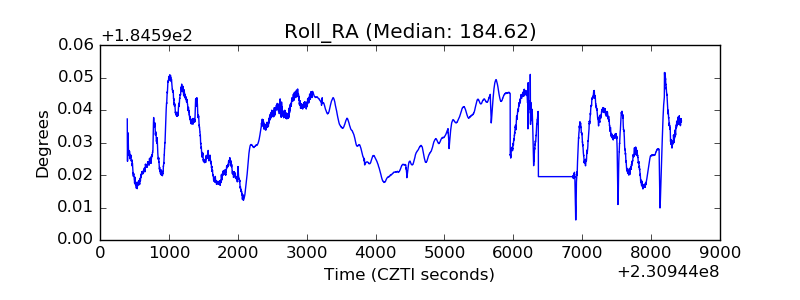 |
| Veto Counter | 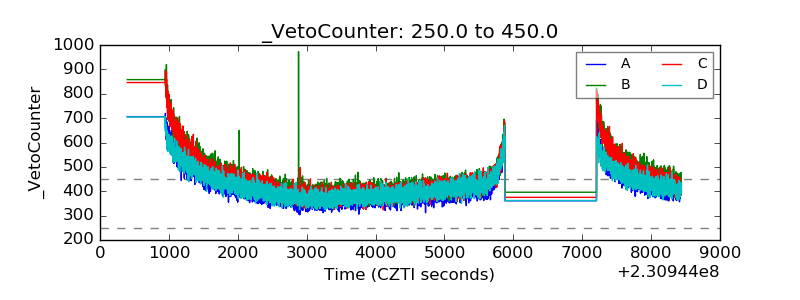 |