| Param | Original file | Final file |
|---|---|---|
| Filename | modeM0/AS1G07_060T01_9000001200_08540cztM0_level2.evt | modeM0/AS1G07_060T01_9000001200_08540cztM0_level2_quad_clean.evt |
| Size (bytes) | 401,284,800 | 80,432,640 |
| Size | 382.7 MB | 76.7 MB |
| Events in quadrant A | 3,040,423 | 507,060 |
| Events in quadrant B | 3,142,549 | 515,719 |
| Events in quadrant C | 2,783,349 | 501,533 |
| Events in quadrant D | 2,769,269 | 483,157 |
| Mode SS | |||
|---|---|---|---|
| Quadrant | BADHDUFLAG | Total packets | Discarded packets |
| A | 0 | 124 | 2 |
| B | 0 | 124 | 2 |
| C | 0 | 124 | 0 |
| D | 0 | 124 | 0 |
| Mode M0 | |||
|---|---|---|---|
| Quadrant | BADHDUFLAG | Total packets | Discarded packets |
| A | 0 | 13151 | 101 |
| B | 0 | 13382 | 95 |
| C | 0 | 12617 | 89 |
| D | 0 | 12786 | 110 |
| Mode M9 | |||
|---|---|---|---|
| Quadrant | BADHDUFLAG | Total packets | Discarded packets |
| A | 0 | 16 | 0 |
| B | 0 | 16 | 0 |
| C | 0 | 17 | 0 |
| D | 0 | 17 | 0 |
| Quadrant | Total seconds | Saturated seconds | Saturation percentage |
|---|---|---|---|
| A | 6139 | 27 | 0.439811% |
| B | 6139 | 66 | 1.075094% |
| C | 6139 | 7 | 0.114025% |
| D | 6134 | 13 | 0.211933% |
Noise dominated data is calculated using 1-second bins in cleaned event files. If a bin has >2000 counts, and if more than 50% of those come from <1% of pixels, then it is considered to be noise-dominated and hence unusable.
| Quadrant | # 1 sec bins | Bins with >0 counts | Bins with >2000 counts | High rate bins dominated by noise | Noise dominated (total time) | Noise dominated (detector-on time) | Marked lightcurve |
|---|---|---|---|---|---|---|---|
| A | 7483 | 6182 | 9 | 9 | 0.12% | 0.15% | 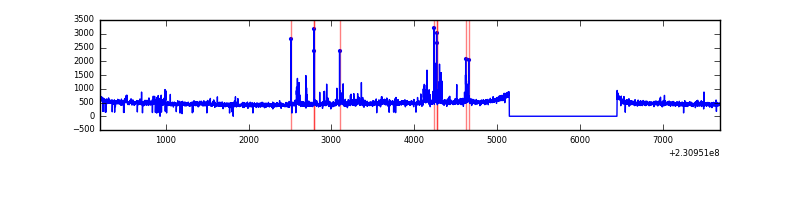 |
| B | 7483 | 6184 | 30 | 30 | 0.40% | 0.49% |  |
| C | 7483 | 6182 | 0 | 0 | 0.00% | 0.00% | 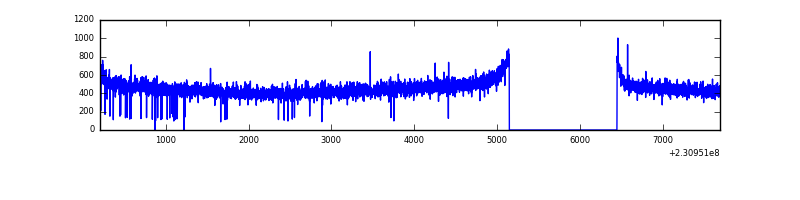 |
| D | 7483 | 6181 | 6 | 6 | 0.08% | 0.10% | 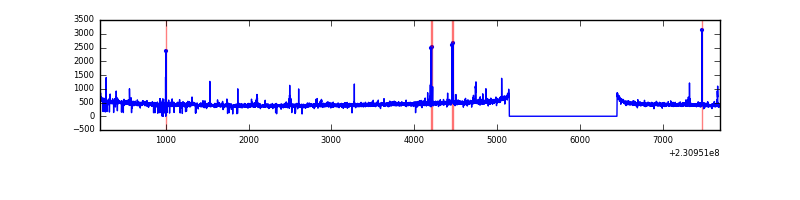 |
Top three noisy pixels from each quadrant. If the there are fewer than three noisy pixels in the level2.evt file, extra rows are filled as -1
| Pixel properties | Quadrant properties | ||||||
|---|---|---|---|---|---|---|---|
| Quadrant | DetID | PixID | Counts | Sigma | Mean | Median | Sigma |
| A | 15 | 223 | 113127 | 752.96 | 734 | 720 | 149.3 |
| A | 13 | 251 | 54290 | 358.84 | 734 | 720 | 149.3 |
| A | 15 | 239 | 44350 | 292.25 | 734 | 720 | 149.3 |
| B | 10 | 16 | 138484 | 982.73 | 740 | 722 | 140.2 |
| B | 0 | 214 | 62749 | 442.47 | 740 | 722 | 140.2 |
| B | 4 | 81 | 24599 | 170.33 | 740 | 722 | 140.2 |
| C | 13 | 61 | 5486 | 28.93 | 713 | 717 | 164.9 |
| C | 8 | 222 | 3871 | 19.13 | 713 | 717 | 164.9 |
| C | 3 | 202 | 1723 | 6.1 | 713 | 717 | 164.9 |
| D | 2 | 234 | 19192 | 107.03 | 701 | 683 | 172.9 |
| D | 13 | 137 | 18817 | 104.86 | 701 | 683 | 172.9 |
| D | 14 | 34 | 17592 | 97.77 | 701 | 683 | 172.9 |
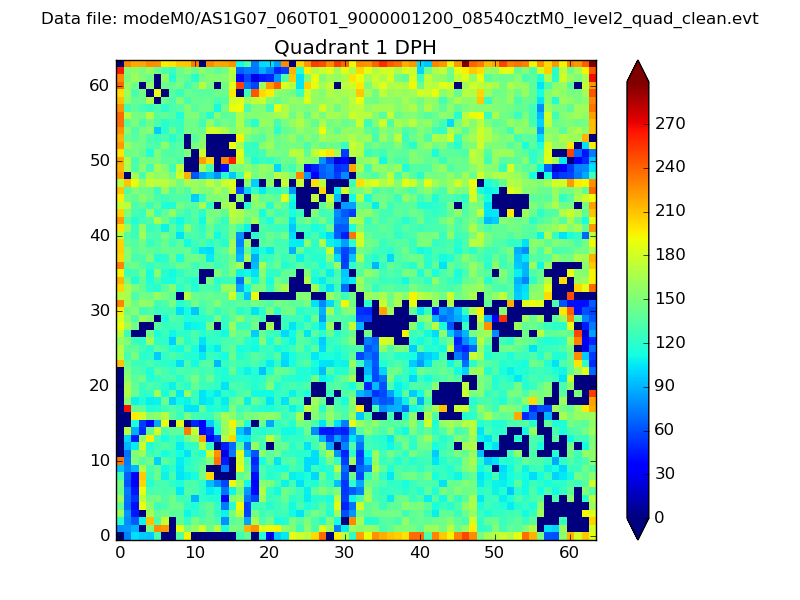
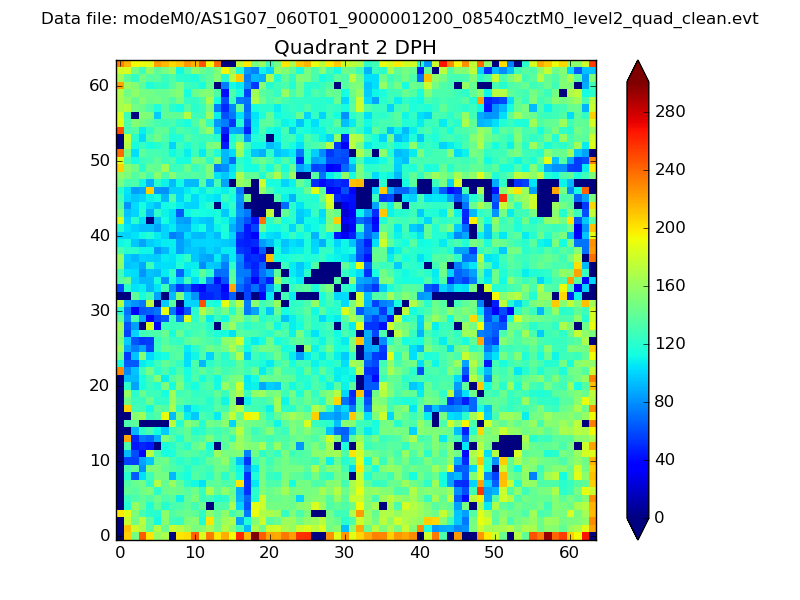
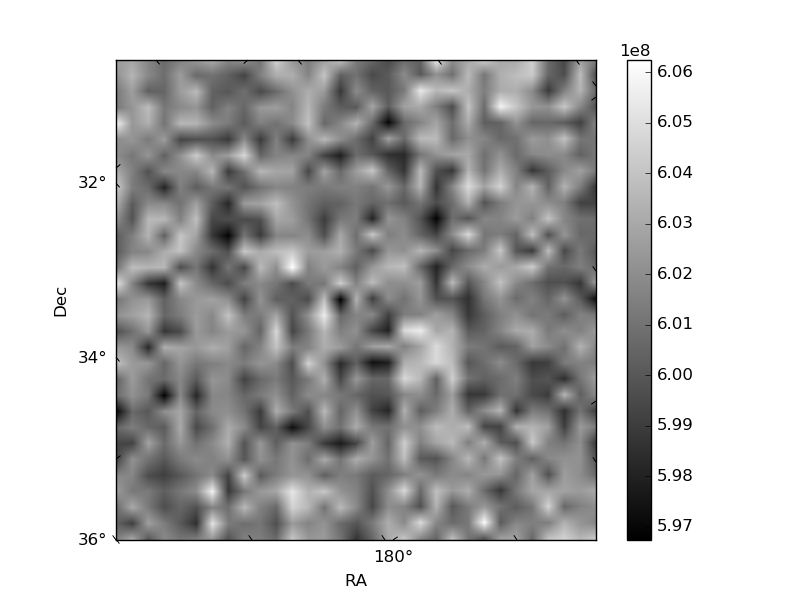
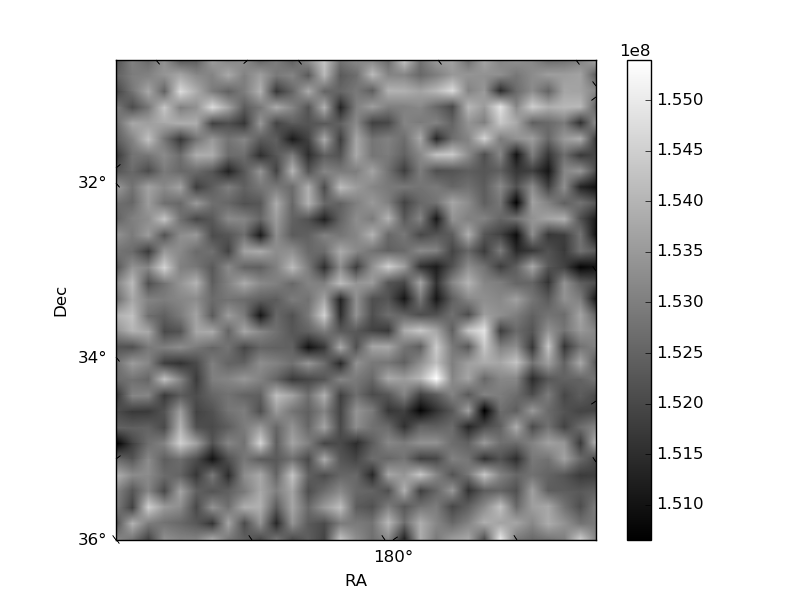
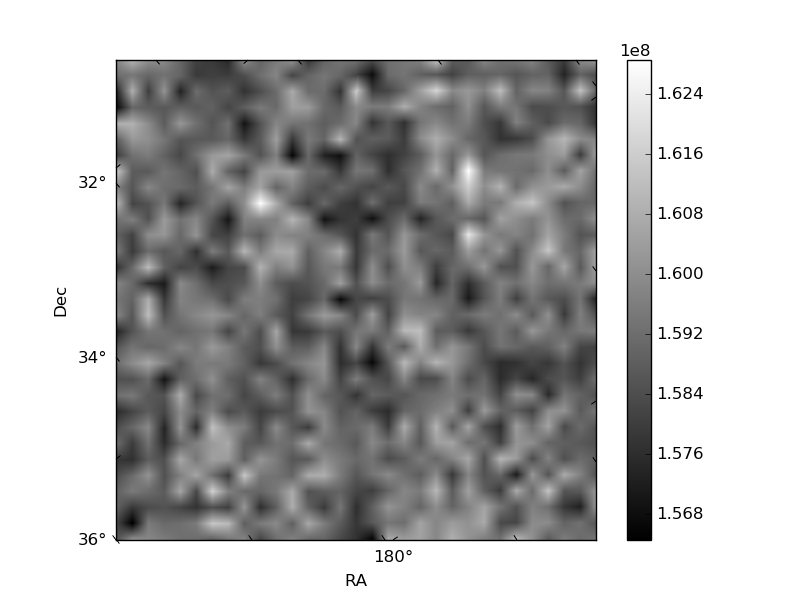
Histogram calculated using DETX and DETY for each event in the final _common_clean file
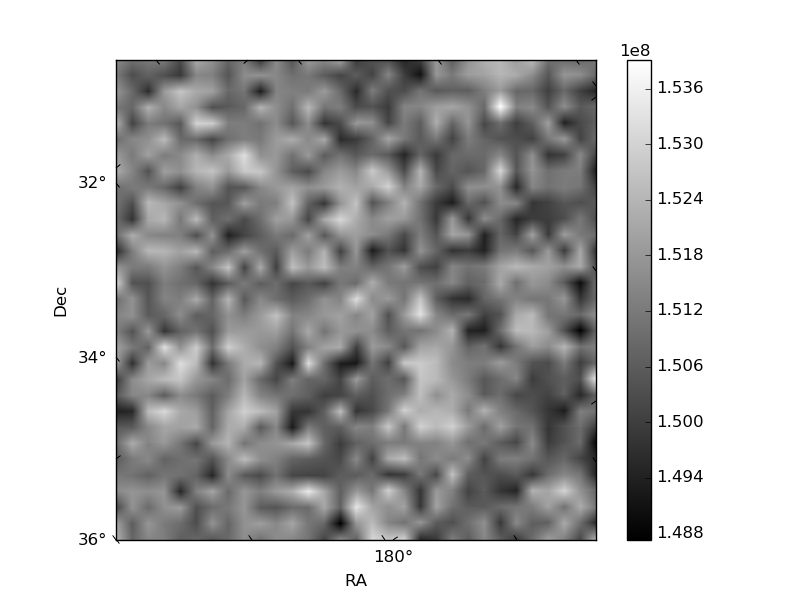
| Quadrant A | 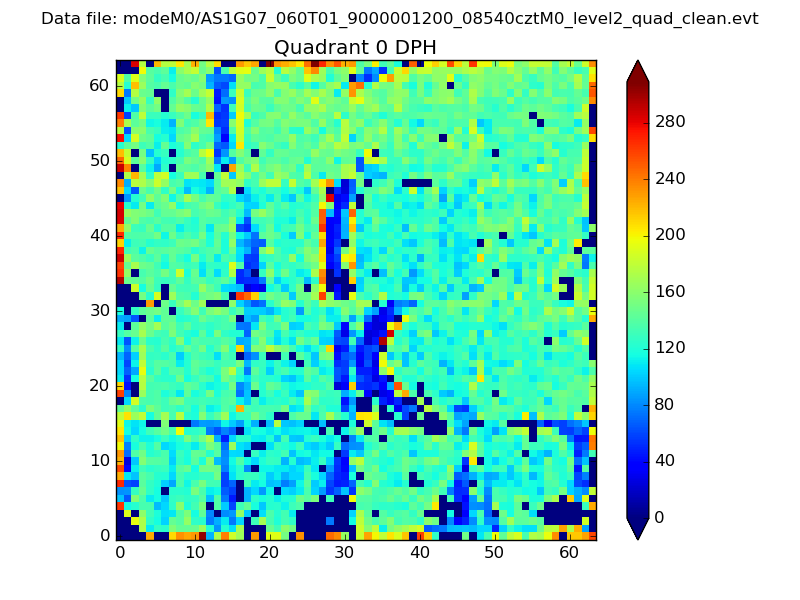 |
 |
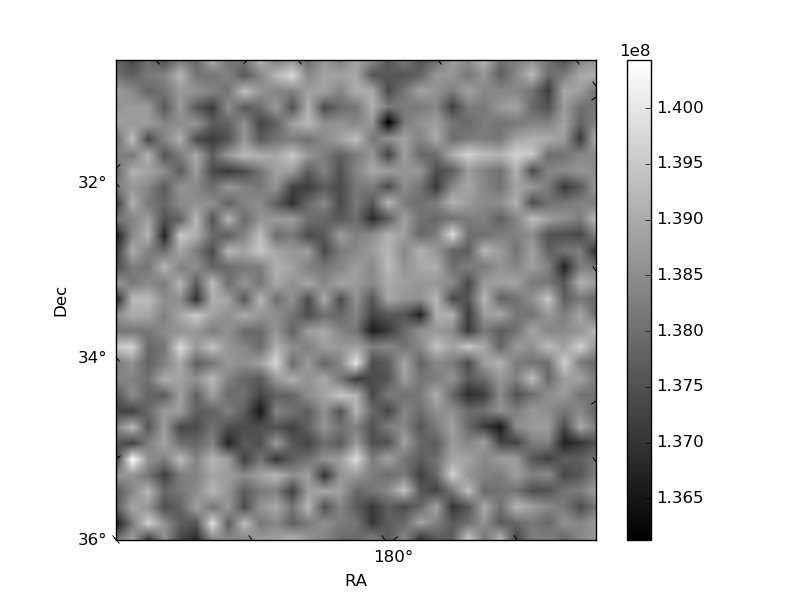
Quadrant B |
|---|---|---|---|
| Quadrant D | 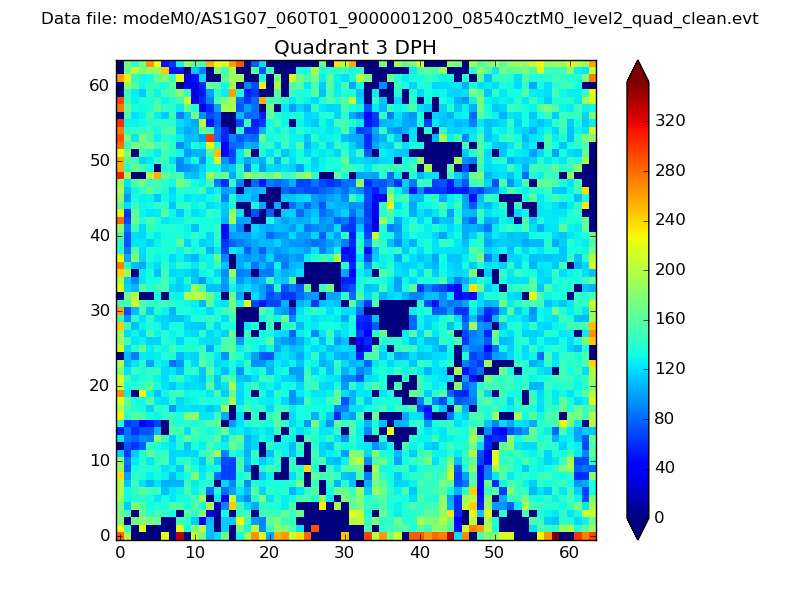 |
 |
Quadrant C |
| Plot type | Count rate plots | Images |
|---|---|---|
| Comparison with Poisson distribution Blue bars denote a histogram of data divided into 1 sec bins. Red curve is a Poisson curve with rate = median count rate of data. |
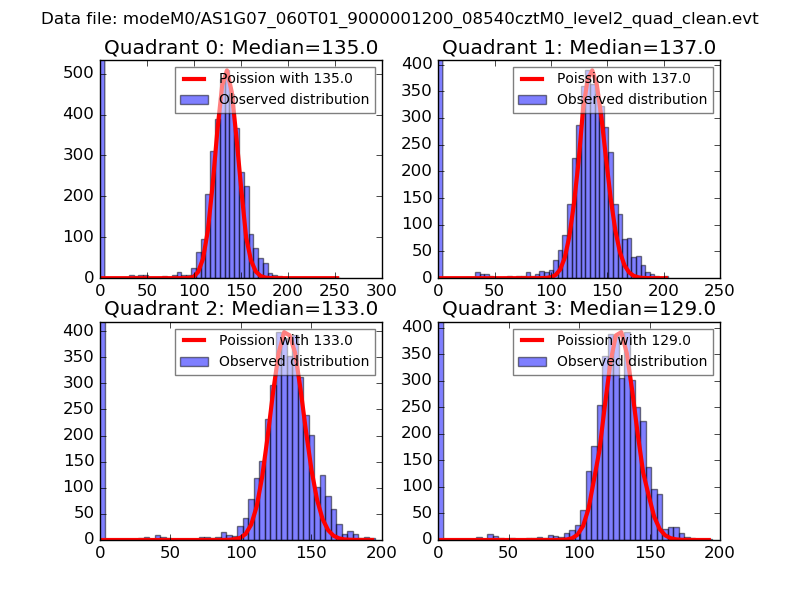 |
 |
| Quadrant-wise count rates Data is divided into 100 sec bins |
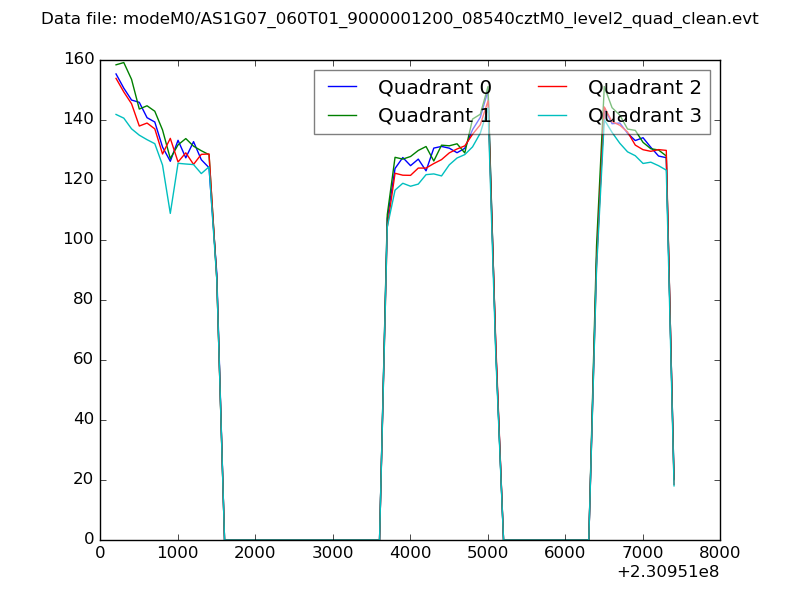 |
|
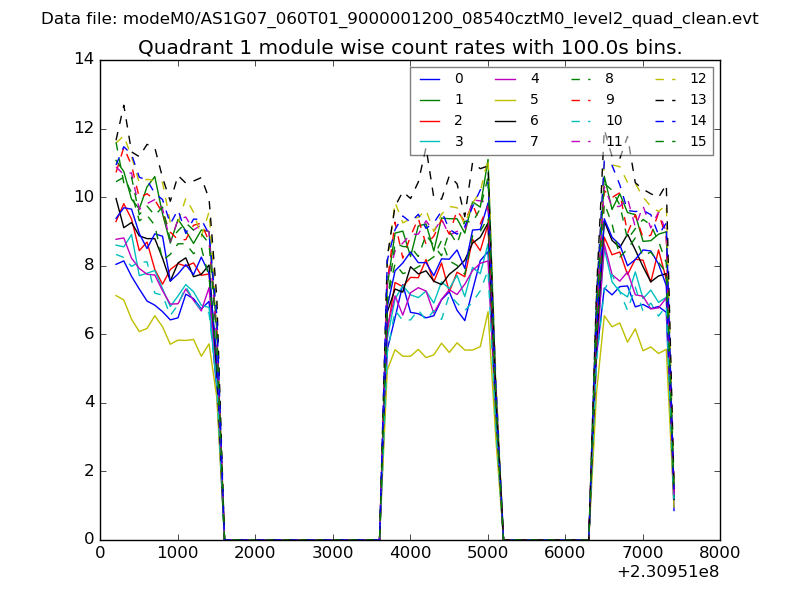
| Module-wise count rates for Quadrant A Data is divided into 100 sec bins |
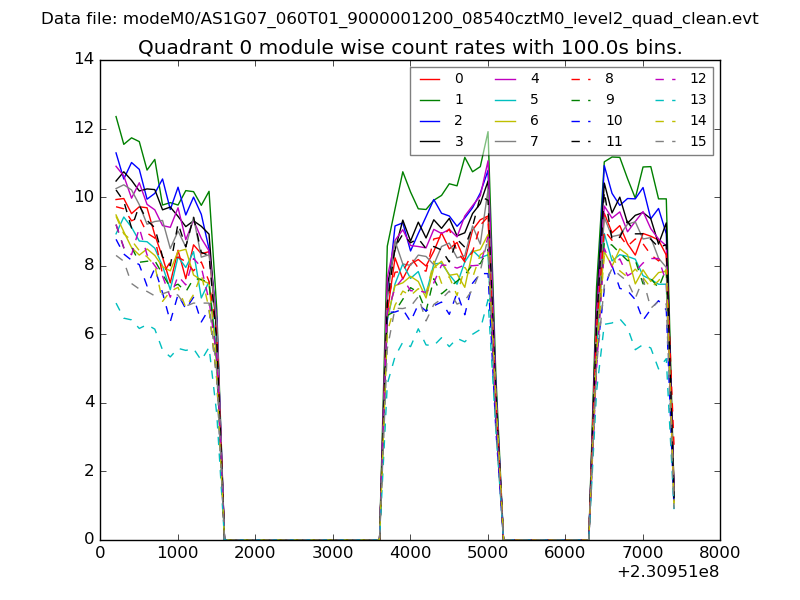 |
 |
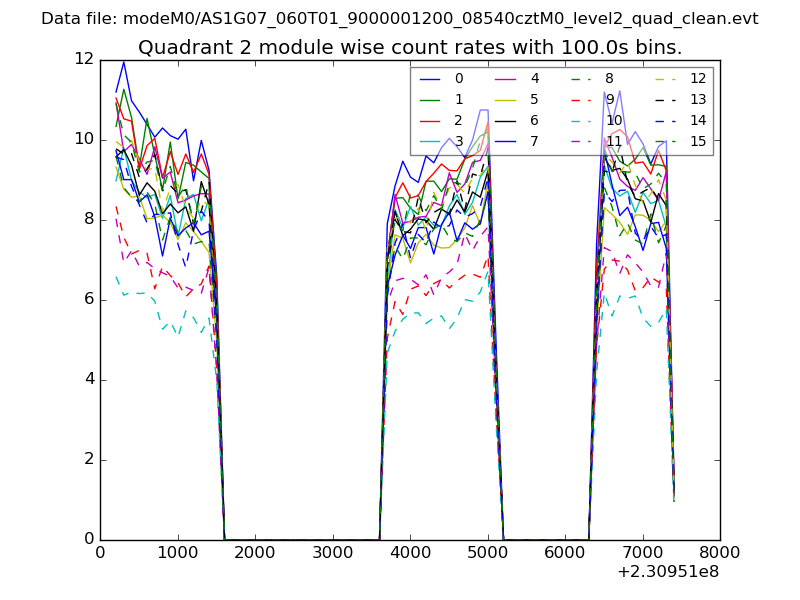
| Module-wise count rates for Quadrant B Data is divided into 100 sec bins |
 |
 |
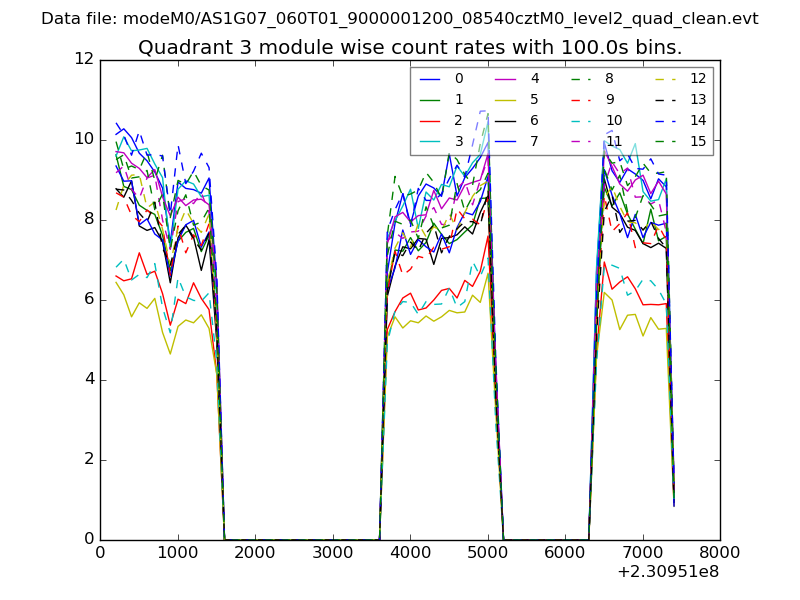
| Module-wise count rates for Quadrant C Data is divided into 100 sec bins |
 |
 |
| Module-wise count rates for Quadrant D Data is divided into 100 sec bins |
 |
 |
| Parameter | Plot |
|---|---|
| CZT HV Monitor | 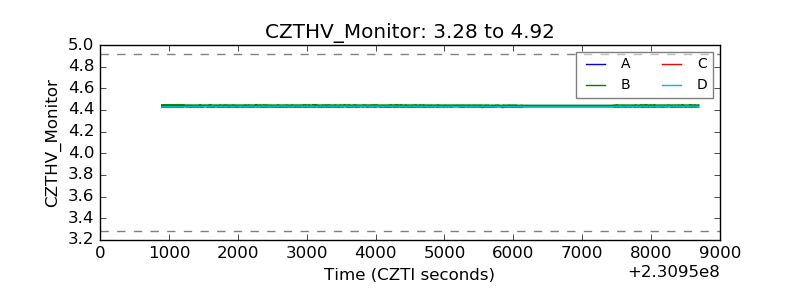 |
| D_VDD | 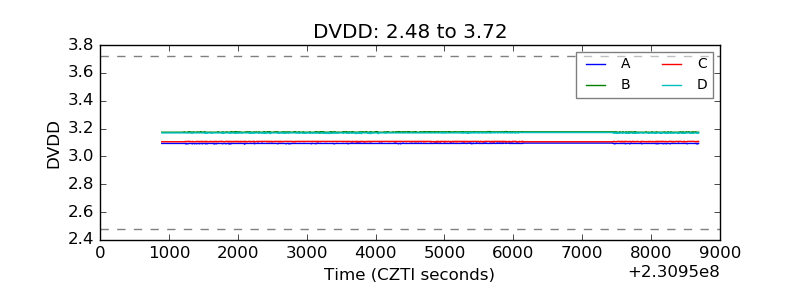 |
| Temperature 1 | 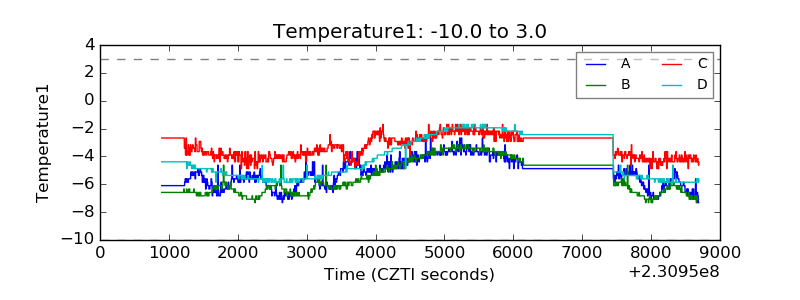 |
| Veto HV Monitor | 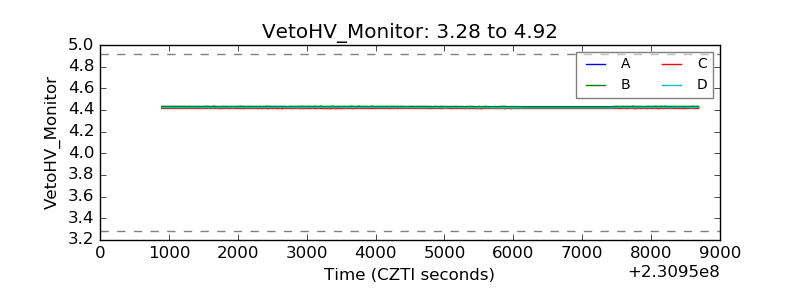 |
| Veto LLD | 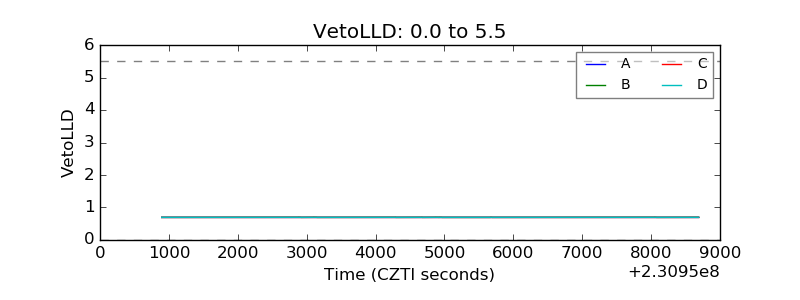 |
| Alpha Counter | 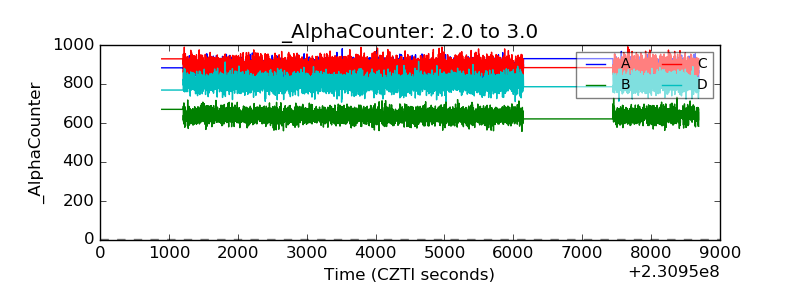 |
| _CPM_Rate | 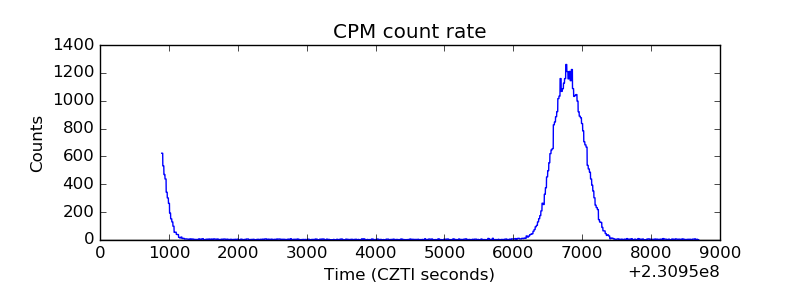 |
| CZT Counter | 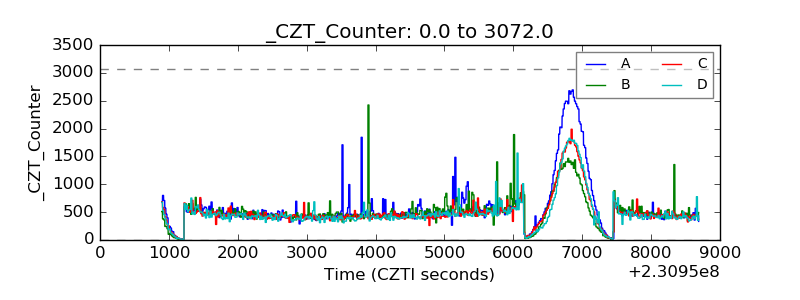 |
| +2.5 Volts monitor | 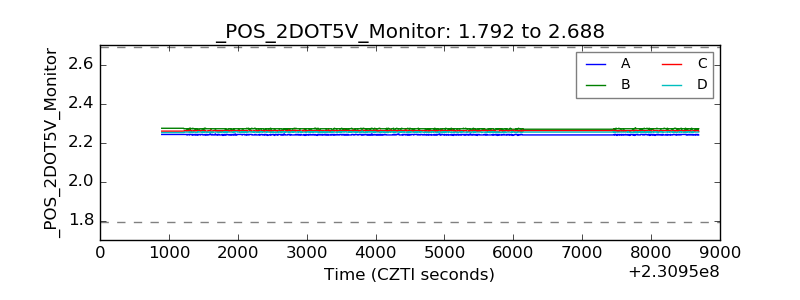 |
| +5 Volts monitor |  |
| _ROLL_ROT | 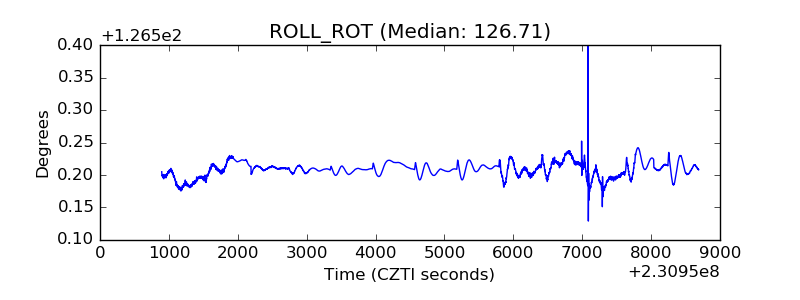 |
| _Roll_DEC | 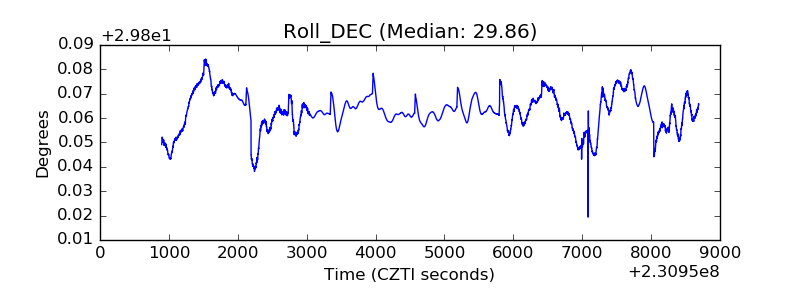 |
| _Roll_RA | 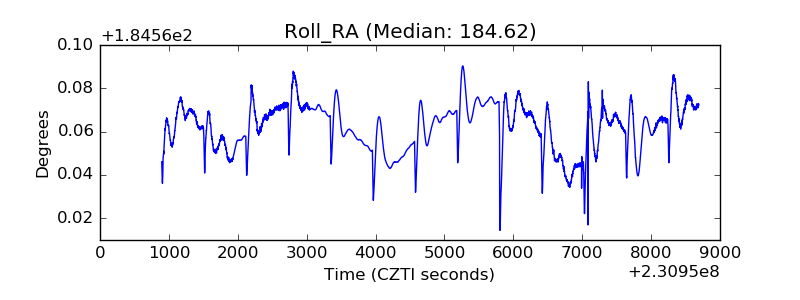 |
| Veto Counter | 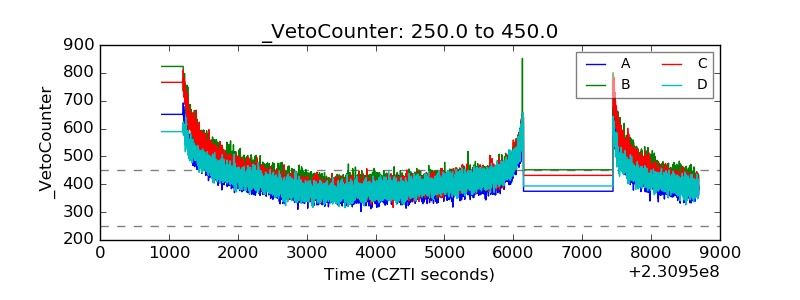 |