| Param | Original file | Final file |
|---|---|---|
| Filename | modeM0/AS1G07_060T01_9000001200_08541cztM0_level2.evt | modeM0/AS1G07_060T01_9000001200_08541cztM0_level2_quad_clean.evt |
| Size (bytes) | 412,701,120 | 74,793,600 |
| Size | 393.6 MB | 71.3 MB |
| Events in quadrant A | 3,175,943 | 458,492 |
| Events in quadrant B | 3,130,313 | 465,748 |
| Events in quadrant C | 2,869,845 | 455,718 |
| Events in quadrant D | 2,887,623 | 438,925 |
| Mode SS | |||
|---|---|---|---|
| Quadrant | BADHDUFLAG | Total packets | Discarded packets |
| A | 0 | 130 | 0 |
| B | 0 | 130 | 0 |
| C | 0 | 130 | 0 |
| D | 0 | 130 | 0 |
| Mode M0 | |||
|---|---|---|---|
| Quadrant | BADHDUFLAG | Total packets | Discarded packets |
| A | 0 | 13805 | 3 |
| B | 0 | 13466 | 2 |
| C | 0 | 13046 | 2 |
| D | 0 | 13307 | 2 |
| Mode M9 | |||
|---|---|---|---|
| Quadrant | BADHDUFLAG | Total packets | Discarded packets |
| A | 0 | 14 | 0 |
| B | 0 | 14 | 0 |
| C | 0 | 14 | 0 |
| D | 0 | 15 | 0 |
| Quadrant | Total seconds | Saturated seconds | Saturation percentage |
|---|---|---|---|
| A | 6390 | 69 | 1.079812% |
| B | 6390 | 63 | 0.985915% |
| C | 6390 | 12 | 0.187793% |
| D | 6390 | 15 | 0.234742% |
Noise dominated data is calculated using 1-second bins in cleaned event files. If a bin has >2000 counts, and if more than 50% of those come from <1% of pixels, then it is considered to be noise-dominated and hence unusable.
| Quadrant | # 1 sec bins | Bins with >0 counts | Bins with >2000 counts | High rate bins dominated by noise | Noise dominated (total time) | Noise dominated (detector-on time) | Marked lightcurve |
|---|---|---|---|---|---|---|---|
| A | 7565 | 6391 | 28 | 28 | 0.37% | 0.44% | 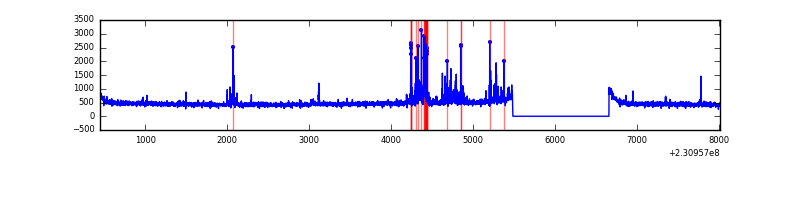 |
| B | 7565 | 6391 | 16 | 16 | 0.21% | 0.25% | 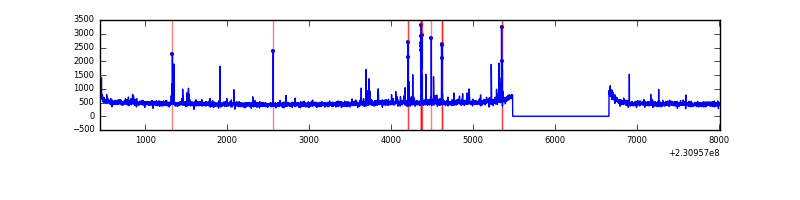 |
| C | 7565 | 6391 | 0 | 0 | 0.00% | 0.00% | 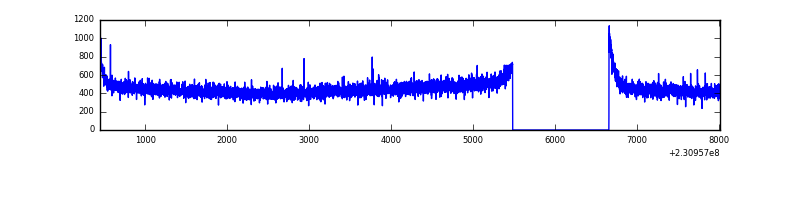 |
| D | 7565 | 6391 | 6 | 6 | 0.08% | 0.09% | 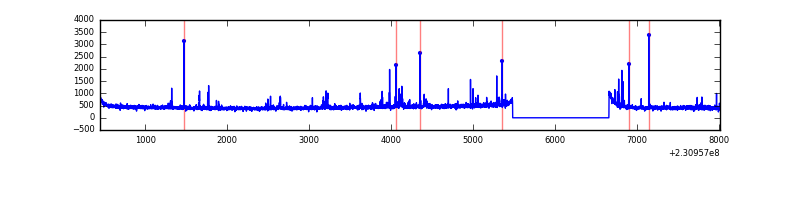 |
Top three noisy pixels from each quadrant. If the there are fewer than three noisy pixels in the level2.evt file, extra rows are filled as -1
| Pixel properties | Quadrant properties | ||||||
|---|---|---|---|---|---|---|---|
| Quadrant | DetID | PixID | Counts | Sigma | Mean | Median | Sigma |
| A | 15 | 223 | 173970 | 1132.27 | 755 | 740 | 153.0 |
| A | 15 | 239 | 72046 | 466.07 | 755 | 740 | 153.0 |
| A | 8 | 5 | 14457 | 89.66 | 755 | 740 | 153.0 |
| B | 10 | 16 | 77166 | 529.02 | 763 | 745 | 144.5 |
| B | 0 | 214 | 58571 | 400.3 | 763 | 745 | 144.5 |
| B | 12 | 111 | 16440 | 108.65 | 763 | 745 | 144.5 |
| C | 13 | 61 | 5662 | 28.84 | 734 | 739 | 170.7 |
| C | 8 | 222 | 4530 | 22.21 | 734 | 739 | 170.7 |
| C | 3 | 202 | 1816 | 6.31 | 734 | 739 | 170.7 |
| D | 14 | 34 | 80090 | 449.95 | 724 | 704 | 176.4 |
| D | 7 | 71 | 22255 | 122.15 | 724 | 704 | 176.4 |
| D | 2 | 234 | 20145 | 110.19 | 724 | 704 | 176.4 |
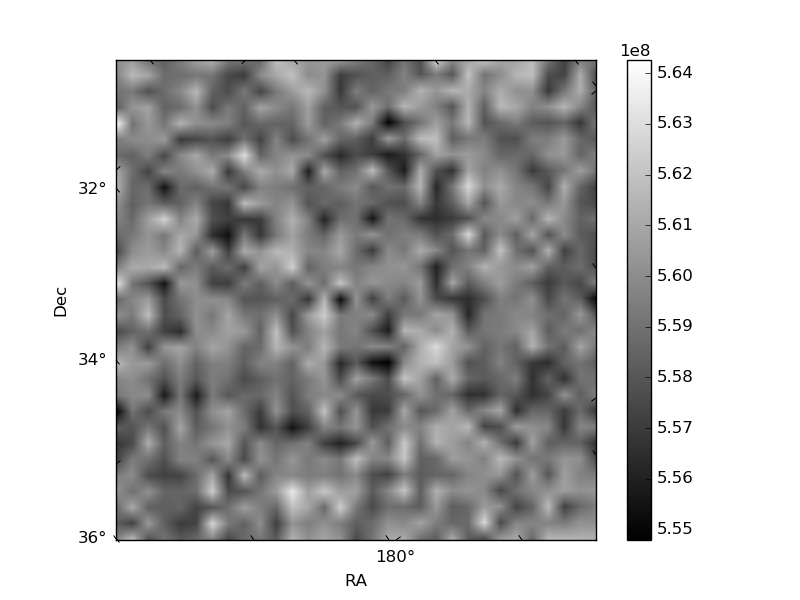
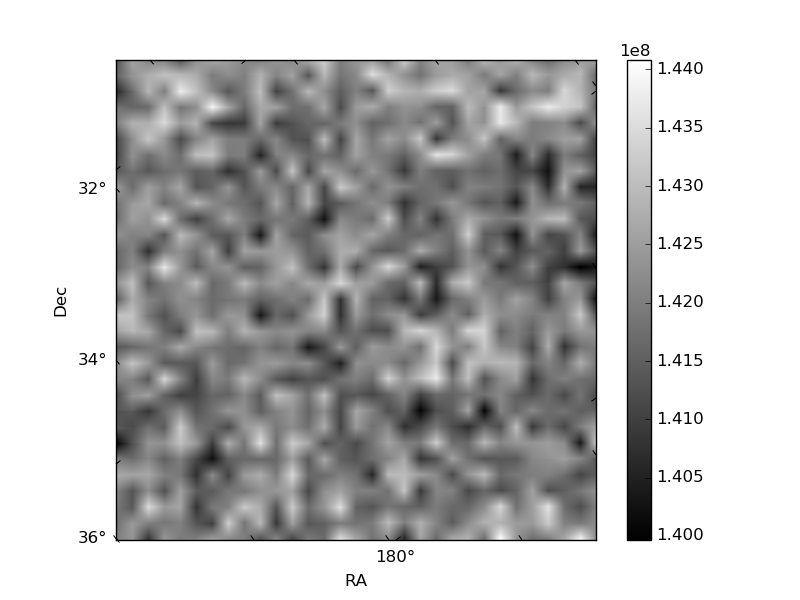
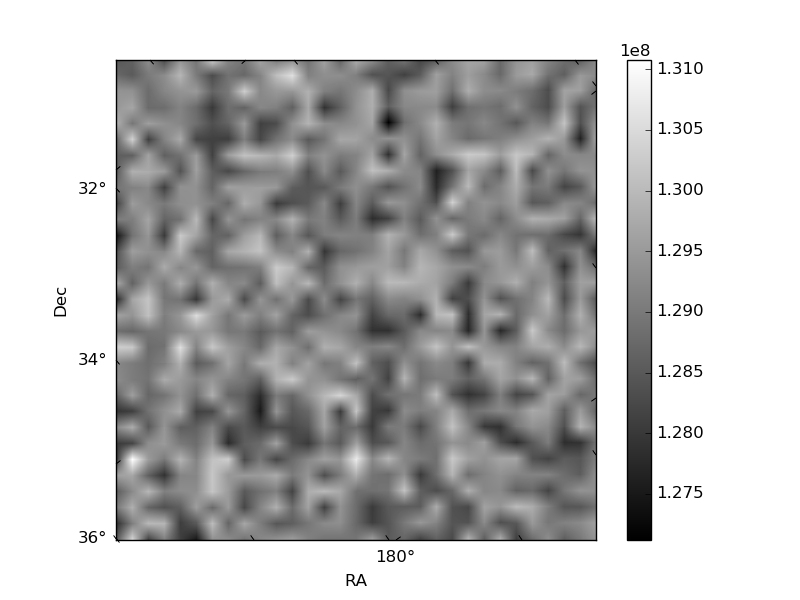
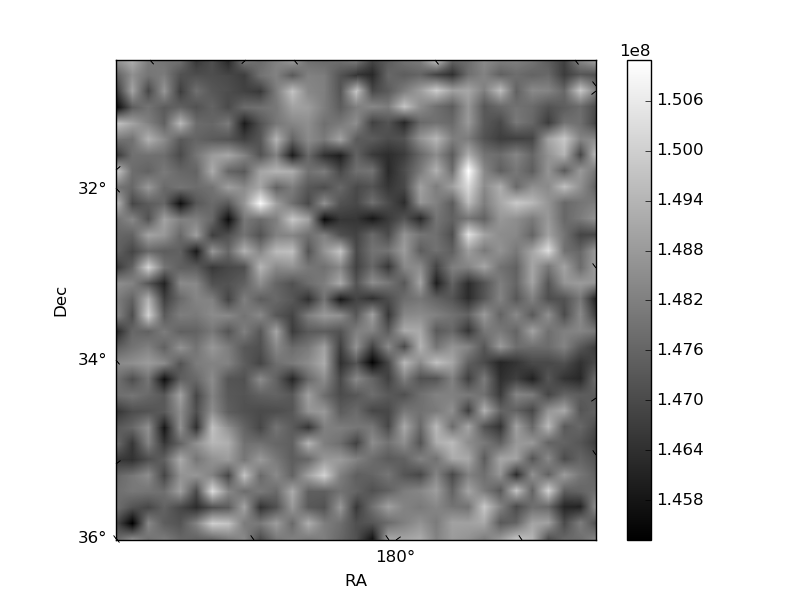
Histogram calculated using DETX and DETY for each event in the final _common_clean file
| Quadrant A | 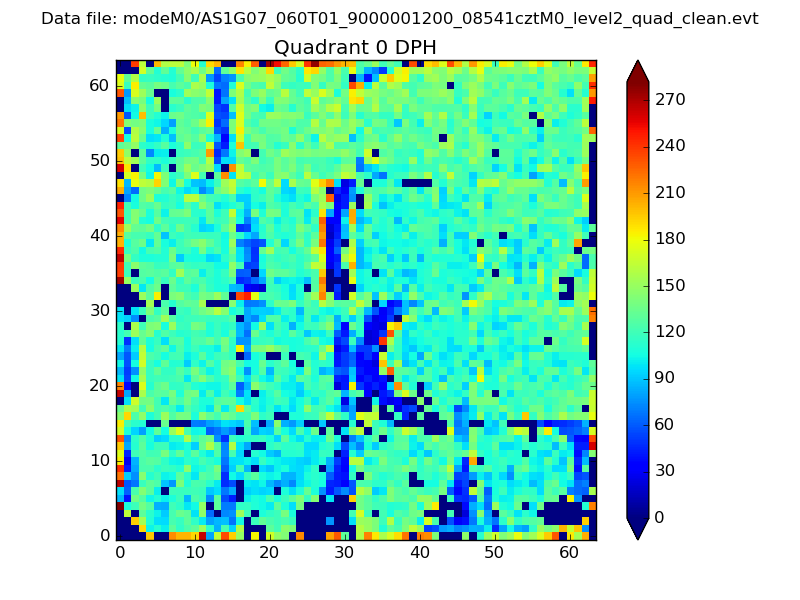 |
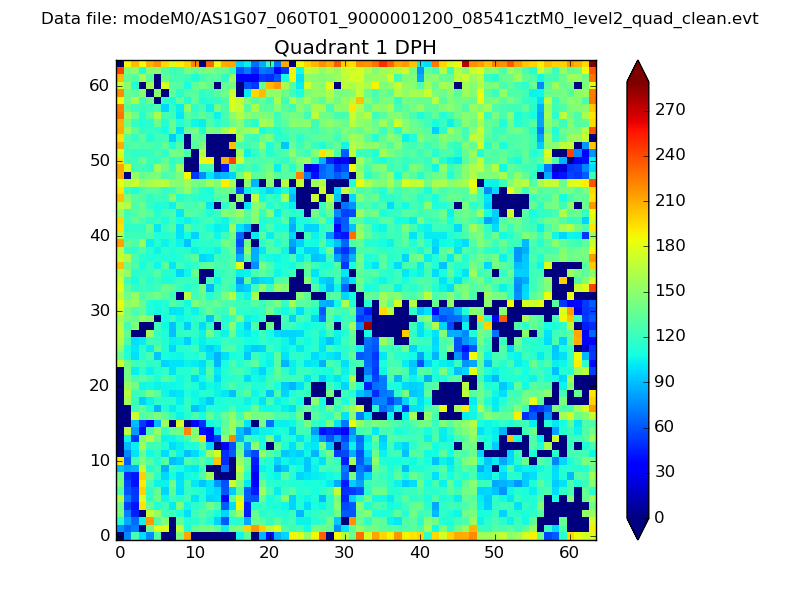 |
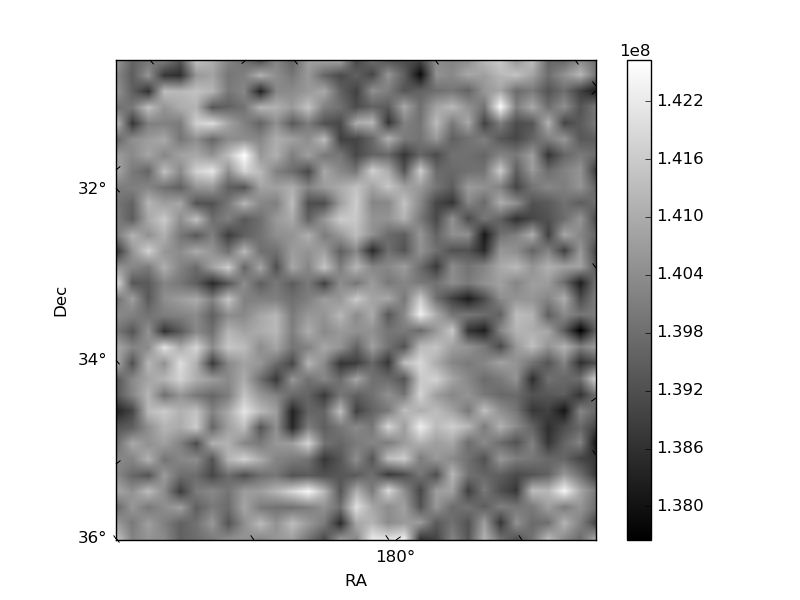
Quadrant B |
|---|---|---|---|
| Quadrant D | 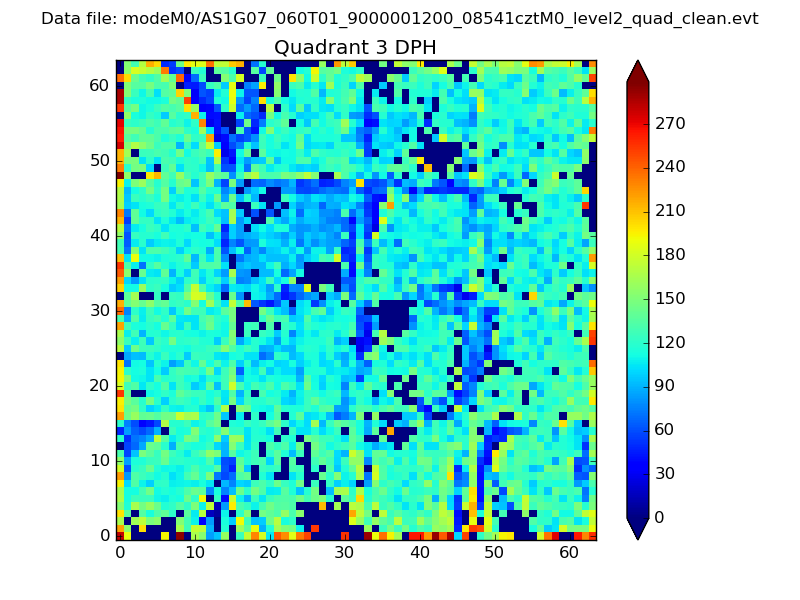 |
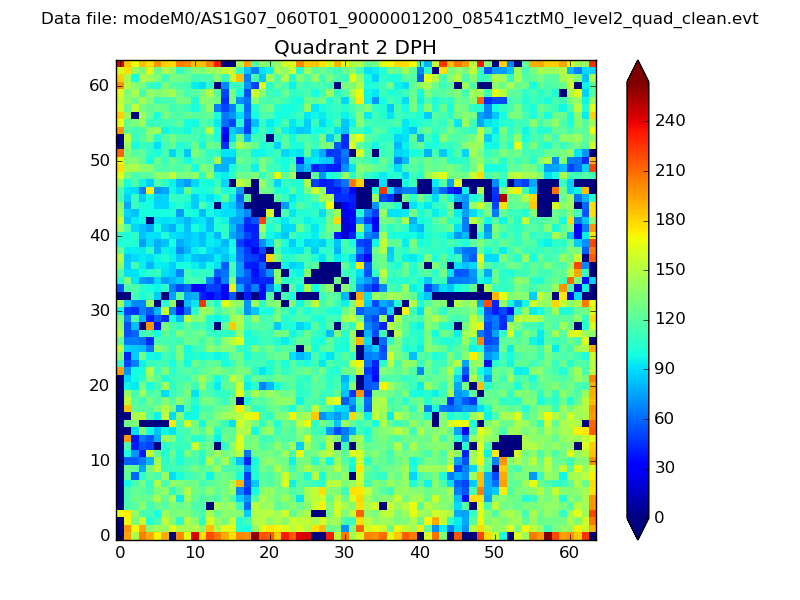 |
Quadrant C |
| Plot type | Count rate plots | Images |
|---|---|---|
| Comparison with Poisson distribution Blue bars denote a histogram of data divided into 1 sec bins. Red curve is a Poisson curve with rate = median count rate of data. |
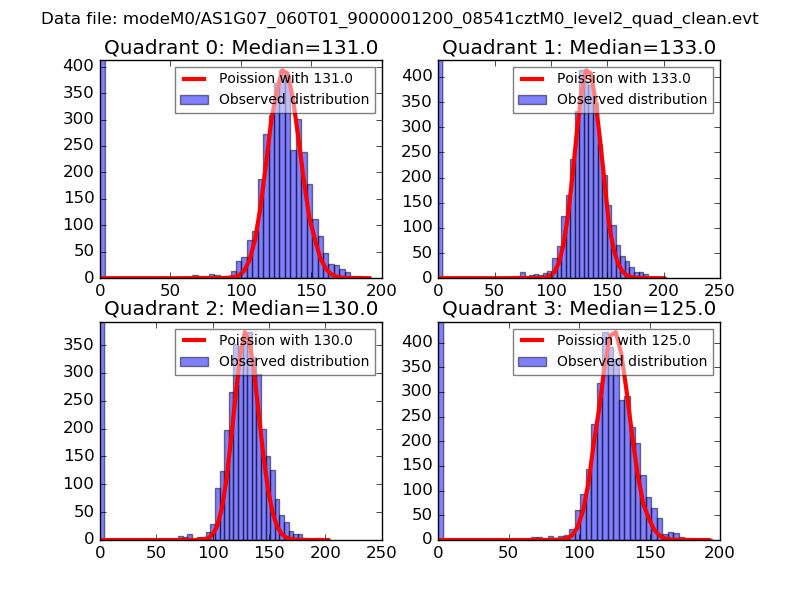 |
 |
| Quadrant-wise count rates Data is divided into 100 sec bins |
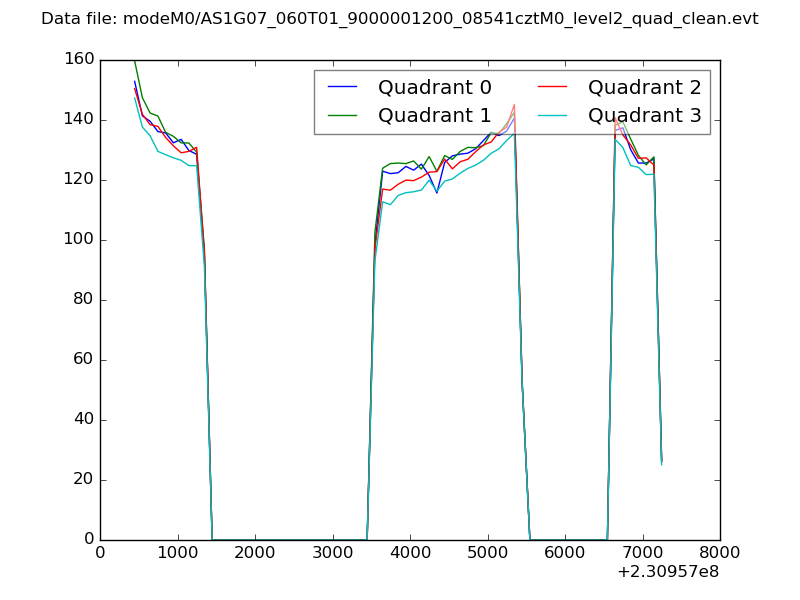 |
|
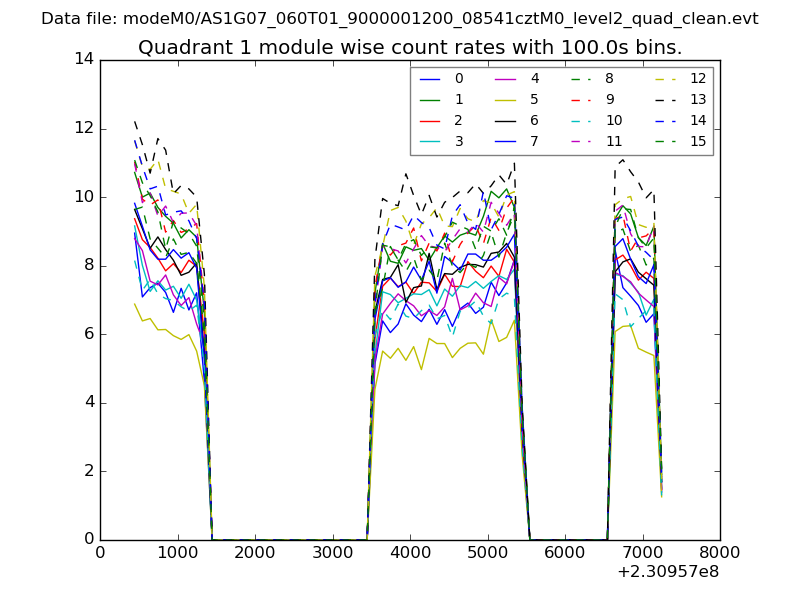
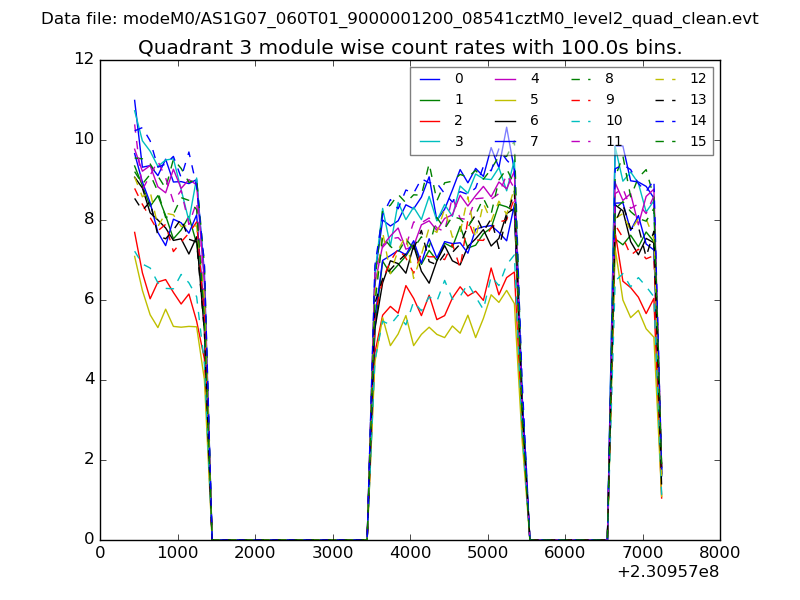
| Module-wise count rates for Quadrant A Data is divided into 100 sec bins |
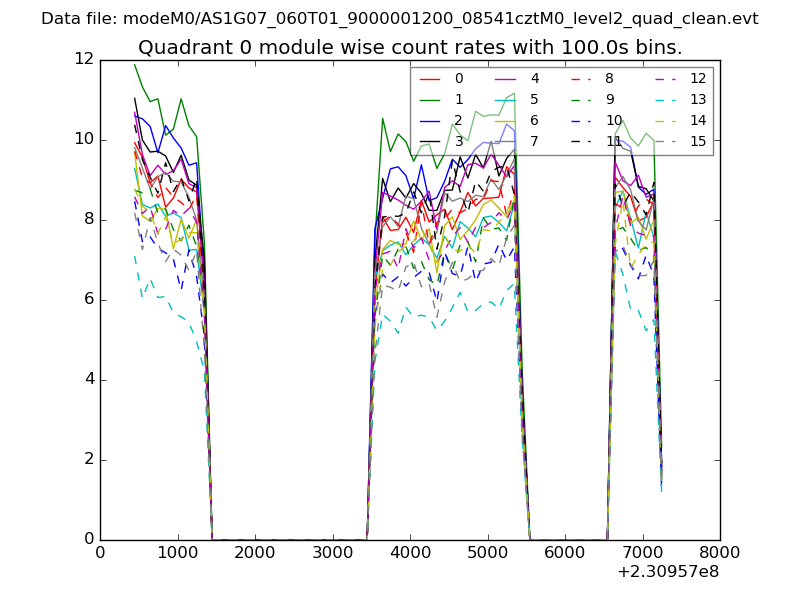 |
 |
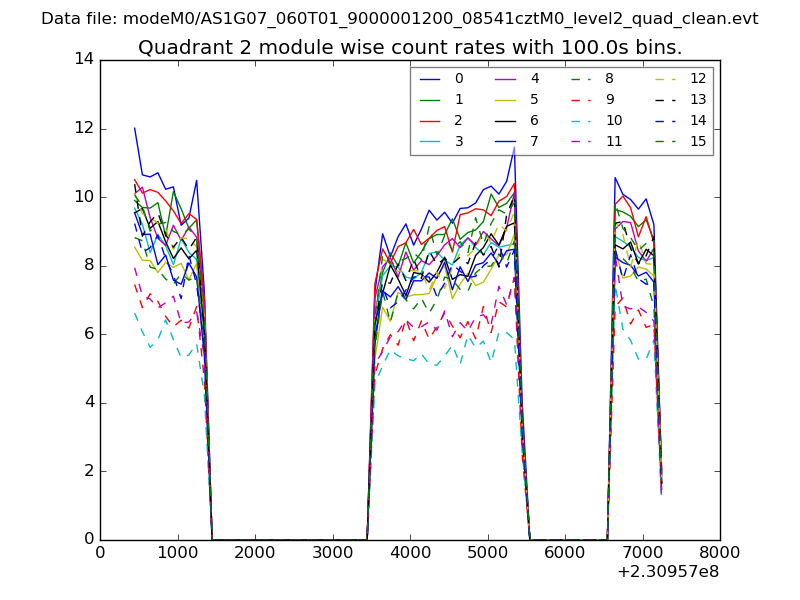
| Module-wise count rates for Quadrant B Data is divided into 100 sec bins |
 |
 |
| Module-wise count rates for Quadrant C Data is divided into 100 sec bins |
 |
 |
| Module-wise count rates for Quadrant D Data is divided into 100 sec bins |
 |
 |
| Parameter | Plot |
|---|---|
| CZT HV Monitor | 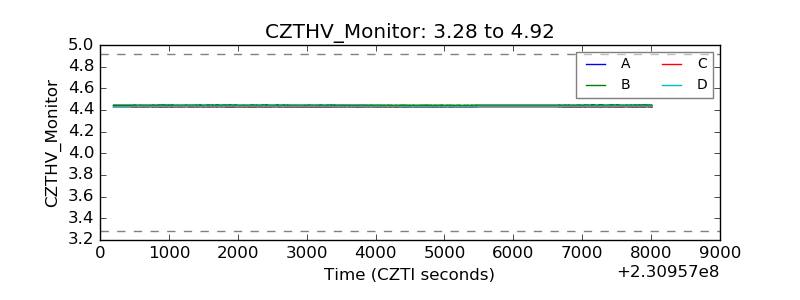 |
| D_VDD | 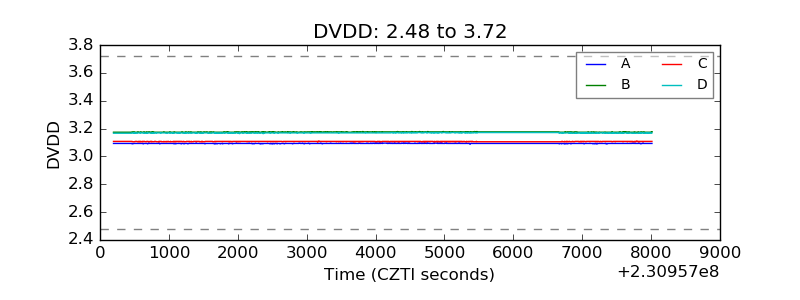 |
| Temperature 1 | 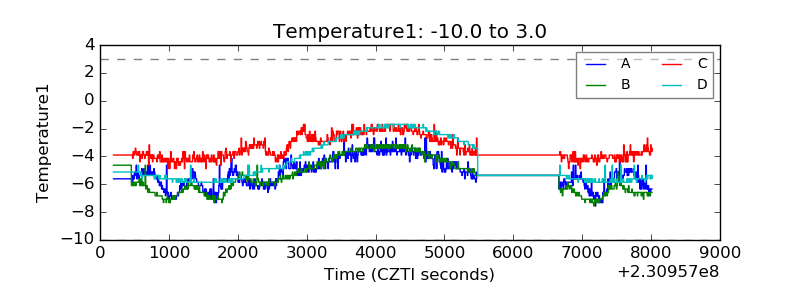 |
| Veto HV Monitor |  |
| Veto LLD | 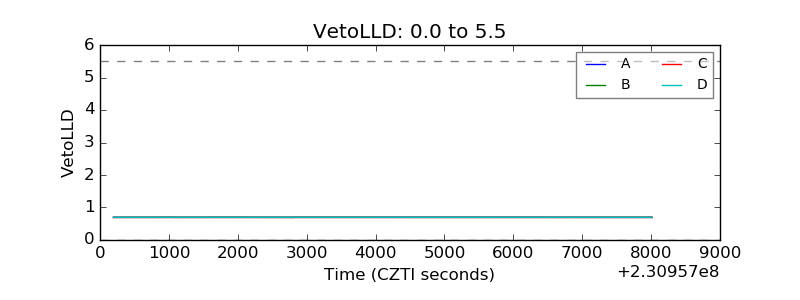 |
| Alpha Counter | 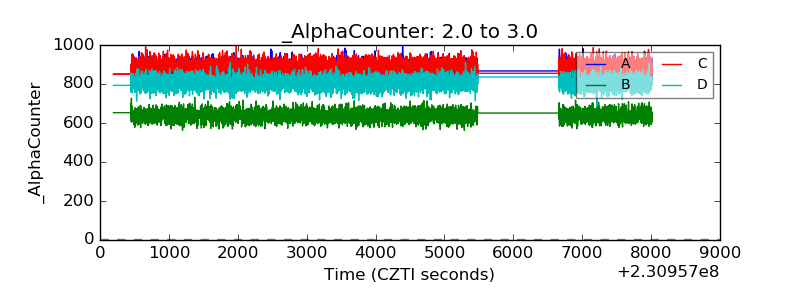 |
| _CPM_Rate | 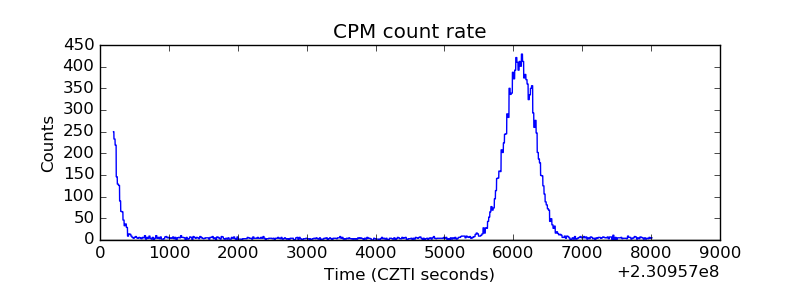 |
| CZT Counter | 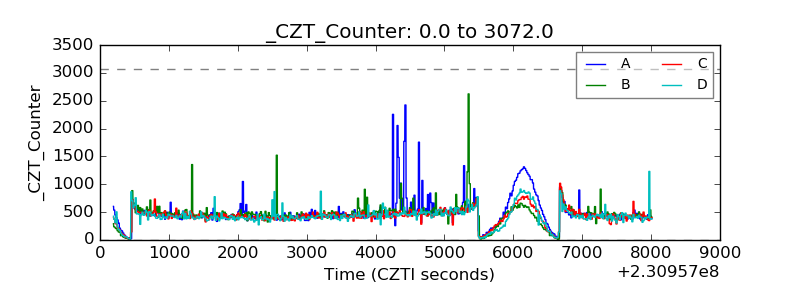 |
| +2.5 Volts monitor |  |
| +5 Volts monitor |  |
| _ROLL_ROT | 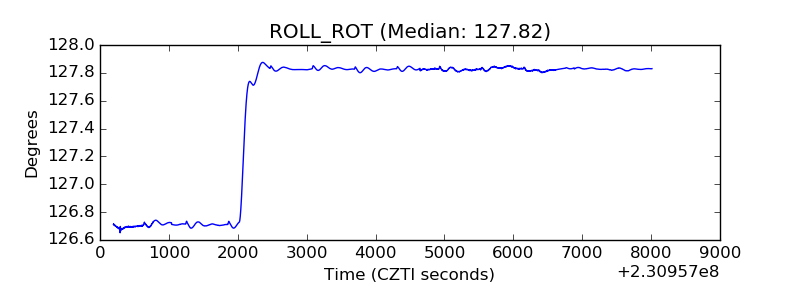 |
| _Roll_DEC | 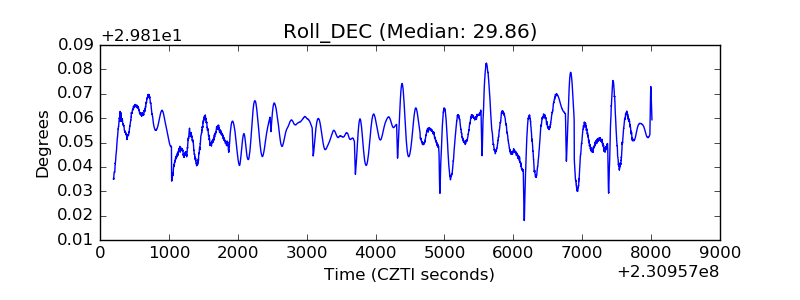 |
| _Roll_RA | 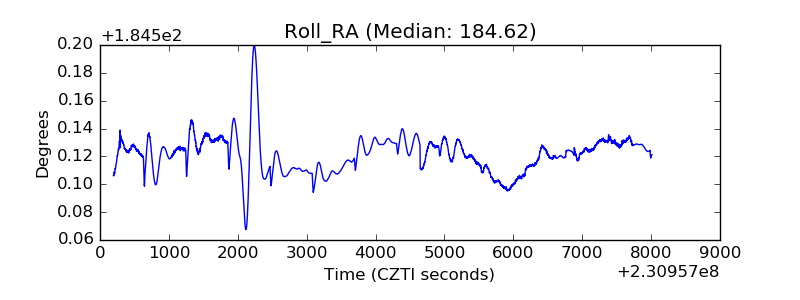 |
| Veto Counter | 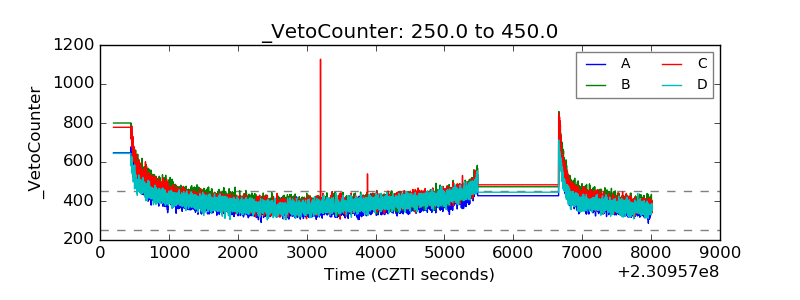 |