| Param | Original file | Final file |
|---|---|---|
| Filename | modeM0/AS1G07_060T01_9000001200_08542cztM0_level2.evt | modeM0/AS1G07_060T01_9000001200_08542cztM0_level2_quad_clean.evt |
| Size (bytes) | 481,538,880 | 80,985,600 |
| Size | 459.2 MB | 77.2 MB |
| Events in quadrant A | 3,676,618 | 491,222 |
| Events in quadrant B | 3,724,524 | 494,998 |
| Events in quadrant C | 3,267,479 | 491,743 |
| Events in quadrant D | 3,427,377 | 474,803 |
| Mode SS | |||
|---|---|---|---|
| Quadrant | BADHDUFLAG | Total packets | Discarded packets |
| A | 0 | 146 | 0 |
| B | 0 | 146 | 0 |
| C | 0 | 146 | 0 |
| D | 0 | 146 | 0 |
| Mode M0 | |||
|---|---|---|---|
| Quadrant | BADHDUFLAG | Total packets | Discarded packets |
| A | 0 | 15869 | 25 |
| B | 0 | 15872 | 20 |
| C | 0 | 14810 | 13 |
| D | 0 | 15515 | 17 |
| Mode M9 | |||
|---|---|---|---|
| Quadrant | BADHDUFLAG | Total packets | Discarded packets |
| A | 0 | 21 | 0 |
| B | 0 | 21 | 0 |
| C | 0 | 21 | 0 |
| D | 0 | 21 | 0 |
| Quadrant | Total seconds | Saturated seconds | Saturation percentage |
|---|---|---|---|
| A | 7177 | 97 | 1.351540% |
| B | 7178 | 185 | 2.577320% |
| C | 7182 | 29 | 0.403787% |
| D | 7181 | 57 | 0.793761% |
Noise dominated data is calculated using 1-second bins in cleaned event files. If a bin has >2000 counts, and if more than 50% of those come from <1% of pixels, then it is considered to be noise-dominated and hence unusable.
| Quadrant | # 1 sec bins | Bins with >0 counts | Bins with >2000 counts | High rate bins dominated by noise | Noise dominated (total time) | Noise dominated (detector-on time) | Marked lightcurve |
|---|---|---|---|---|---|---|---|
| A | 9212 | 7189 | 24 | 24 | 0.26% | 0.33% | 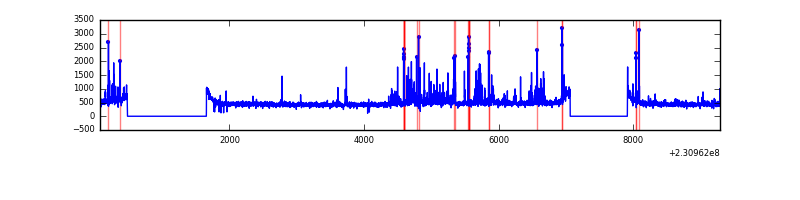 |
| B | 9212 | 7188 | 74 | 74 | 0.80% | 1.03% | 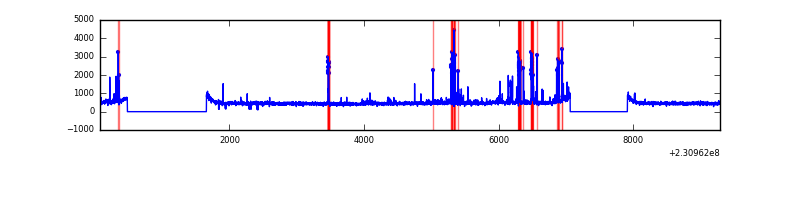 |
| C | 9212 | 7189 | 0 | 0 | 0.00% | 0.00% | 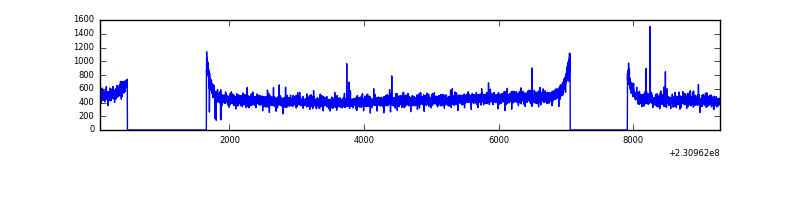 |
| D | 9212 | 7189 | 34 | 34 | 0.37% | 0.47% | 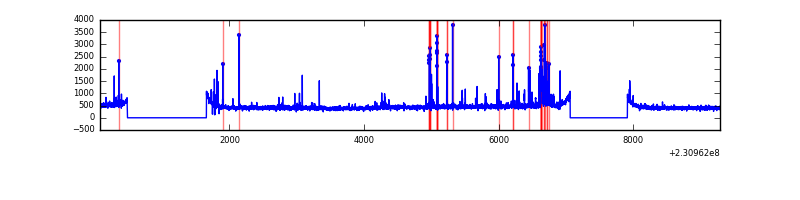 |
Top three noisy pixels from each quadrant. If the there are fewer than three noisy pixels in the level2.evt file, extra rows are filled as -1
| Pixel properties | Quadrant properties | ||||||
|---|---|---|---|---|---|---|---|
| Quadrant | DetID | PixID | Counts | Sigma | Mean | Median | Sigma |
| A | 15 | 223 | 249632 | 1433.34 | 852 | 833 | 173.6 |
| A | 15 | 239 | 97537 | 557.12 | 852 | 833 | 173.6 |
| A | 13 | 248 | 32818 | 184.27 | 852 | 833 | 173.6 |
| B | 10 | 16 | 337044 | 2044.58 | 857 | 836 | 164.4 |
| B | 0 | 214 | 28040 | 165.44 | 857 | 836 | 164.4 |
| B | 12 | 111 | 18786 | 109.16 | 857 | 836 | 164.4 |
| C | 9 | 54 | 19330 | 95.85 | 832 | 836 | 192.9 |
| C | 13 | 61 | 6390 | 28.79 | 832 | 836 | 192.9 |
| C | 8 | 222 | 4398 | 18.46 | 832 | 836 | 192.9 |
| D | 1 | 52 | 183133 | 892.24 | 822 | 798 | 204.4 |
| D | 7 | 71 | 40989 | 196.67 | 822 | 798 | 204.4 |
| D | 9 | 64 | 27676 | 131.53 | 822 | 798 | 204.4 |
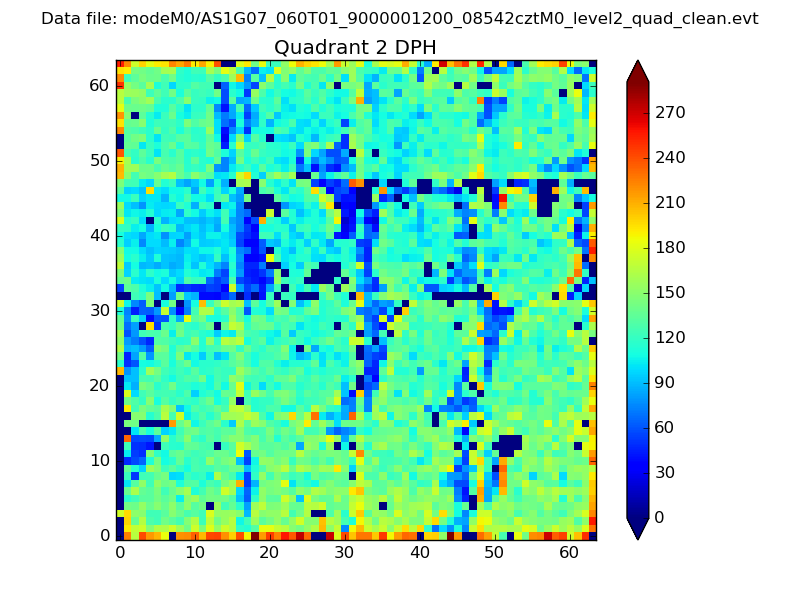
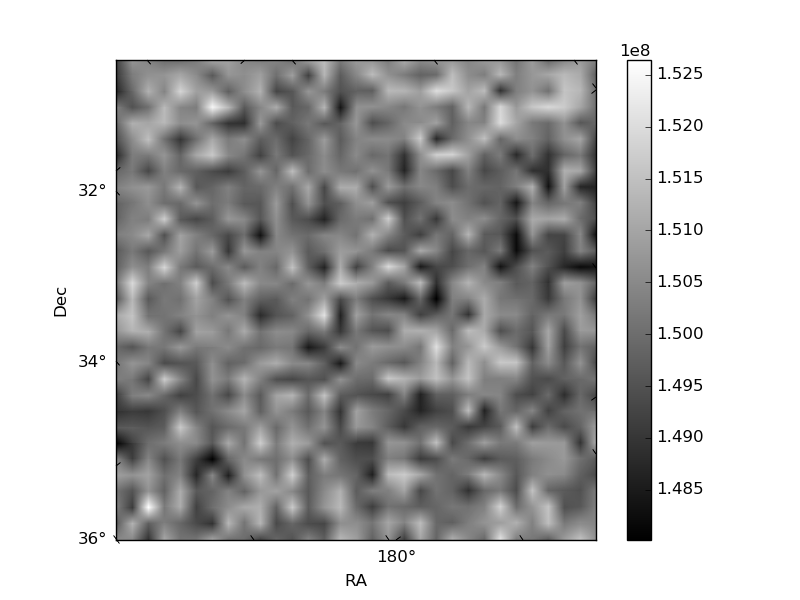
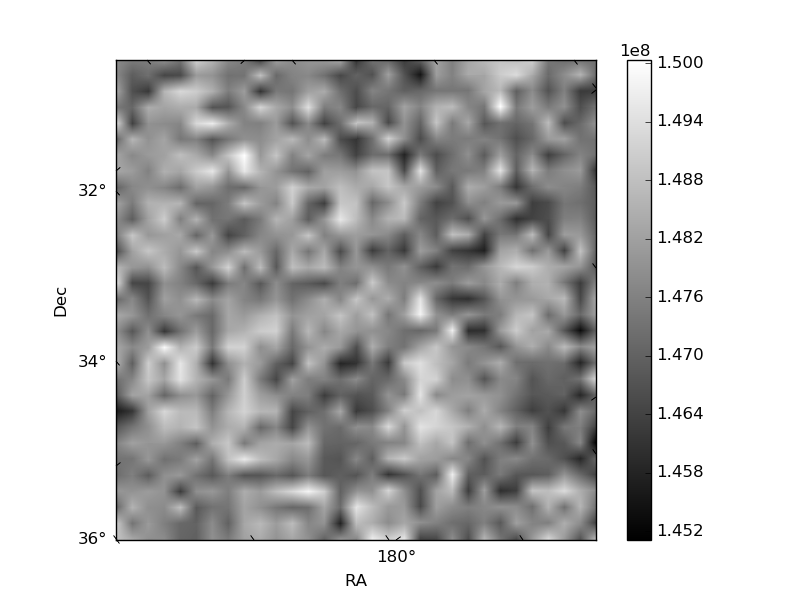
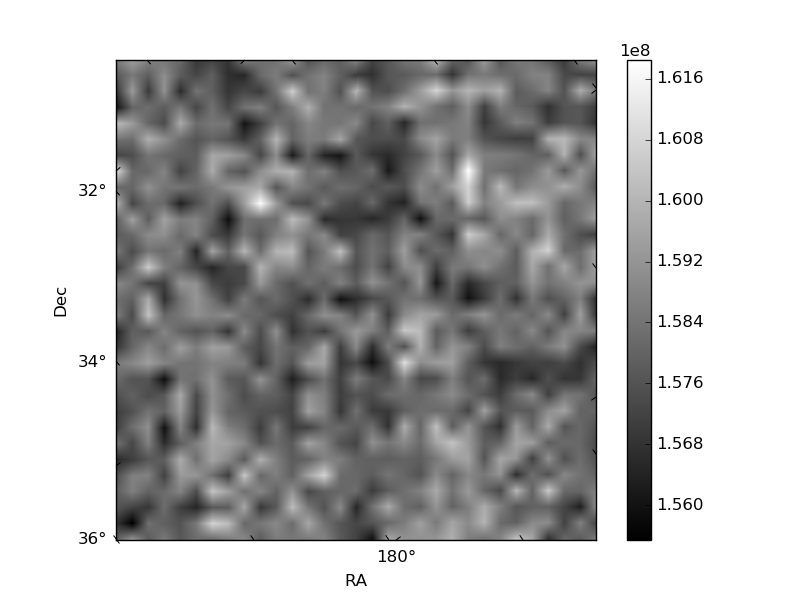
Histogram calculated using DETX and DETY for each event in the final _common_clean file
| Quadrant A | 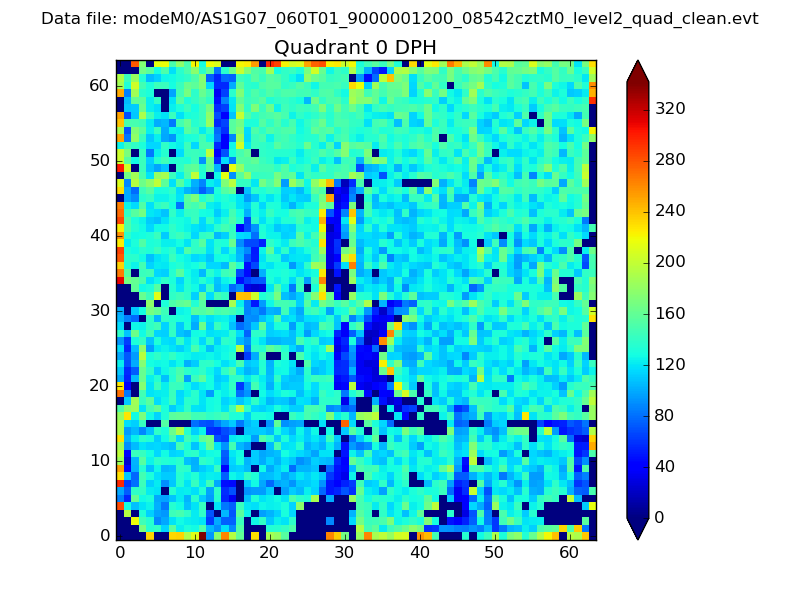 |
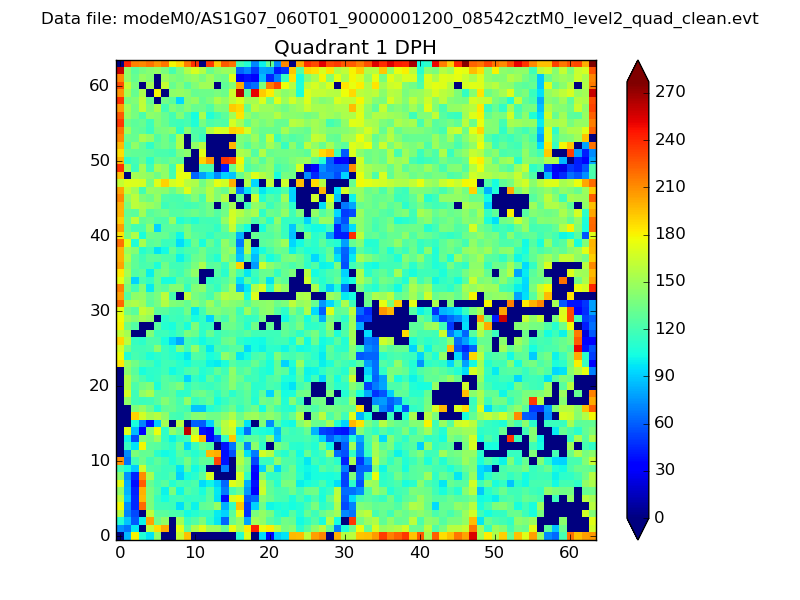 |
Quadrant B |
|---|---|---|---|
| Quadrant D | 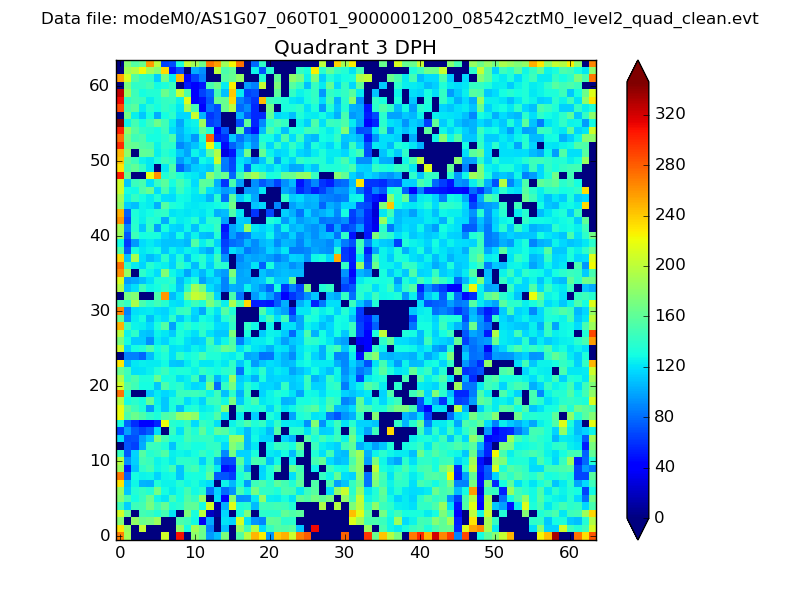 |
 |
Quadrant C |
| Plot type | Count rate plots | Images |
|---|---|---|
| Comparison with Poisson distribution Blue bars denote a histogram of data divided into 1 sec bins. Red curve is a Poisson curve with rate = median count rate of data. |
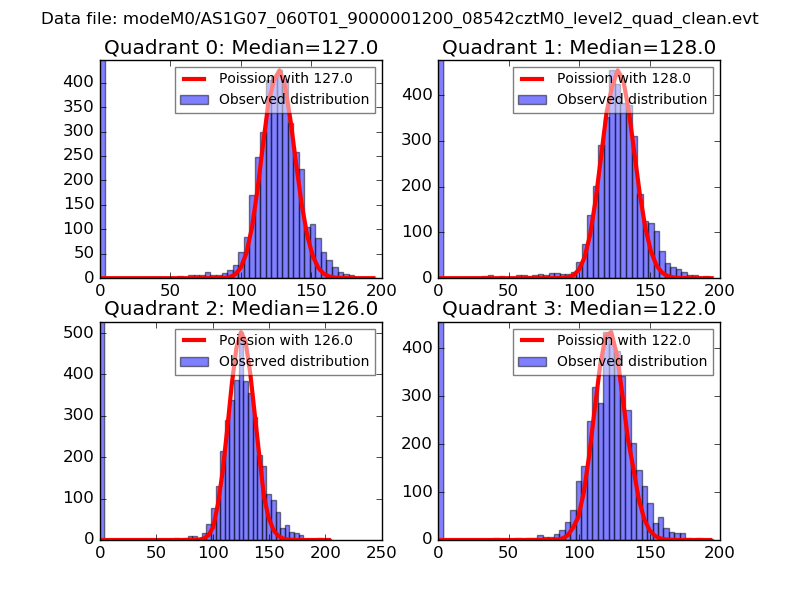 |
 |
| Quadrant-wise count rates Data is divided into 100 sec bins |
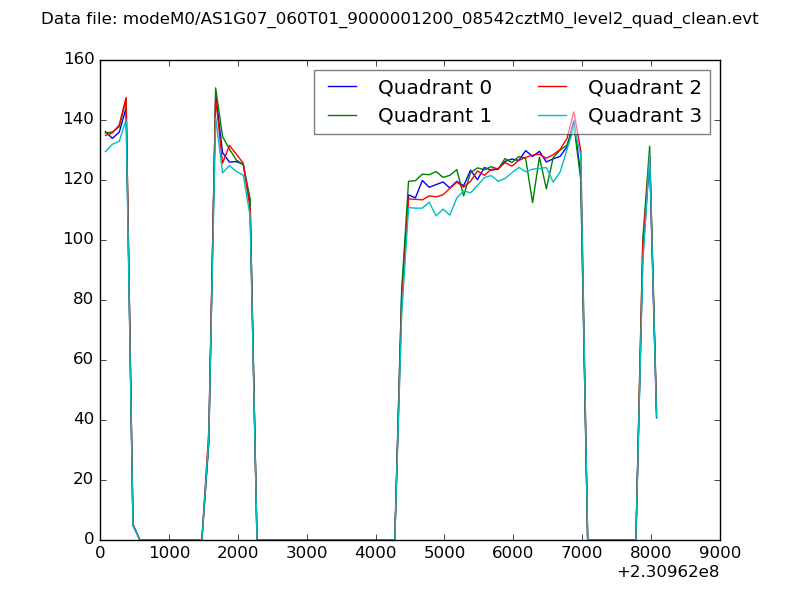 |
|
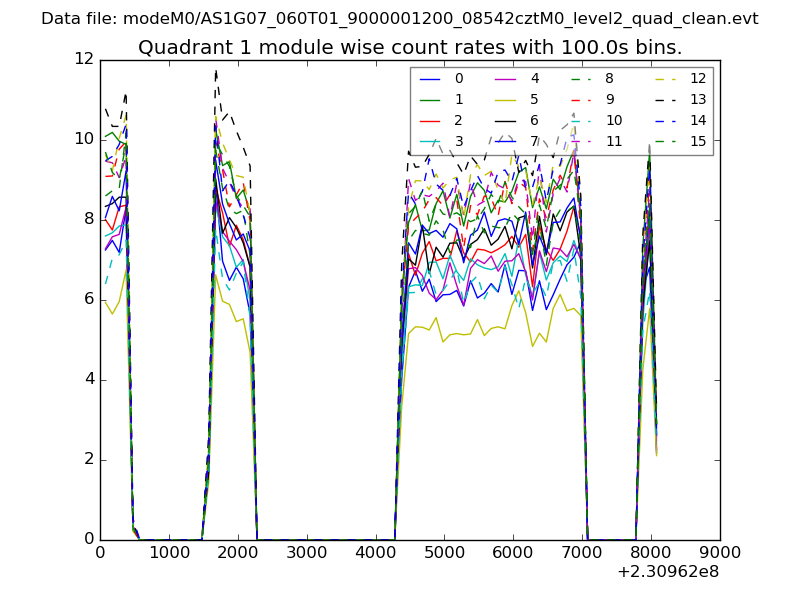
| Module-wise count rates for Quadrant A Data is divided into 100 sec bins |
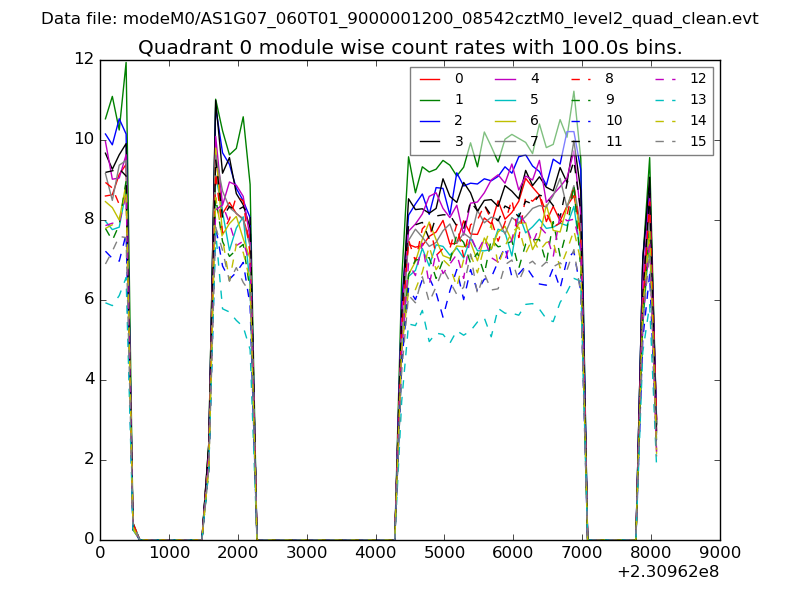 |
 |
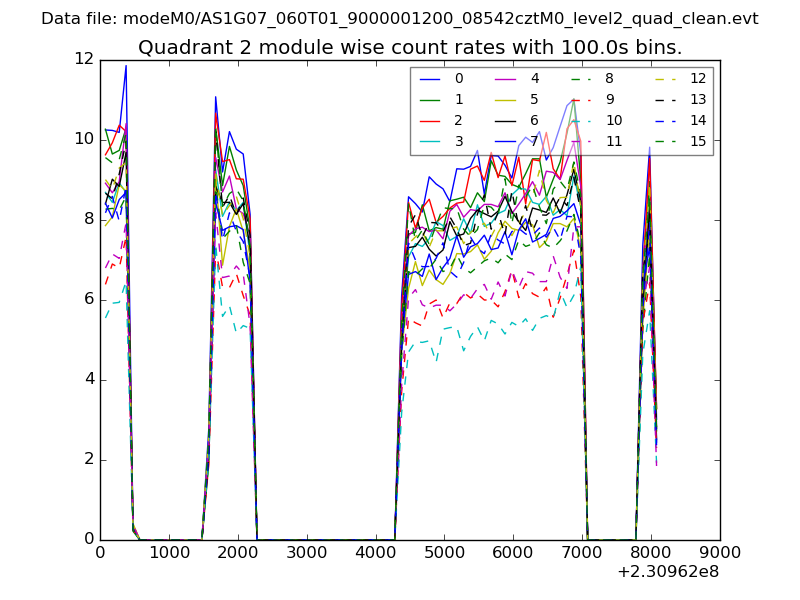
| Module-wise count rates for Quadrant B Data is divided into 100 sec bins |
 |
 |
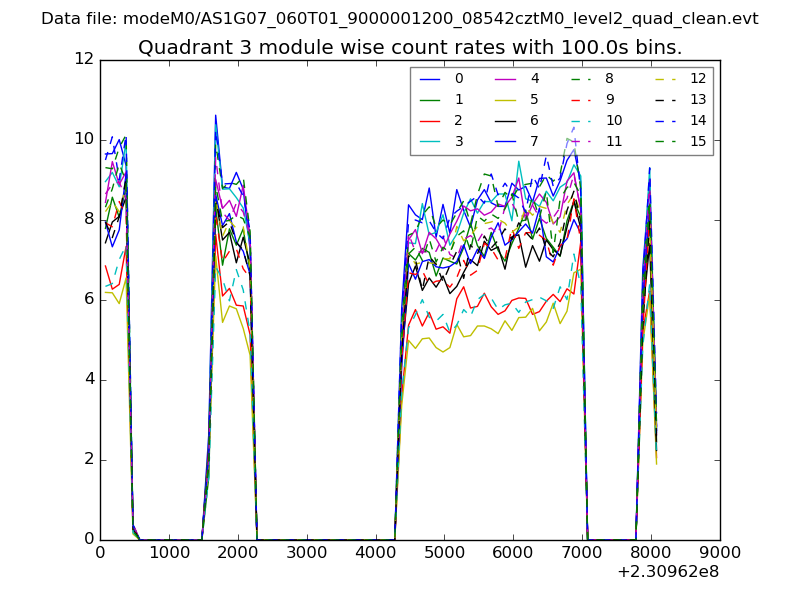
| Module-wise count rates for Quadrant C Data is divided into 100 sec bins |
 |
 |
| Module-wise count rates for Quadrant D Data is divided into 100 sec bins |
 |
 |
| Parameter | Plot |
|---|---|
| CZT HV Monitor | 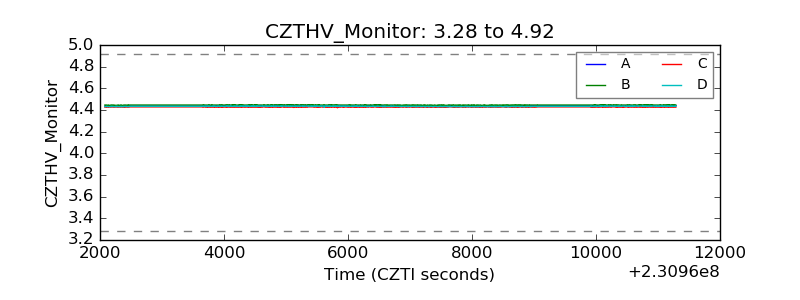 |
| D_VDD | 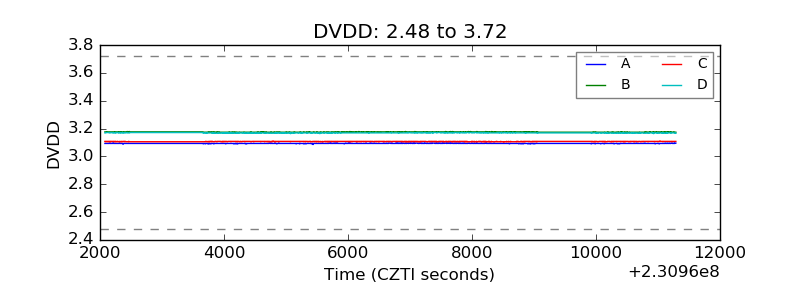 |
| Temperature 1 | 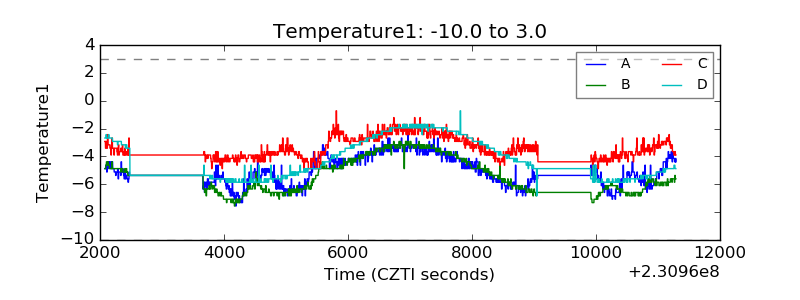 |
| Veto HV Monitor | 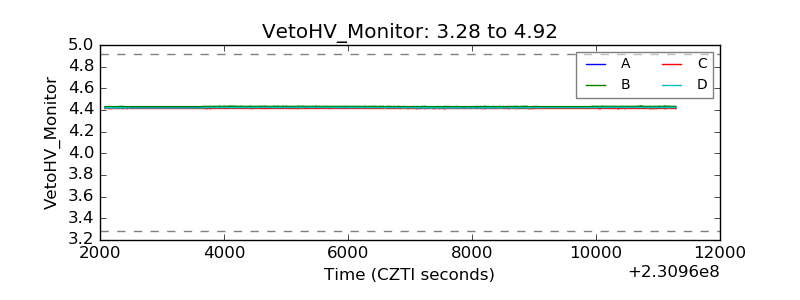 |
| Veto LLD | 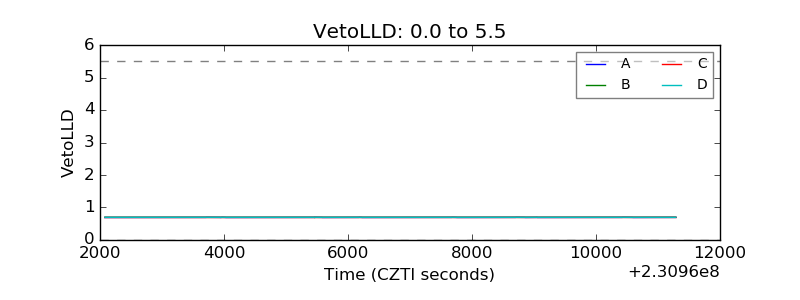 |
| Alpha Counter | 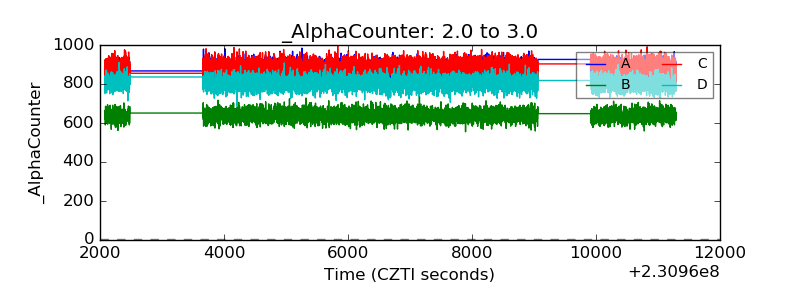 |
| _CPM_Rate | 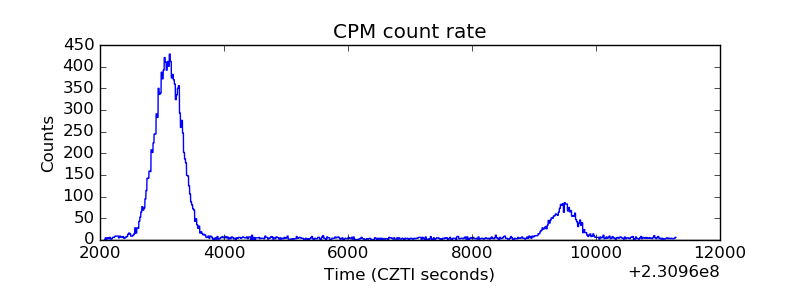 |
| CZT Counter | 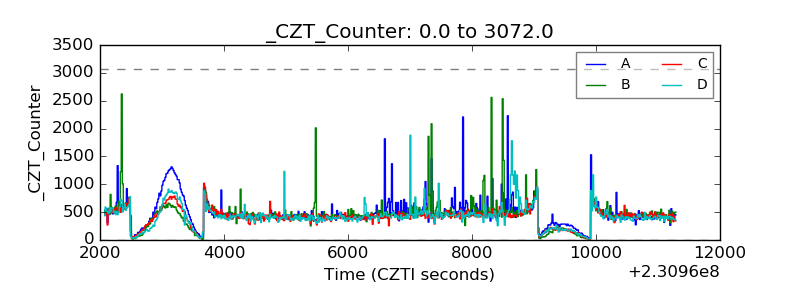 |
| +2.5 Volts monitor |  |
| +5 Volts monitor | 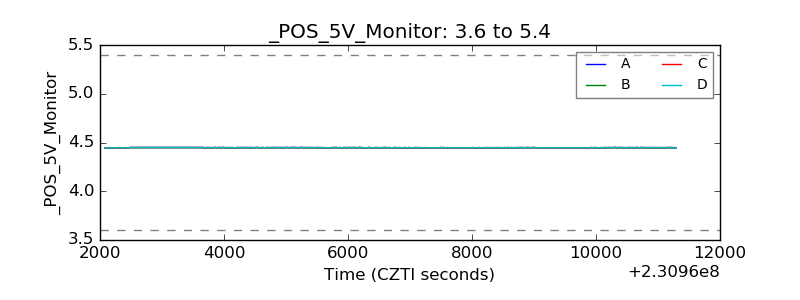 |
| _ROLL_ROT | 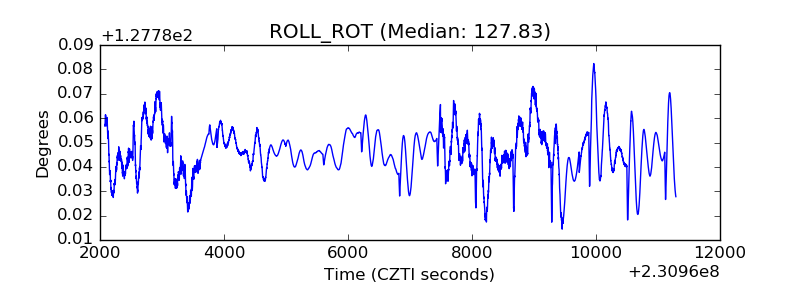 |
| _Roll_DEC | 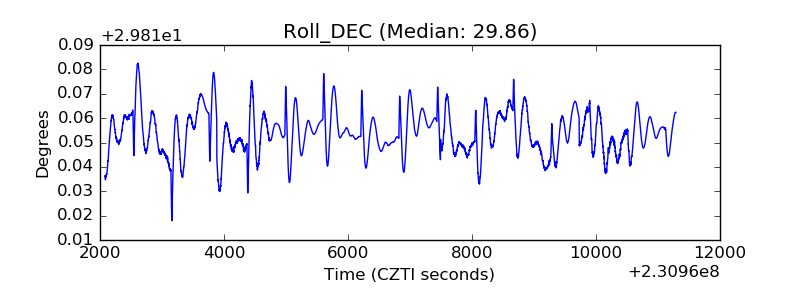 |
| _Roll_RA |  |
| Veto Counter | 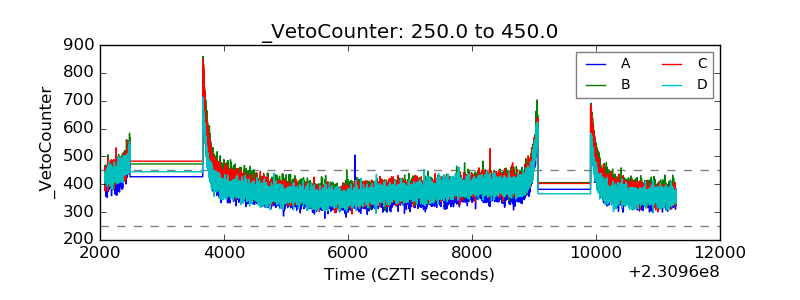 |