| Param | Original file | Final file |
|---|---|---|
| Filename | modeM0/AS1G07_060T01_9000001200_08543cztM0_level2.evt | modeM0/AS1G07_060T01_9000001200_08543cztM0_level2_quad_clean.evt |
| Size (bytes) | 493,824,960 | 79,404,480 |
| Size | 470.9 MB | 75.7 MB |
| Events in quadrant A | 3,912,373 | 470,867 |
| Events in quadrant B | 3,694,137 | 477,168 |
| Events in quadrant C | 3,449,945 | 474,895 |
| Events in quadrant D | 3,389,025 | 459,464 |
| Mode SS | |||
|---|---|---|---|
| Quadrant | BADHDUFLAG | Total packets | Discarded packets |
| A | 0 | 154 | 0 |
| B | 0 | 154 | 0 |
| C | 0 | 154 | 0 |
| D | 0 | 154 | 0 |
| Mode M0 | |||
|---|---|---|---|
| Quadrant | BADHDUFLAG | Total packets | Discarded packets |
| A | 0 | 16759 | 3 |
| B | 0 | 16052 | 2 |
| C | 0 | 15656 | 2 |
| D | 0 | 15754 | 2 |
| Mode M9 | |||
|---|---|---|---|
| Quadrant | BADHDUFLAG | Total packets | Discarded packets |
| A | 0 | 12 | 0 |
| B | 0 | 12 | 0 |
| C | 0 | 12 | 0 |
| D | 0 | 12 | 0 |
| Quadrant | Total seconds | Saturated seconds | Saturation percentage |
|---|---|---|---|
| A | 7499 | 317 | 4.227230% |
| B | 7499 | 298 | 3.973863% |
| C | 7499 | 148 | 1.973596% |
| D | 7499 | 167 | 2.226964% |
Noise dominated data is calculated using 1-second bins in cleaned event files. If a bin has >2000 counts, and if more than 50% of those come from <1% of pixels, then it is considered to be noise-dominated and hence unusable.
| Quadrant | # 1 sec bins | Bins with >0 counts | Bins with >2000 counts | High rate bins dominated by noise | Noise dominated (total time) | Noise dominated (detector-on time) | Marked lightcurve |
|---|---|---|---|---|---|---|---|
| A | 8674 | 7500 | 74 | 74 | 0.85% | 0.99% | 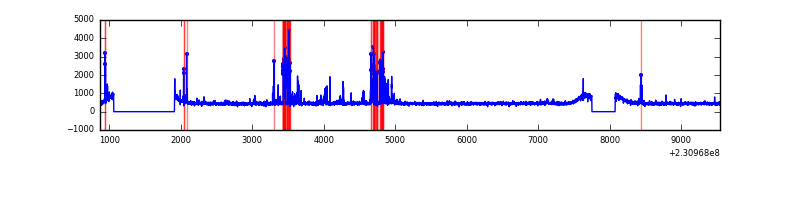 |
| B | 8674 | 7499 | 25 | 25 | 0.29% | 0.33% | 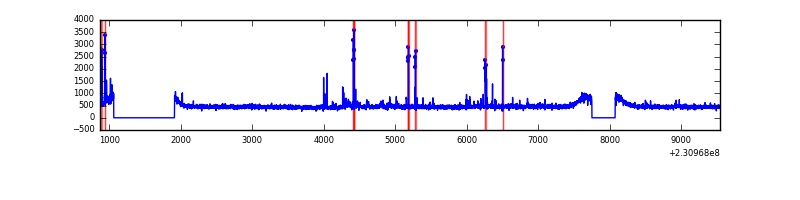 |
| C | 8674 | 7500 | 1 | 1 | 0.01% | 0.01% | 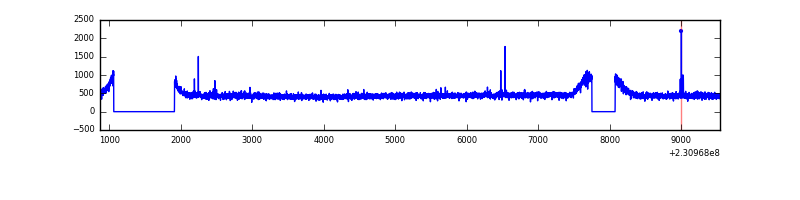 |
| D | 8674 | 7500 | 8 | 8 | 0.09% | 0.11% | 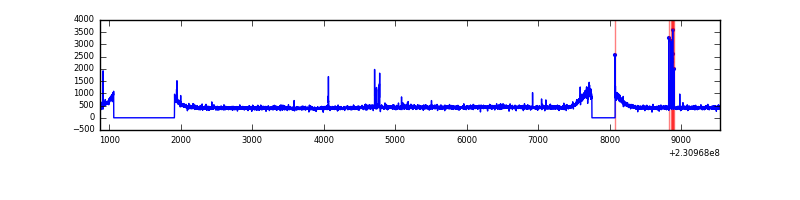 |
Top three noisy pixels from each quadrant. If the there are fewer than three noisy pixels in the level2.evt file, extra rows are filled as -1
| Pixel properties | Quadrant properties | ||||||
|---|---|---|---|---|---|---|---|
| Quadrant | DetID | PixID | Counts | Sigma | Mean | Median | Sigma |
| A | 15 | 223 | 247261 | 1344.28 | 897 | 876 | 183.3 |
| A | 15 | 239 | 112107 | 606.88 | 897 | 876 | 183.3 |
| A | 13 | 248 | 40900 | 218.37 | 897 | 876 | 183.3 |
| B | 10 | 16 | 141170 | 792.98 | 902 | 875 | 176.9 |
| B | 0 | 214 | 38862 | 214.71 | 902 | 875 | 176.9 |
| B | 12 | 111 | 20634 | 111.68 | 902 | 875 | 176.9 |
| C | 9 | 54 | 16011 | 73.6 | 877 | 879 | 205.6 |
| C | 14 | 234 | 7319 | 31.32 | 877 | 879 | 205.6 |
| C | 13 | 61 | 6620 | 27.92 | 877 | 879 | 205.6 |
| D | 1 | 52 | 40123 | 181.22 | 869 | 844 | 216.7 |
| D | 2 | 234 | 23584 | 104.92 | 869 | 844 | 216.7 |
| D | 2 | 14 | 19239 | 84.87 | 869 | 844 | 216.7 |
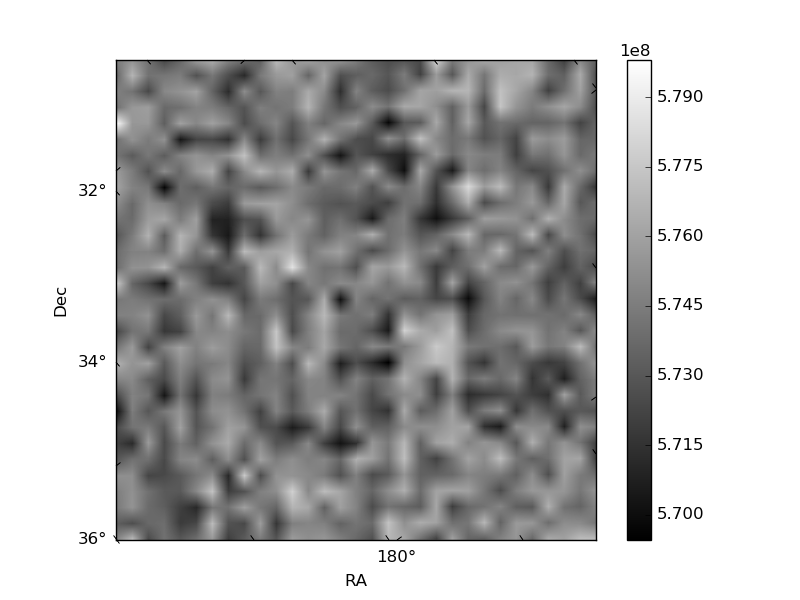
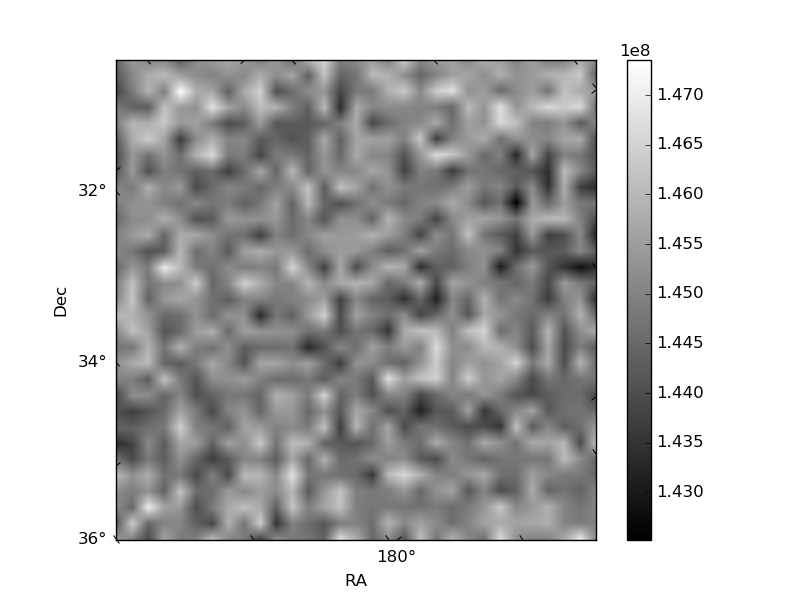
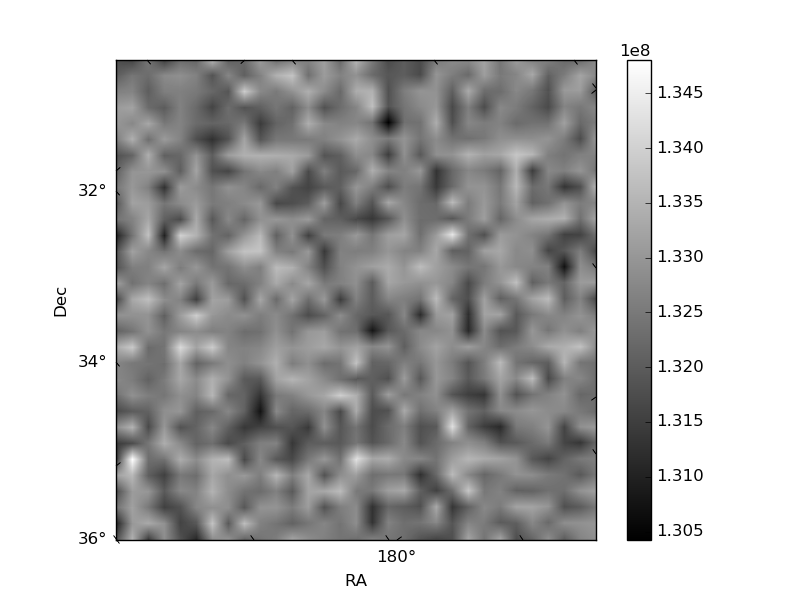
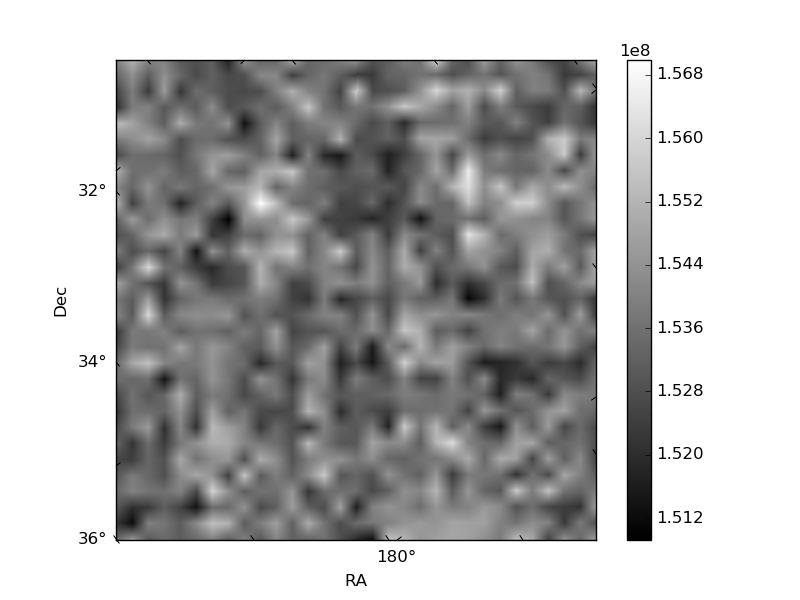
Histogram calculated using DETX and DETY for each event in the final _common_clean file
| Quadrant A | 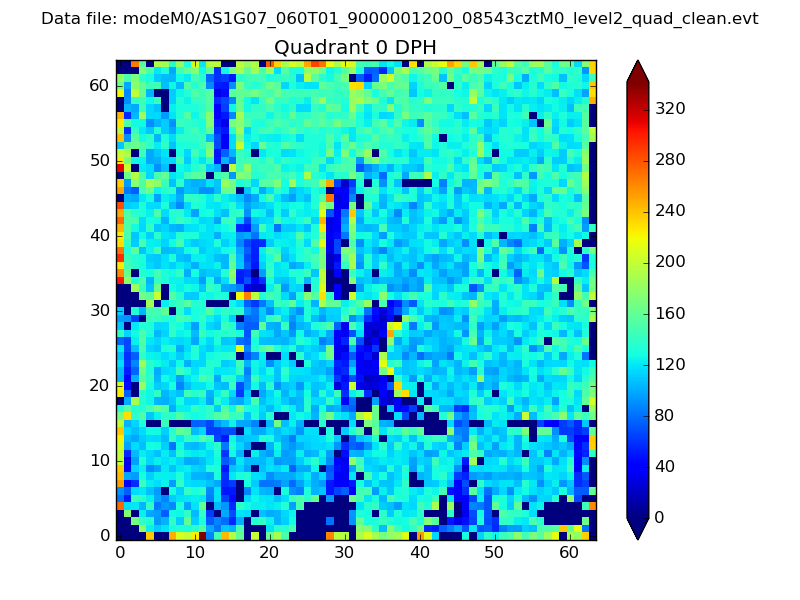 |
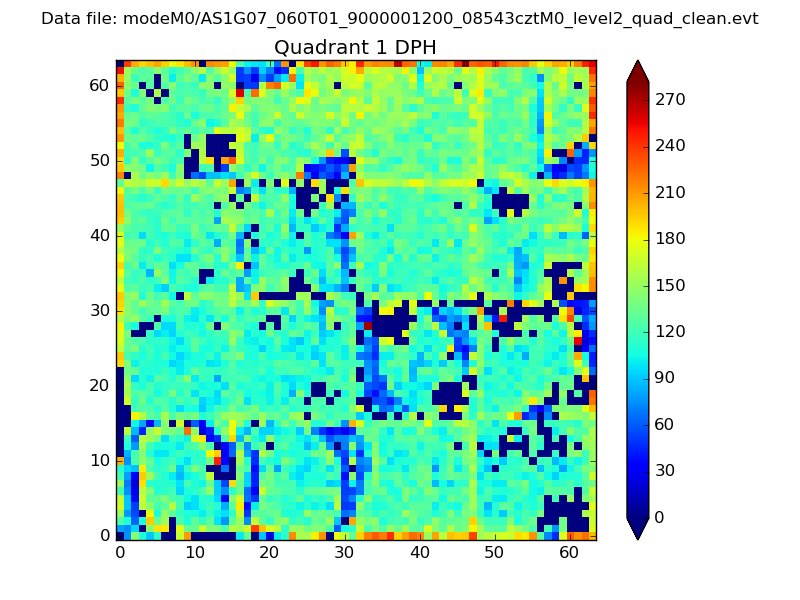 |
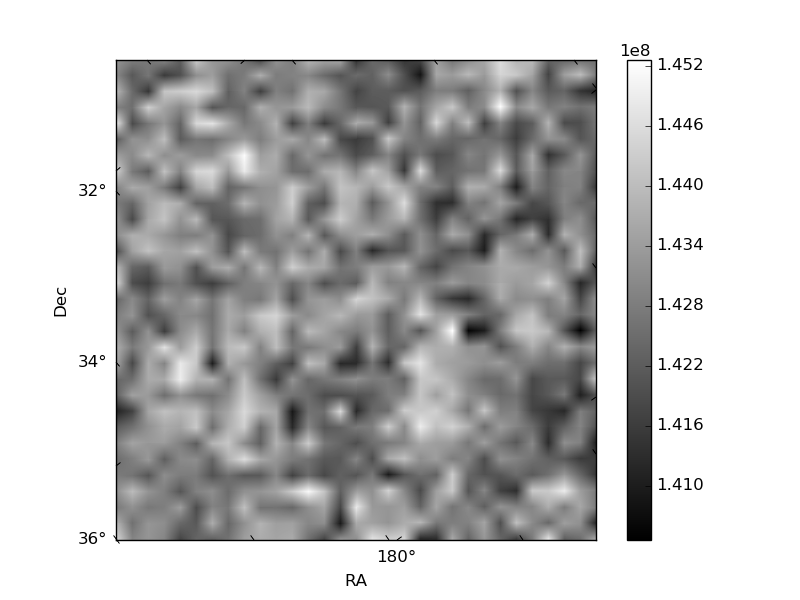
Quadrant B |
|---|---|---|---|
| Quadrant D | 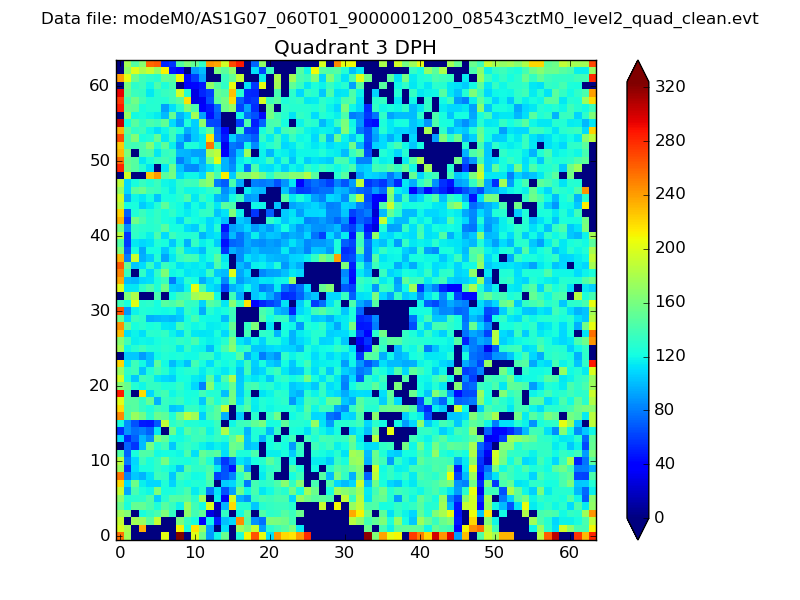 |
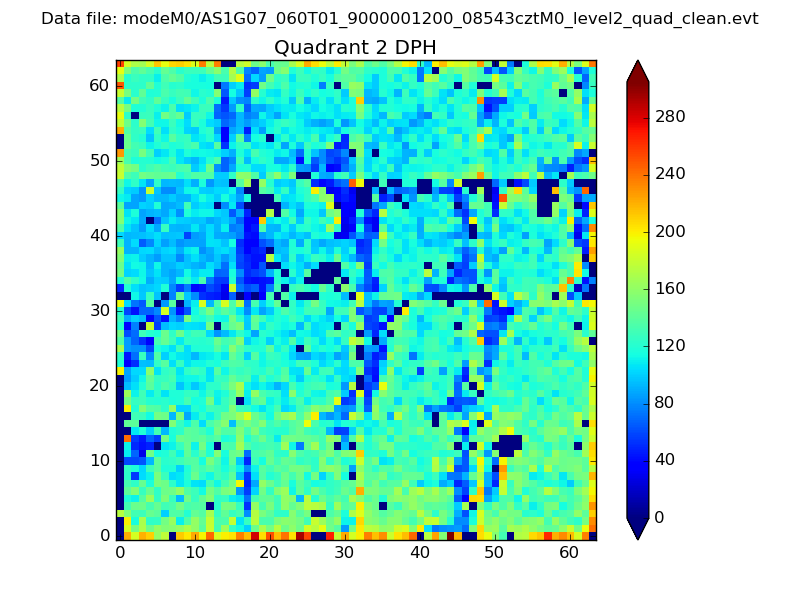 |
Quadrant C |
| Plot type | Count rate plots | Images |
|---|---|---|
| Comparison with Poisson distribution Blue bars denote a histogram of data divided into 1 sec bins. Red curve is a Poisson curve with rate = median count rate of data. |
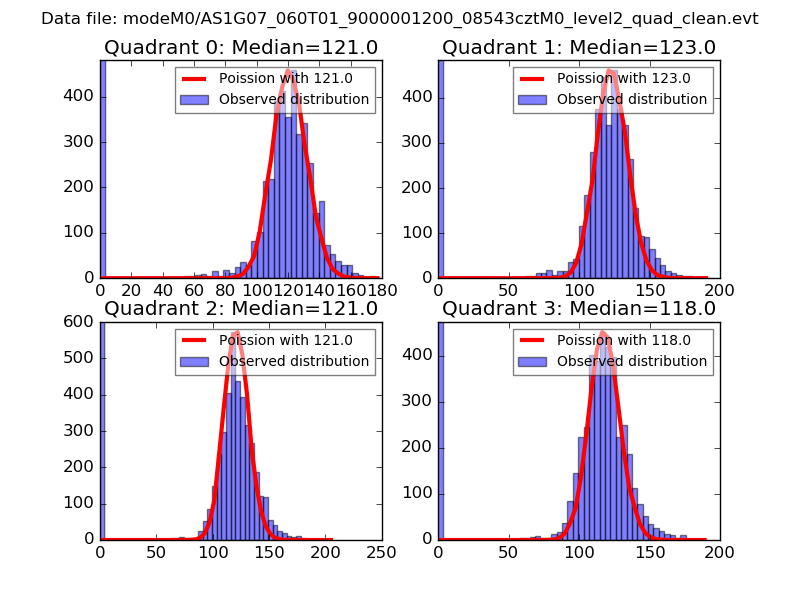 |
 |
| Quadrant-wise count rates Data is divided into 100 sec bins |
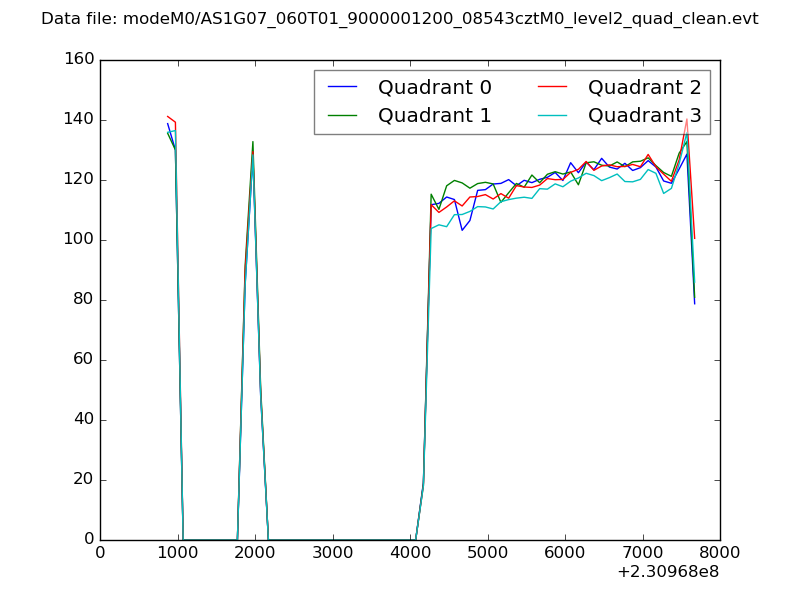 |
|
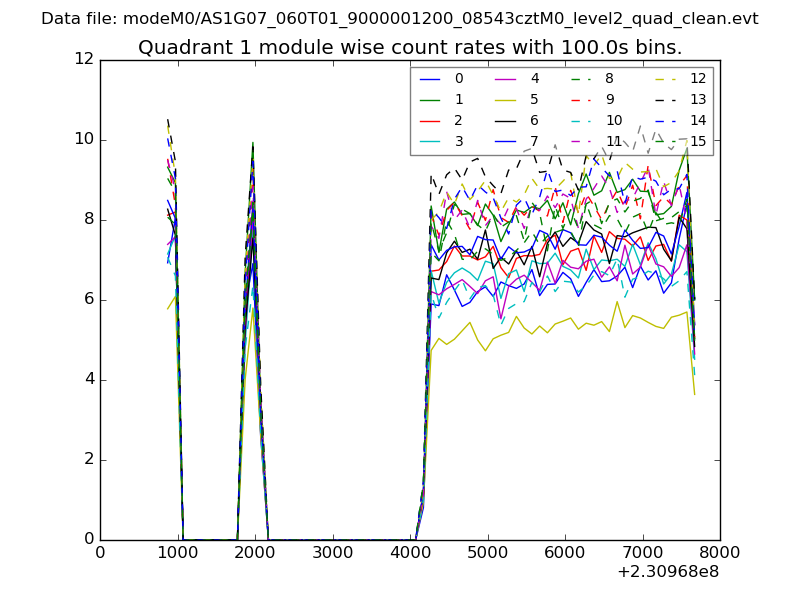
| Module-wise count rates for Quadrant A Data is divided into 100 sec bins |
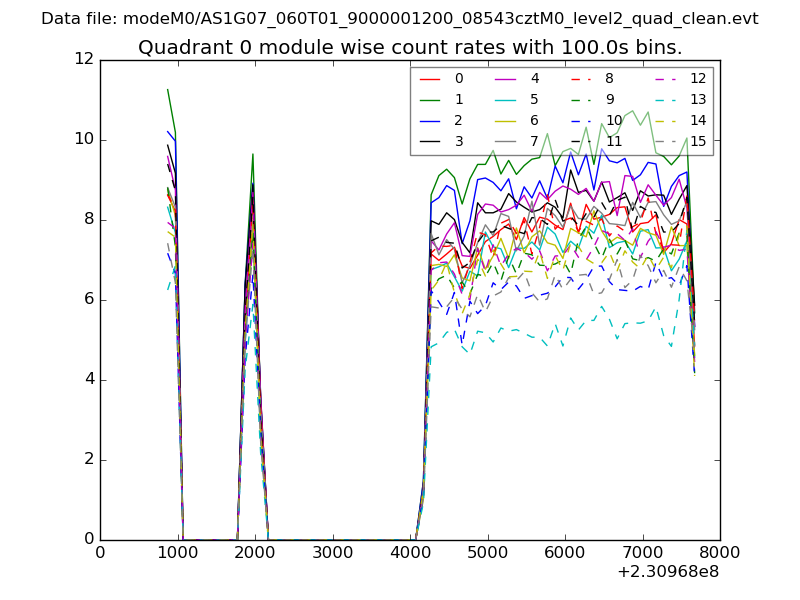 |
 |
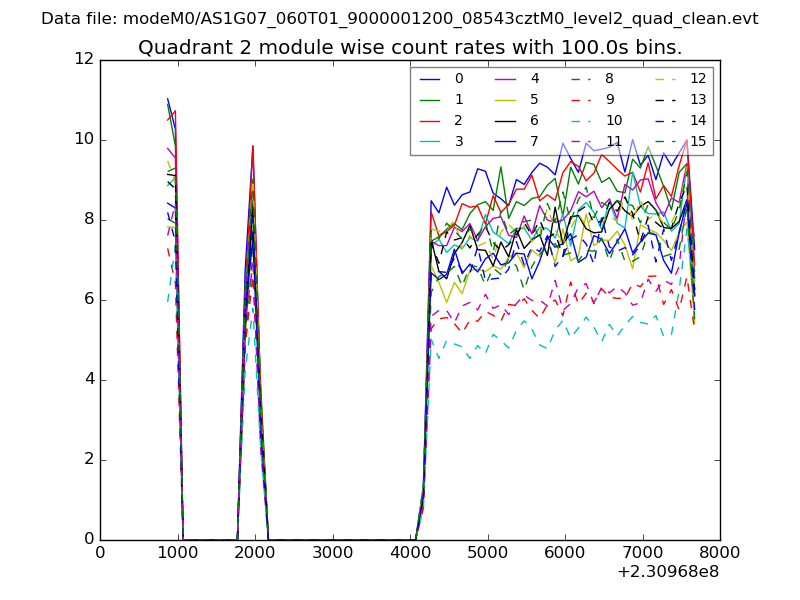
| Module-wise count rates for Quadrant B Data is divided into 100 sec bins |
 |
 |
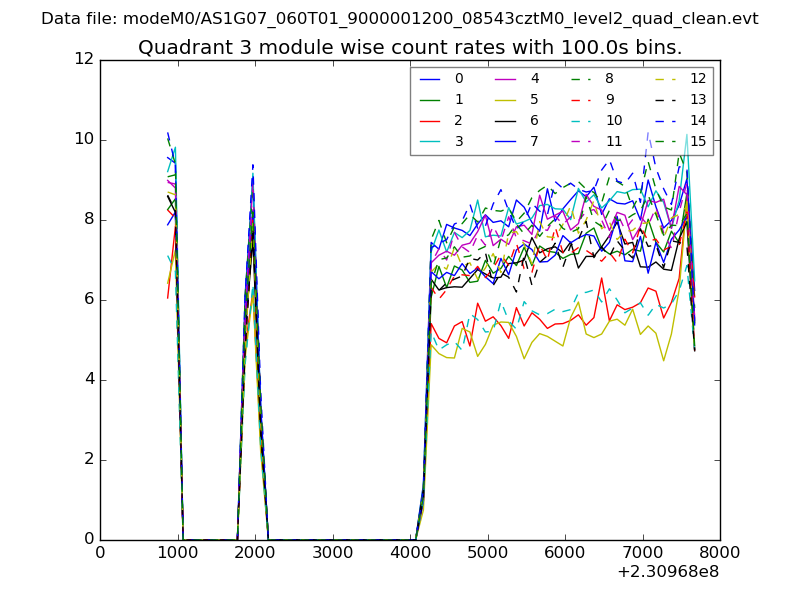
| Module-wise count rates for Quadrant C Data is divided into 100 sec bins |
 |
 |
| Module-wise count rates for Quadrant D Data is divided into 100 sec bins |
 |
 |
| Parameter | Plot |
|---|---|
| CZT HV Monitor | 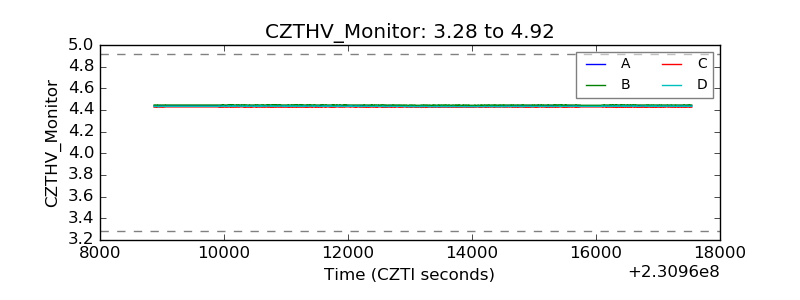 |
| D_VDD | 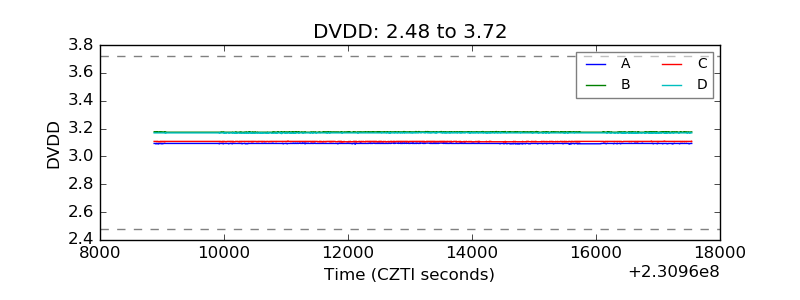 |
| Temperature 1 | 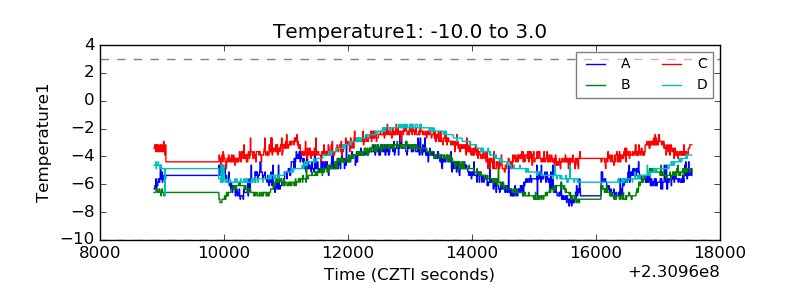 |
| Veto HV Monitor | 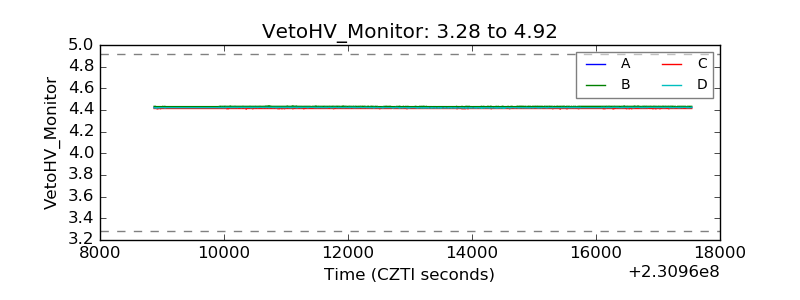 |
| Veto LLD | 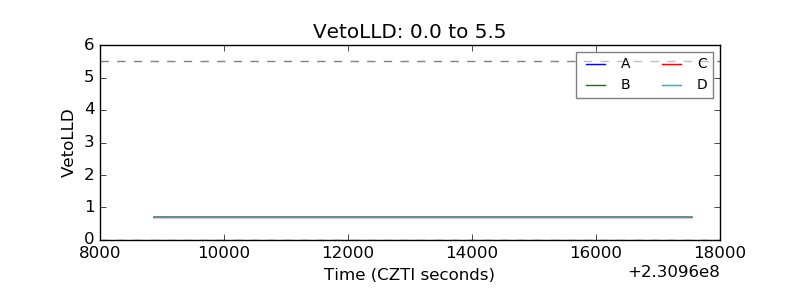 |
| Alpha Counter | 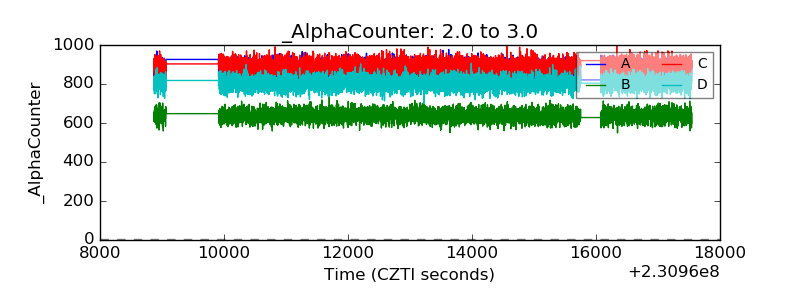 |
| _CPM_Rate | 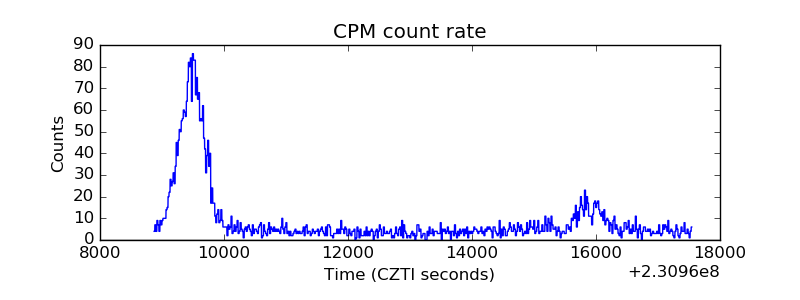 |
| CZT Counter | 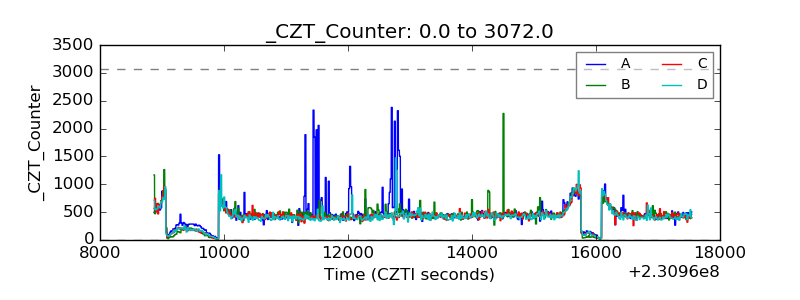 |
| +2.5 Volts monitor |  |
| +5 Volts monitor |  |
| _ROLL_ROT | 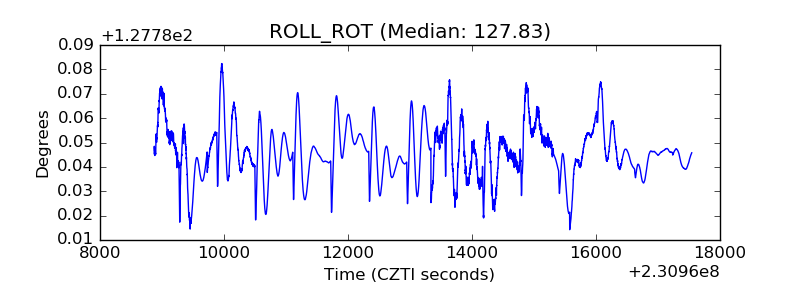 |
| _Roll_DEC | 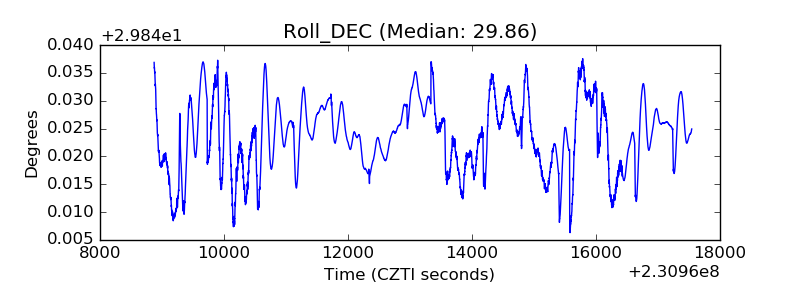 |
| _Roll_RA | 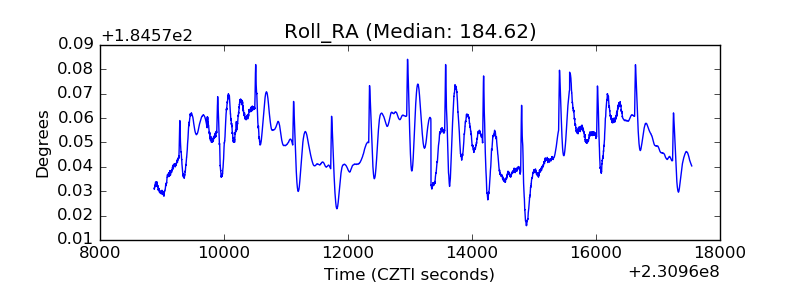 |
| Veto Counter | 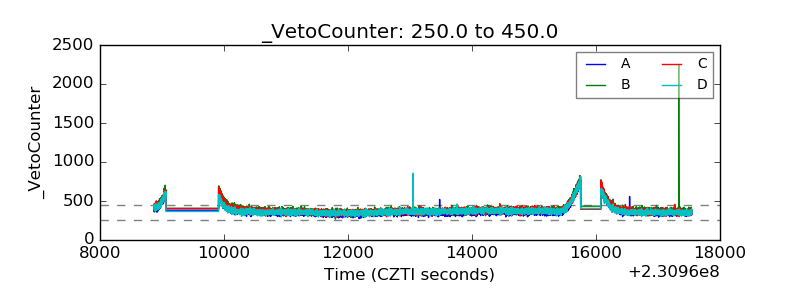 |