| Param | Original file | Final file |
|---|---|---|
| Filename | modeM0/AS1G07_060T01_9000001200_08545cztM0_level2.evt | modeM0/AS1G07_060T01_9000001200_08545cztM0_level2_quad_clean.evt |
| Size (bytes) | 573,217,920 | 87,816,960 |
| Size | 546.7 MB | 83.7 MB |
| Events in quadrant A | 4,078,826 | 524,018 |
| Events in quadrant B | 4,250,011 | 526,687 |
| Events in quadrant C | 3,924,239 | 518,927 |
| Events in quadrant D | 4,529,064 | 499,269 |
| Mode SS | |||
|---|---|---|---|
| Quadrant | BADHDUFLAG | Total packets | Discarded packets |
| A | 0 | 172 | 2 |
| B | 0 | 172 | 2 |
| C | 0 | 172 | 0 |
| D | 0 | 172 | 0 |
| Mode M0 | |||
|---|---|---|---|
| Quadrant | BADHDUFLAG | Total packets | Discarded packets |
| A | 0 | 18086 | 32 |
| B | 0 | 18299 | 52 |
| C | 0 | 17773 | 26 |
| D | 0 | 19663 | 34 |
| Mode M9 | |||
|---|---|---|---|
| Quadrant | BADHDUFLAG | Total packets | Discarded packets |
| A | 0 | 3 | 0 |
| B | 0 | 3 | 0 |
| C | 0 | 3 | 0 |
| D | 0 | 3 | 0 |
| Quadrant | Total seconds | Saturated seconds | Saturation percentage |
|---|---|---|---|
| A | 8504 | 419 | 4.927093% |
| B | 8497 | 461 | 5.425444% |
| C | 8506 | 269 | 3.162474% |
| D | 8504 | 472 | 5.550329% |
Noise dominated data is calculated using 1-second bins in cleaned event files. If a bin has >2000 counts, and if more than 50% of those come from <1% of pixels, then it is considered to be noise-dominated and hence unusable.
| Quadrant | # 1 sec bins | Bins with >0 counts | Bins with >2000 counts | High rate bins dominated by noise | Noise dominated (total time) | Noise dominated (detector-on time) | Marked lightcurve |
|---|---|---|---|---|---|---|---|
| A | 8809 | 8520 | 14 | 14 | 0.16% | 0.16% | 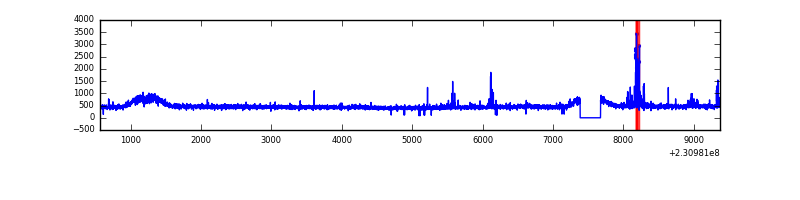 |
| B | 8809 | 8519 | 17 | 17 | 0.19% | 0.20% | 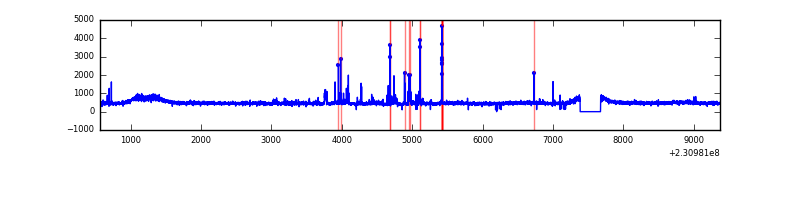 |
| C | 8809 | 8520 | 0 | 0 | 0.00% | 0.00% | 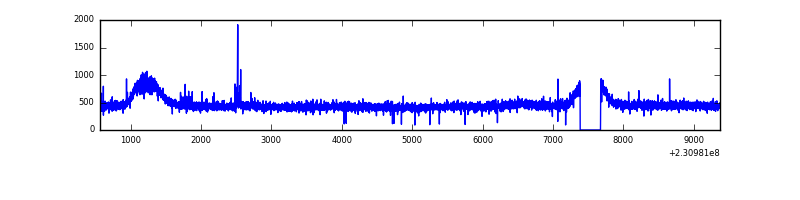 |
| D | 8809 | 8519 | 106 | 106 | 1.20% | 1.24% | 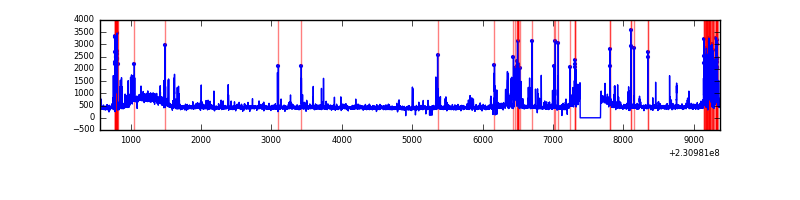 |
Top three noisy pixels from each quadrant. If the there are fewer than three noisy pixels in the level2.evt file, extra rows are filled as -1
| Pixel properties | Quadrant properties | ||||||
|---|---|---|---|---|---|---|---|
| Quadrant | DetID | PixID | Counts | Sigma | Mean | Median | Sigma |
| A | 15 | 223 | 95139 | 442.41 | 1024 | 998 | 212.8 |
| A | 15 | 239 | 33583 | 153.13 | 1024 | 998 | 212.8 |
| A | 12 | 194 | 9960 | 42.12 | 1024 | 998 | 212.8 |
| B | 10 | 16 | 179802 | 896.05 | 1025 | 998 | 199.5 |
| B | 0 | 214 | 33788 | 164.32 | 1025 | 998 | 199.5 |
| B | 12 | 111 | 23267 | 111.6 | 1025 | 998 | 199.5 |
| C | 9 | 54 | 21490 | 88.25 | 998 | 997 | 232.2 |
| C | 13 | 61 | 7813 | 29.35 | 998 | 997 | 232.2 |
| C | 14 | 234 | 4790 | 16.33 | 998 | 997 | 232.2 |
| D | 4 | 95 | 665567 | 2718.43 | 983 | 954 | 244.5 |
| D | 1 | 52 | 37236 | 148.4 | 983 | 954 | 244.5 |
| D | 2 | 234 | 27231 | 107.48 | 983 | 954 | 244.5 |
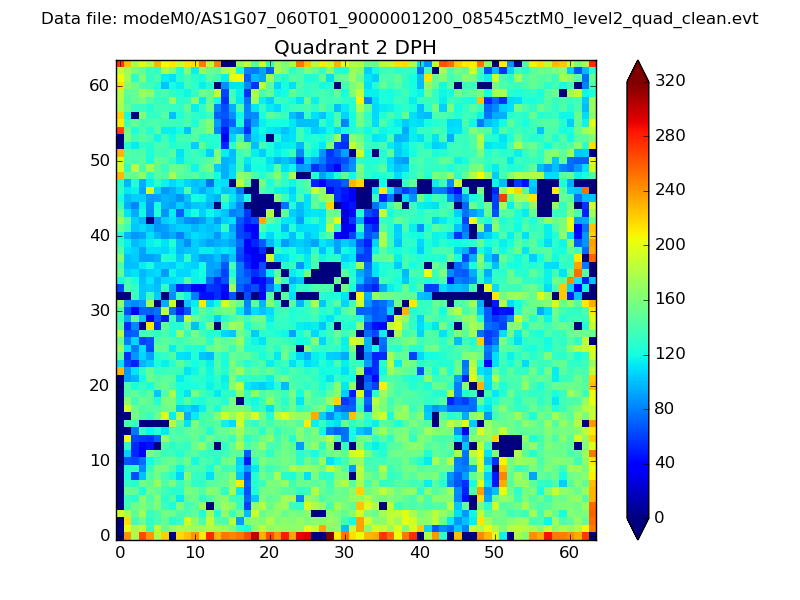
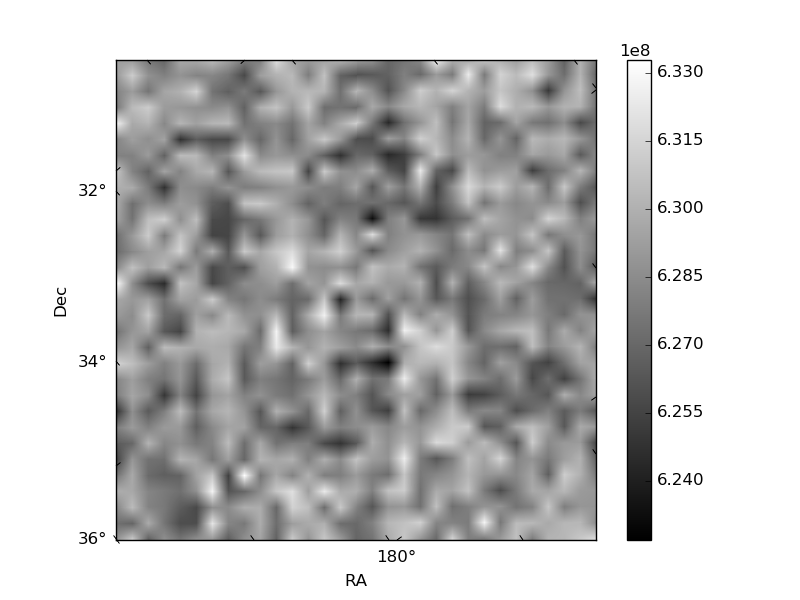
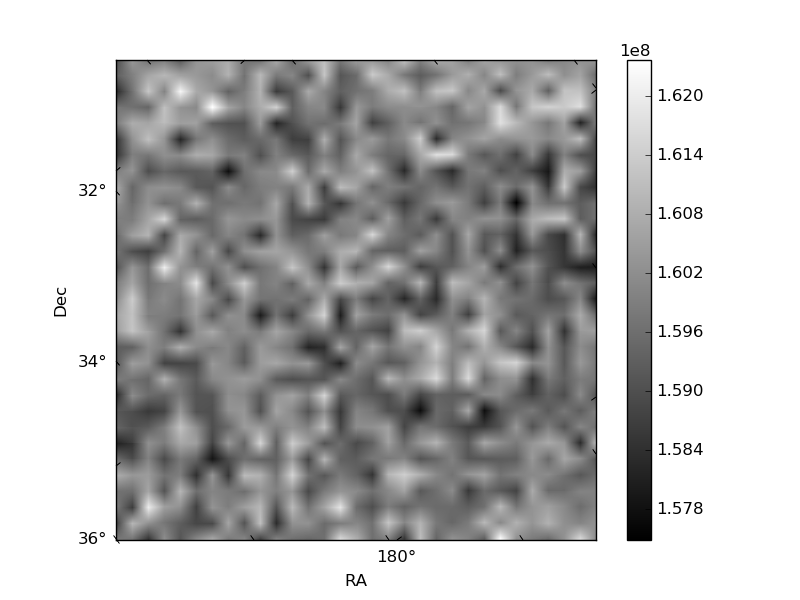
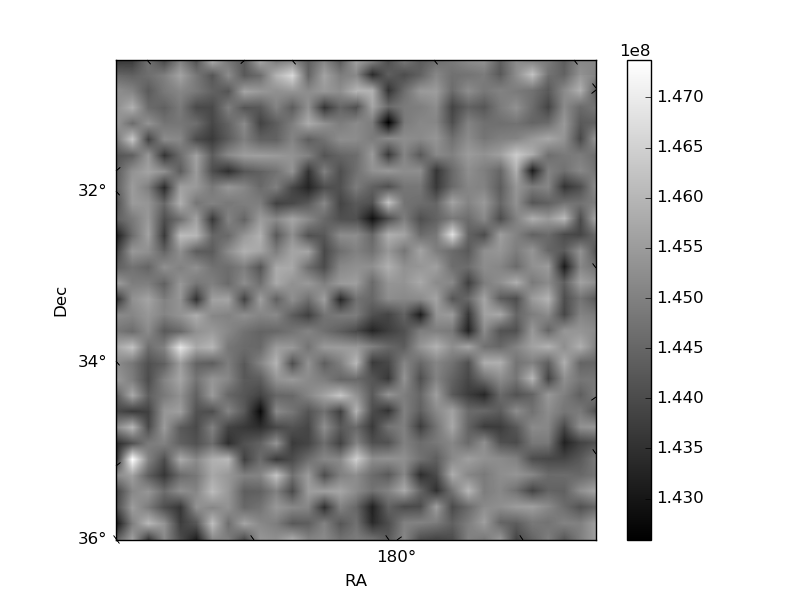
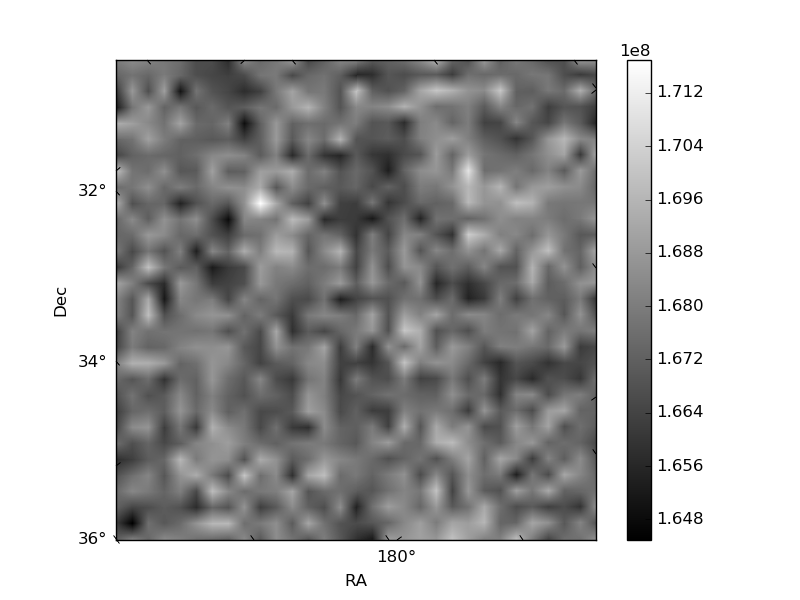
Histogram calculated using DETX and DETY for each event in the final _common_clean file
| Quadrant A | 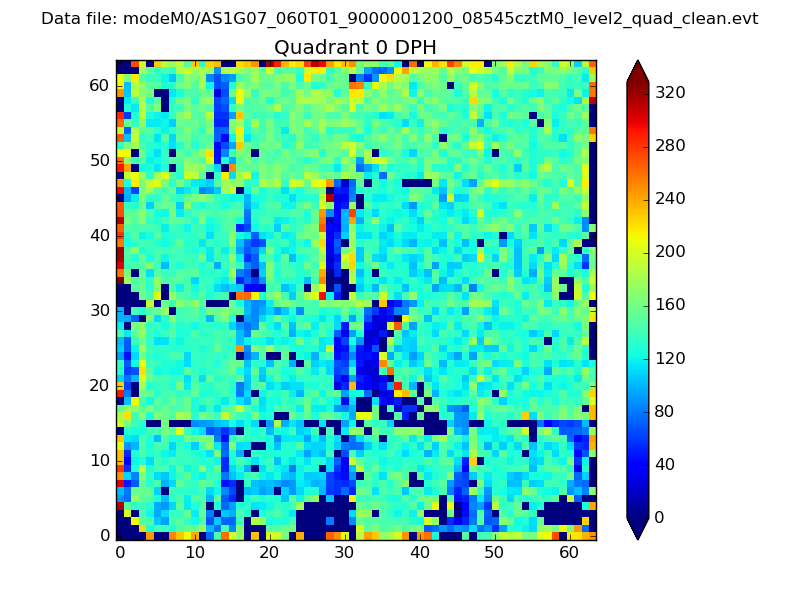 |
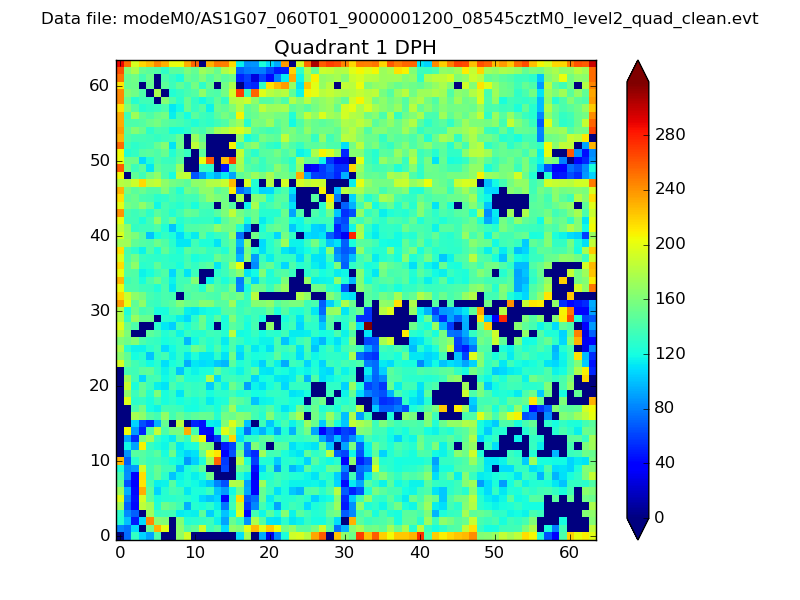 |
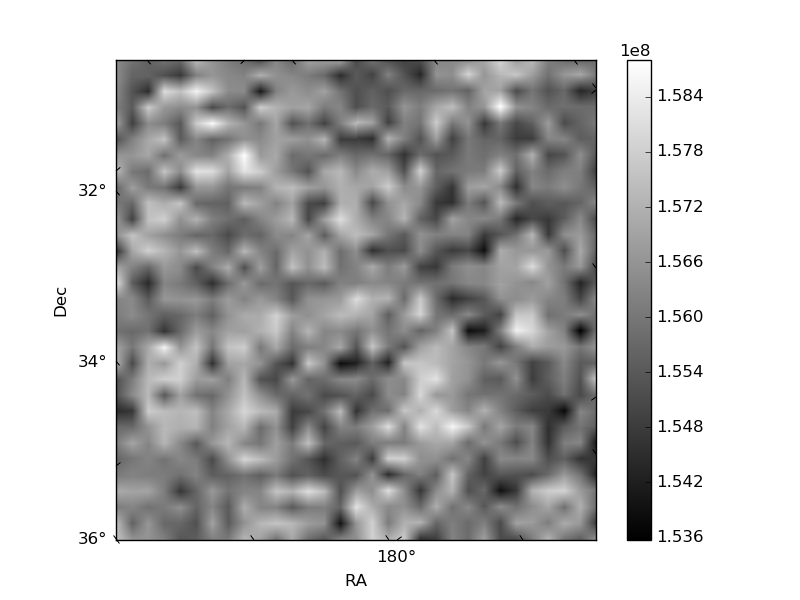
Quadrant B |
|---|---|---|---|
| Quadrant D | 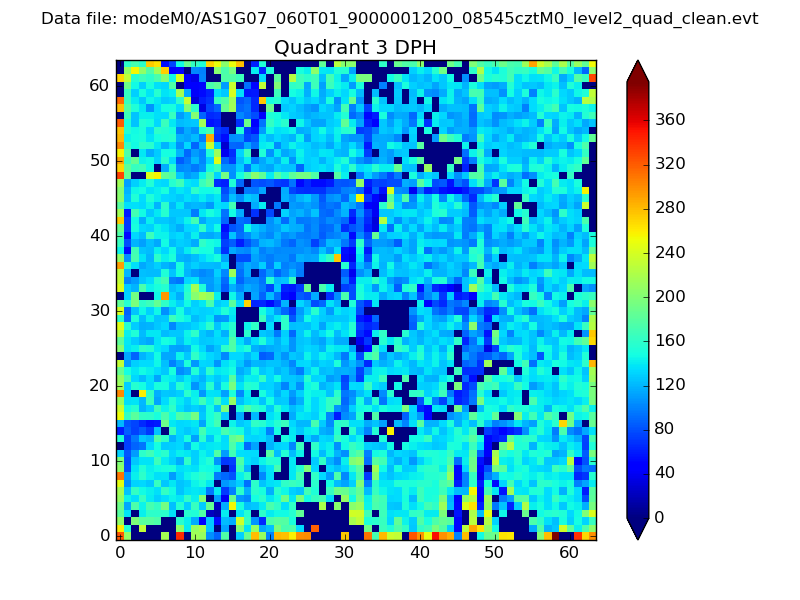 |
 |
Quadrant C |
| Plot type | Count rate plots | Images |
|---|---|---|
| Comparison with Poisson distribution Blue bars denote a histogram of data divided into 1 sec bins. Red curve is a Poisson curve with rate = median count rate of data. |
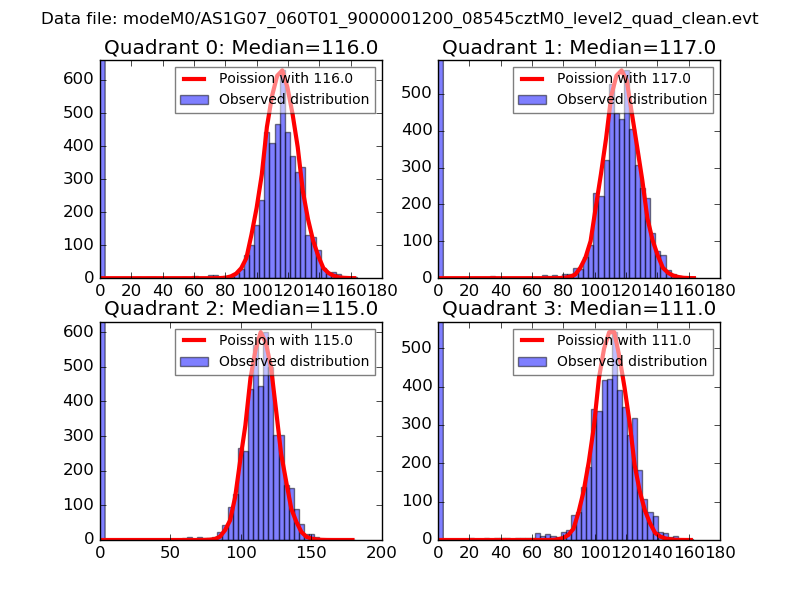 |
 |
| Quadrant-wise count rates Data is divided into 100 sec bins |
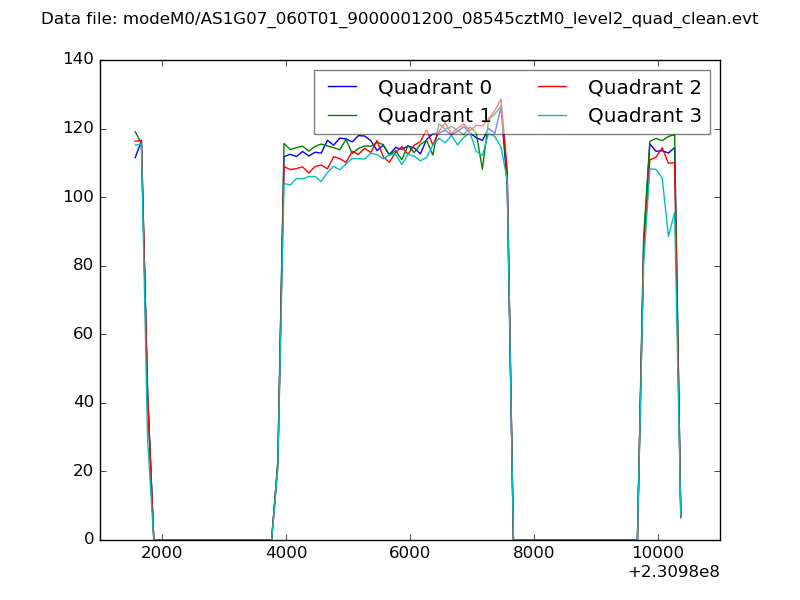 |
|
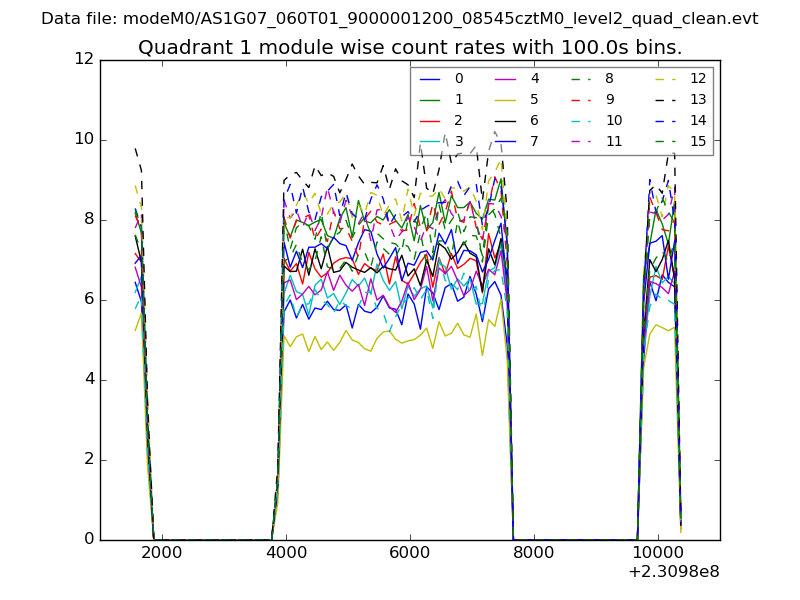
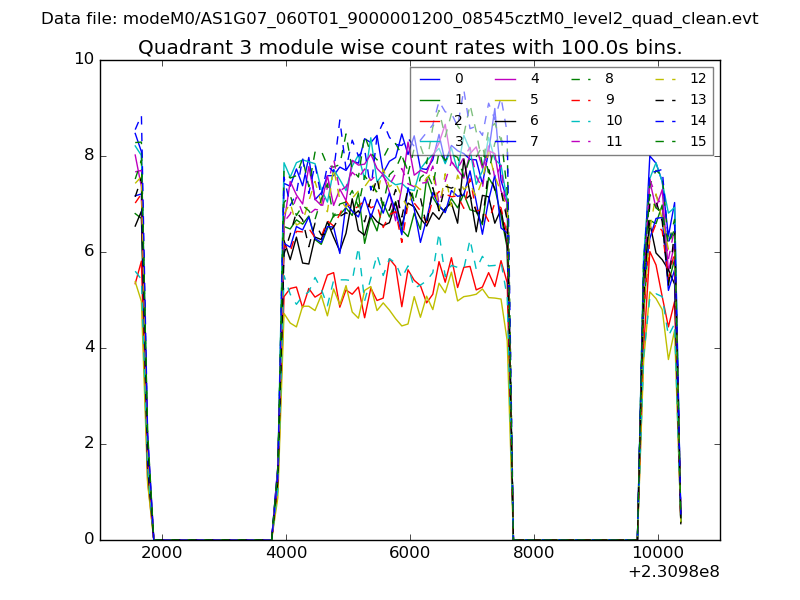
| Module-wise count rates for Quadrant A Data is divided into 100 sec bins |
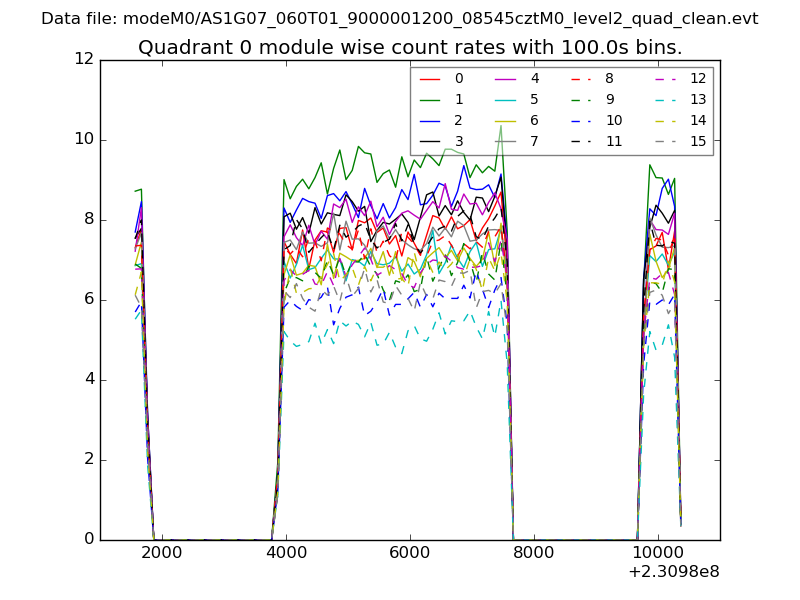 |
 |
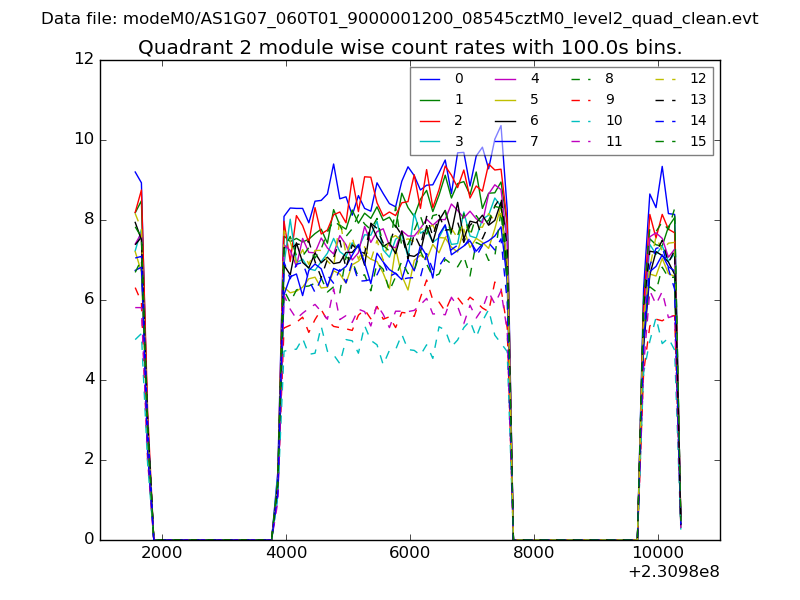
| Module-wise count rates for Quadrant B Data is divided into 100 sec bins |
 |
 |
| Module-wise count rates for Quadrant C Data is divided into 100 sec bins |
 |
 |
| Module-wise count rates for Quadrant D Data is divided into 100 sec bins |
 |
 |
| Parameter | Plot |
|---|---|
| CZT HV Monitor | 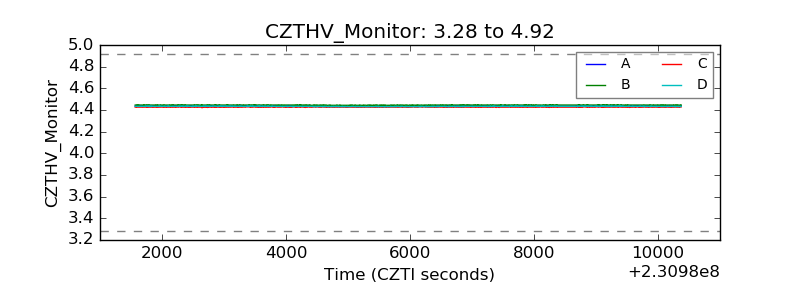 |
| D_VDD | 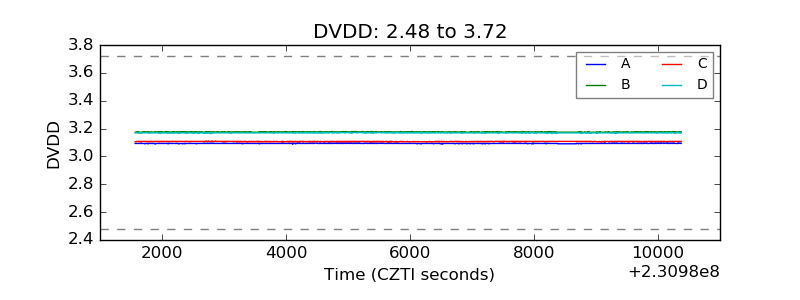 |
| Temperature 1 | 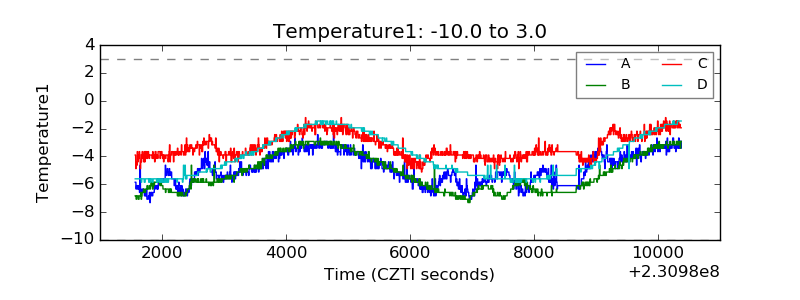 |
| Veto HV Monitor | 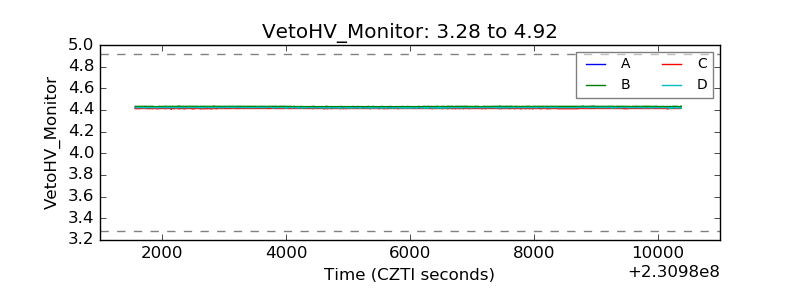 |
| Veto LLD | 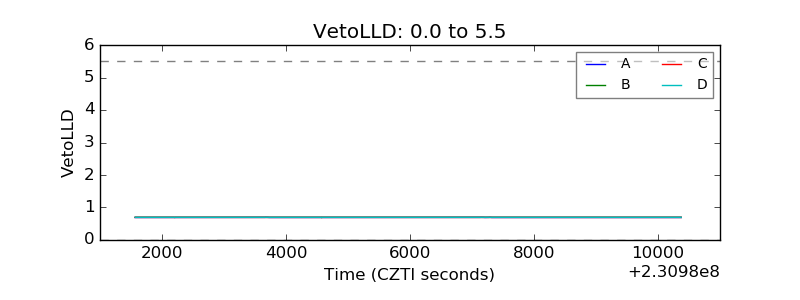 |
| Alpha Counter | 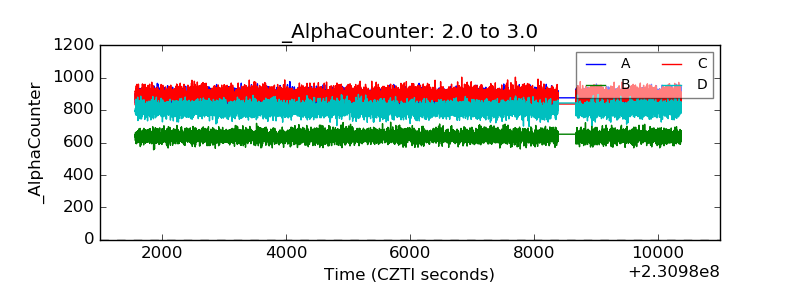 |
| _CPM_Rate | 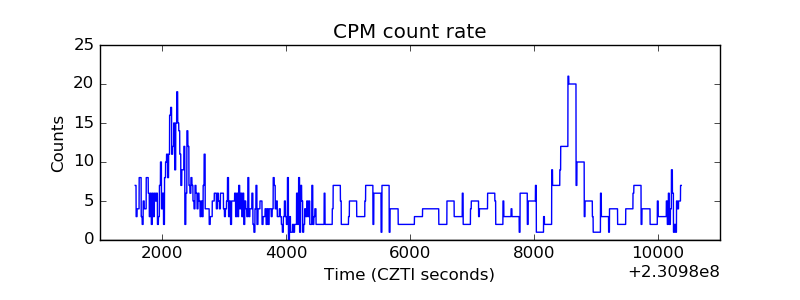 |
| CZT Counter | 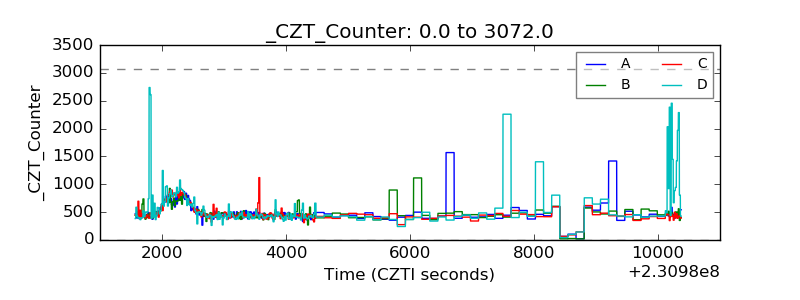 |
| +2.5 Volts monitor | 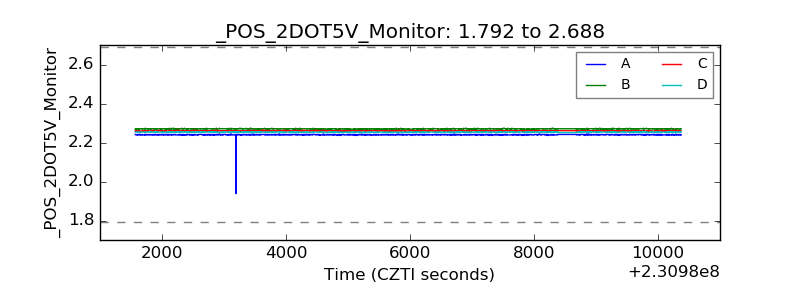 |
| +5 Volts monitor | 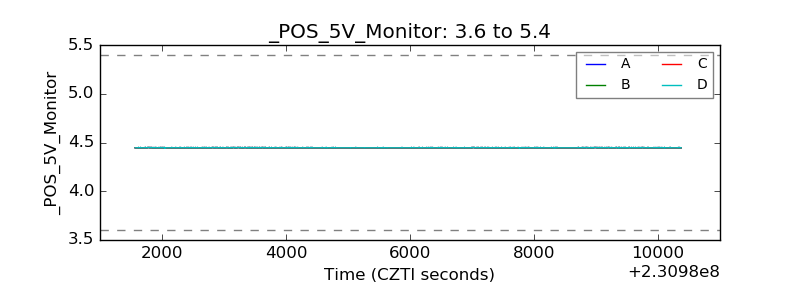 |
| _ROLL_ROT | 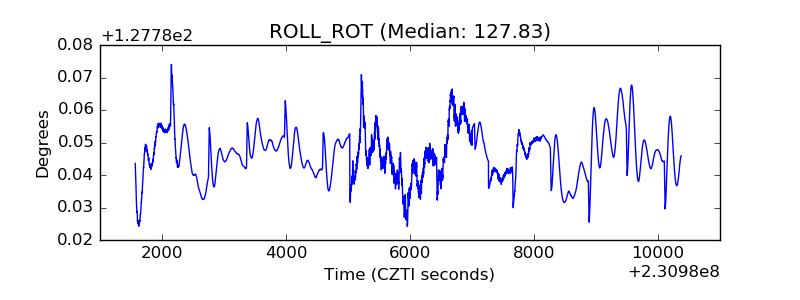 |
| _Roll_DEC | 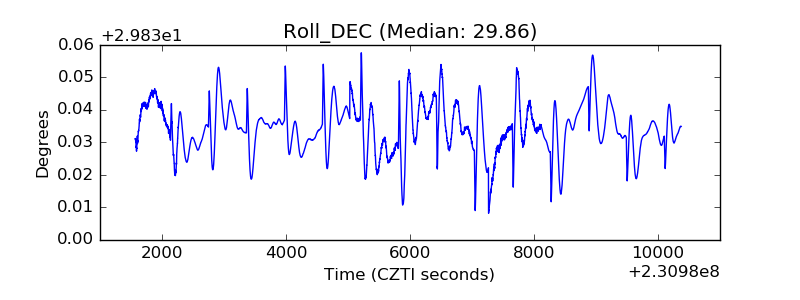 |
| _Roll_RA | 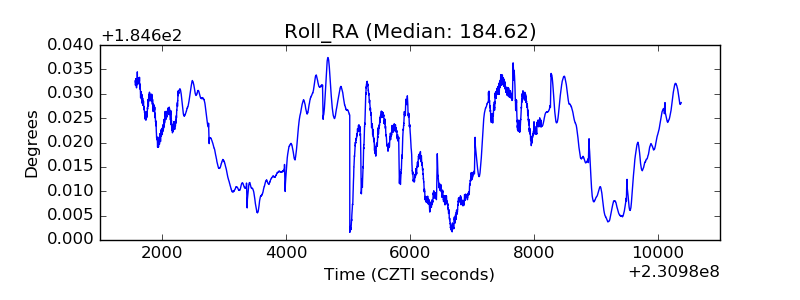 |
| Veto Counter | 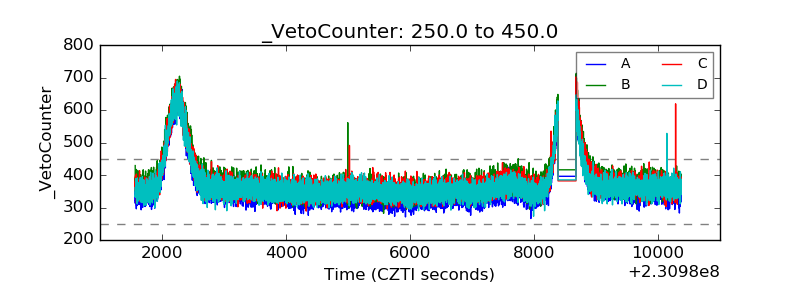 |