| Param | Original file | Final file |
|---|---|---|
| Filename | modeM0/AS1G07_060T01_9000001200_08548cztM0_level2.evt | modeM0/AS1G07_060T01_9000001200_08548cztM0_level2_quad_clean.evt |
| Size (bytes) | 1,257,770,880 | 234,889,920 |
| Size | 1.2 GB | 224.0 MB |
| Events in quadrant A | 9,540,484 | 1,458,060 |
| Events in quadrant B | 9,591,566 | 1,471,553 |
| Events in quadrant C | 8,368,168 | 1,461,459 |
| Events in quadrant D | 9,309,108 | 1,417,750 |
| Mode SS | |||
|---|---|---|---|
| Quadrant | BADHDUFLAG | Total packets | Discarded packets |
| A | 0 | 388 | 0 |
| B | 0 | 388 | 0 |
| C | 0 | 388 | 0 |
| D | 0 | 388 | 0 |
| Mode M0 | |||
|---|---|---|---|
| Quadrant | BADHDUFLAG | Total packets | Discarded packets |
| A | 0 | 41697 | 22 |
| B | 0 | 41287 | 12 |
| C | 0 | 38610 | 12 |
| D | 0 | 41374 | 15 |
| Mode M9 | |||
|---|---|---|---|
| Quadrant | BADHDUFLAG | Total packets | Discarded packets |
| A | 0 | 22 | 0 |
| B | 0 | 22 | 0 |
| C | 0 | 22 | 0 |
| D | 0 | 22 | 0 |
| Quadrant | Total seconds | Saturated seconds | Saturation percentage |
|---|---|---|---|
| A | 18939 | 560 | 2.956862% |
| B | 18943 | 476 | 2.512802% |
| C | 18943 | 195 | 1.029404% |
| D | 18944 | 404 | 2.132601% |
Noise dominated data is calculated using 1-second bins in cleaned event files. If a bin has >2000 counts, and if more than 50% of those come from <1% of pixels, then it is considered to be noise-dominated and hence unusable.
| Quadrant | # 1 sec bins | Bins with >0 counts | Bins with >2000 counts | High rate bins dominated by noise | Noise dominated (total time) | Noise dominated (detector-on time) | Marked lightcurve |
|---|---|---|---|---|---|---|---|
| A | 21147 | 18949 | 219 | 219 | 1.04% | 1.16% | 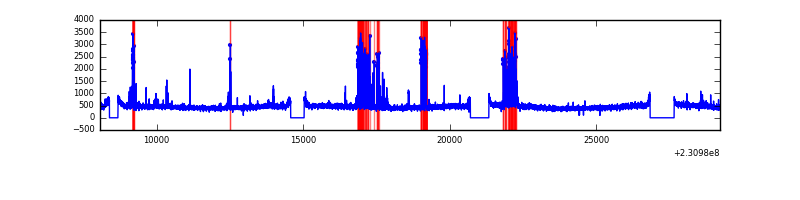 |
| B | 21147 | 18949 | 166 | 166 | 0.78% | 0.88% | 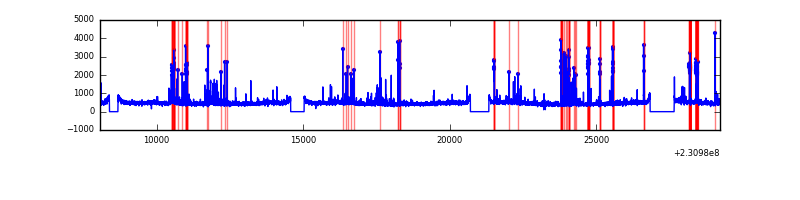 |
| C | 21147 | 18950 | 0 | 0 | 0.00% | 0.00% | 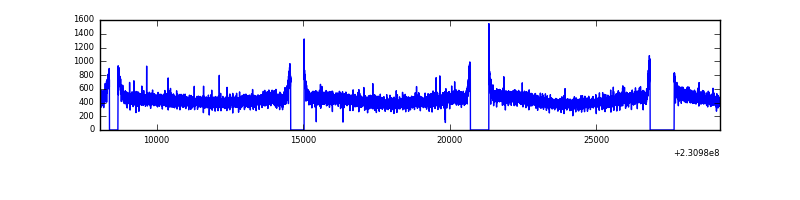 |
| D | 21147 | 18947 | 130 | 130 | 0.61% | 0.69% |  |
Top three noisy pixels from each quadrant. If the there are fewer than three noisy pixels in the level2.evt file, extra rows are filled as -1
| Pixel properties | Quadrant properties | ||||||
|---|---|---|---|---|---|---|---|
| Quadrant | DetID | PixID | Counts | Sigma | Mean | Median | Sigma |
| A | 15 | 223 | 593941 | 1342.69 | 2184 | 2135 | 440.8 |
| A | 15 | 174 | 256737 | 577.64 | 2184 | 2135 | 440.8 |
| A | 15 | 239 | 225635 | 507.08 | 2184 | 2135 | 440.8 |
| B | 10 | 16 | 747768 | 1773.49 | 2193 | 2134 | 420.4 |
| B | 0 | 214 | 111502 | 260.13 | 2193 | 2134 | 420.4 |
| B | 4 | 48 | 78630 | 181.95 | 2193 | 2134 | 420.4 |
| C | 13 | 61 | 16085 | 27.98 | 2140 | 2143 | 498.2 |
| C | 9 | 54 | 10070 | 15.91 | 2140 | 2143 | 498.2 |
| C | 8 | 222 | 7206 | 10.16 | 2140 | 2143 | 498.2 |
| D | 1 | 52 | 420634 | 816.0 | 2118 | 2068 | 512.9 |
| D | 4 | 95 | 337898 | 654.7 | 2118 | 2068 | 512.9 |
| D | 14 | 34 | 109142 | 208.74 | 2118 | 2068 | 512.9 |
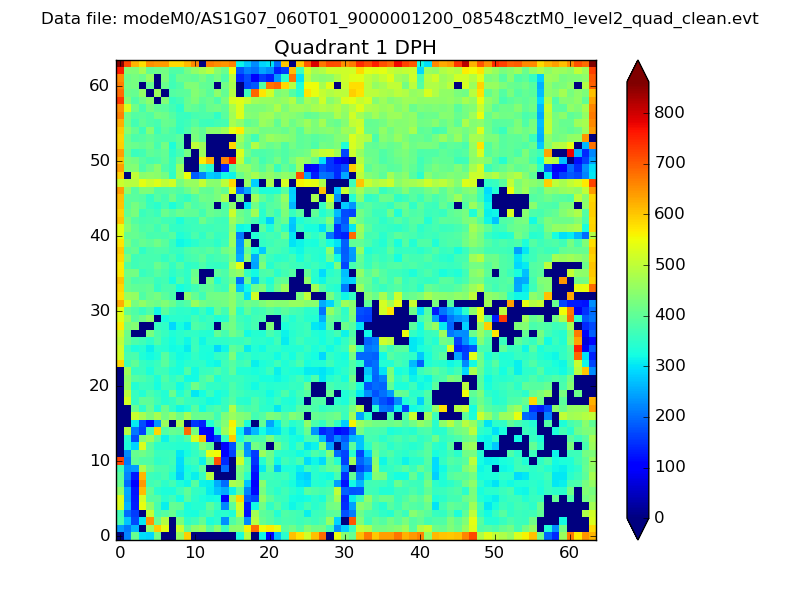
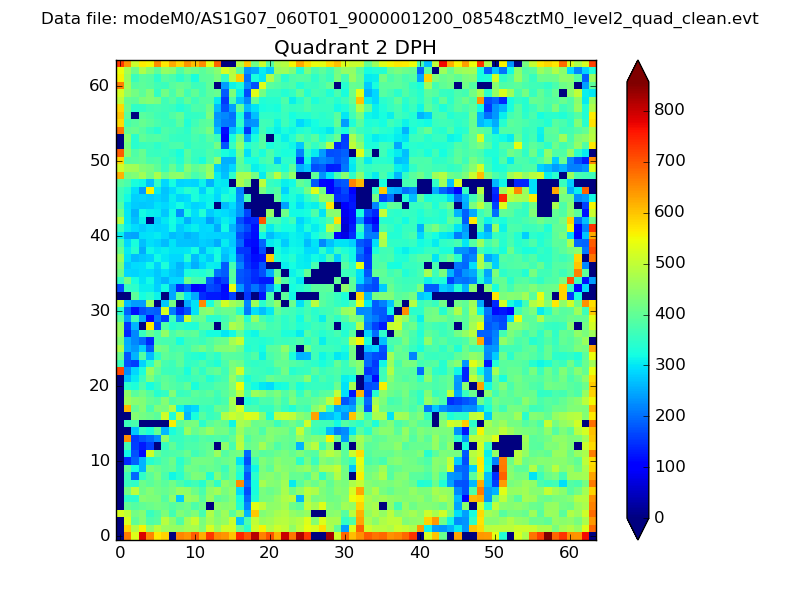
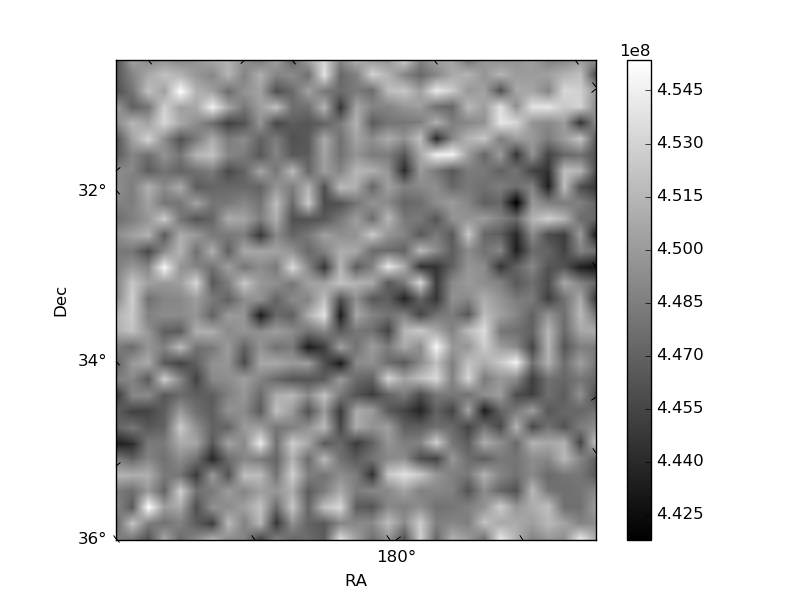
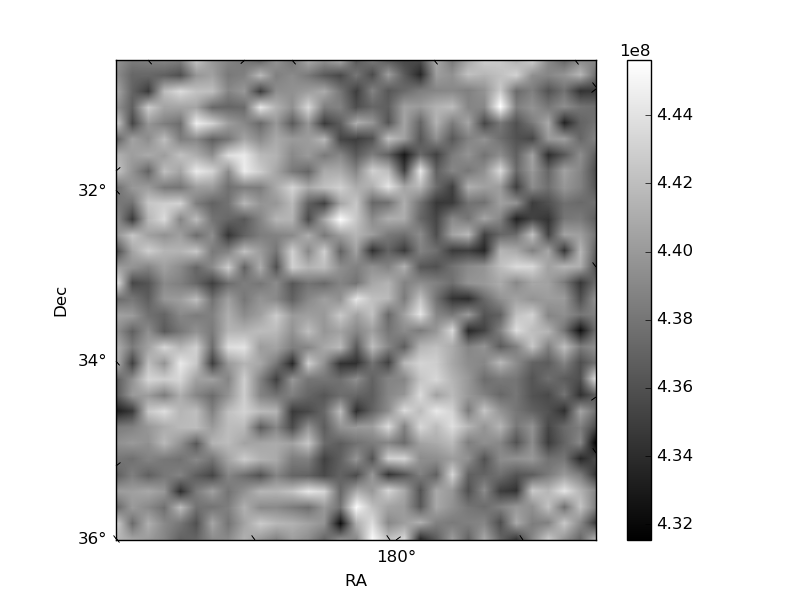
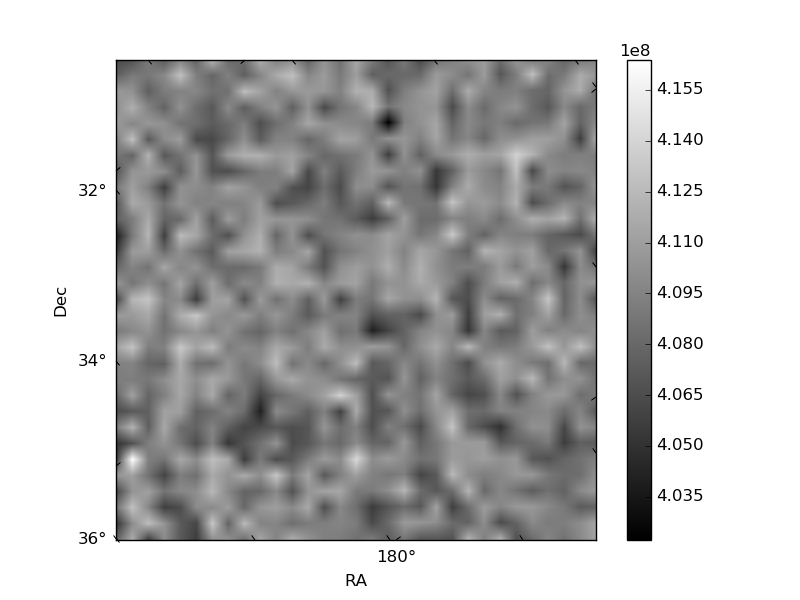
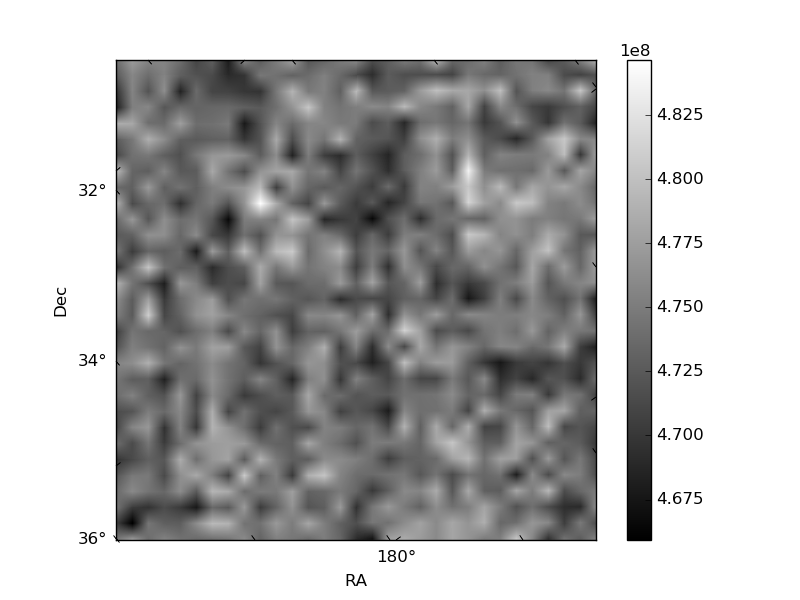
Histogram calculated using DETX and DETY for each event in the final _common_clean file
| Quadrant A | 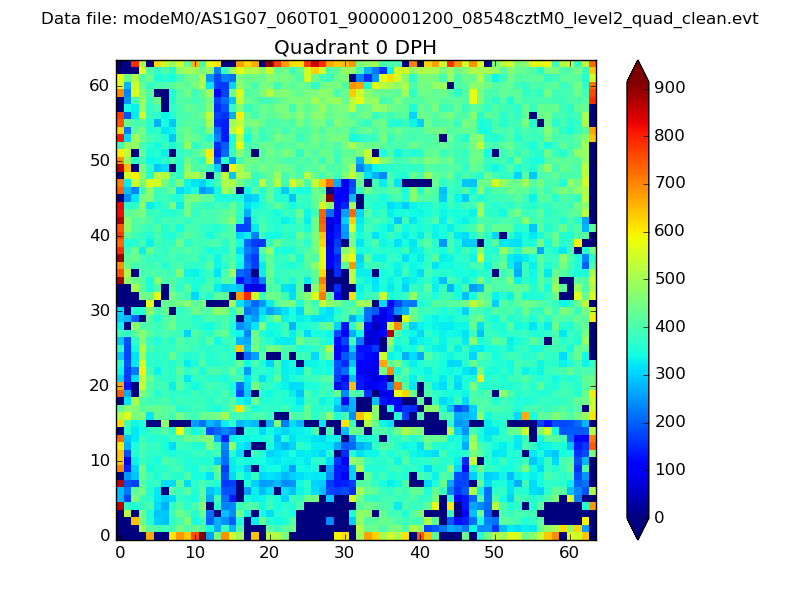 |
 |
Quadrant B |
|---|---|---|---|
| Quadrant D | 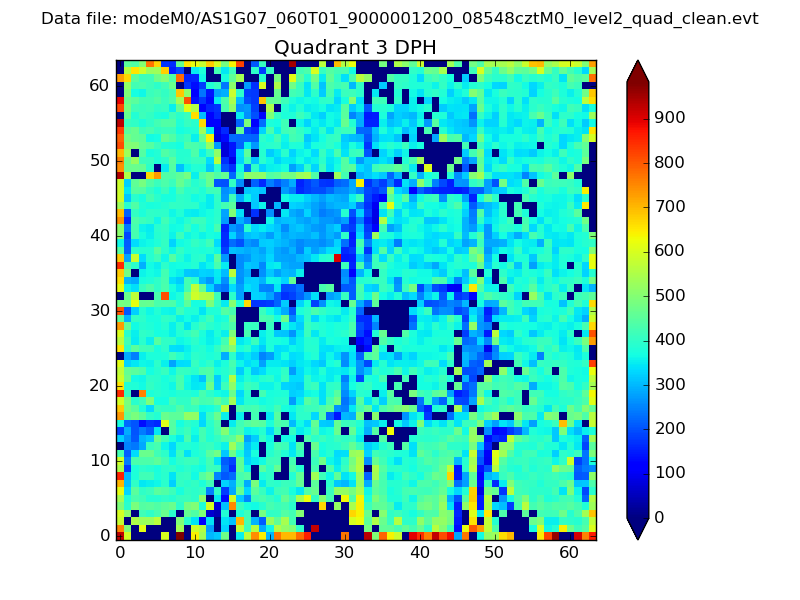 |
 |
Quadrant C |
| Plot type | Count rate plots | Images |
|---|---|---|
| Comparison with Poisson distribution Blue bars denote a histogram of data divided into 1 sec bins. Red curve is a Poisson curve with rate = median count rate of data. |
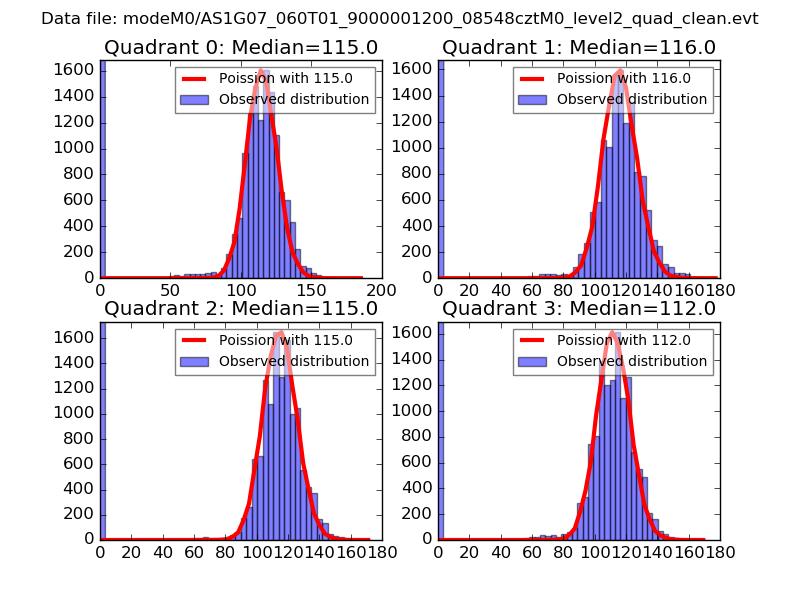 |
 |
| Quadrant-wise count rates Data is divided into 100 sec bins |
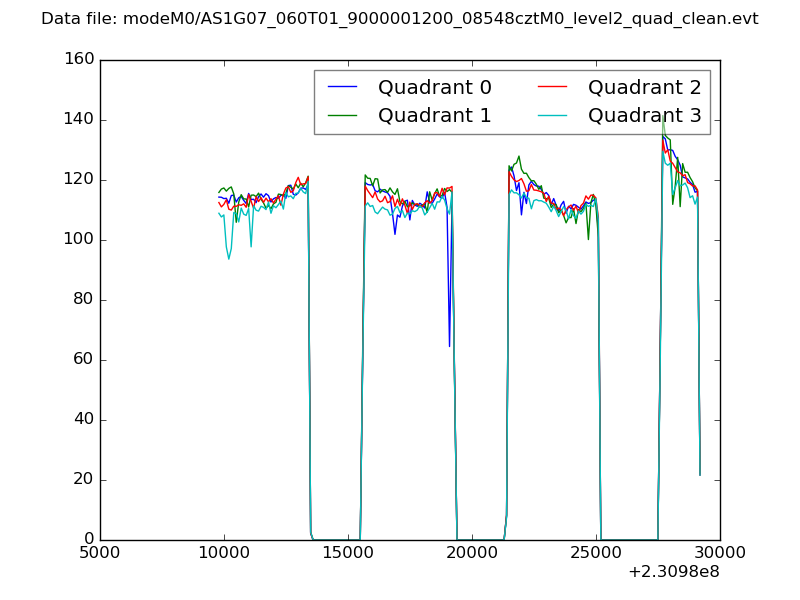 |
|
| Module-wise count rates for Quadrant A Data is divided into 100 sec bins |
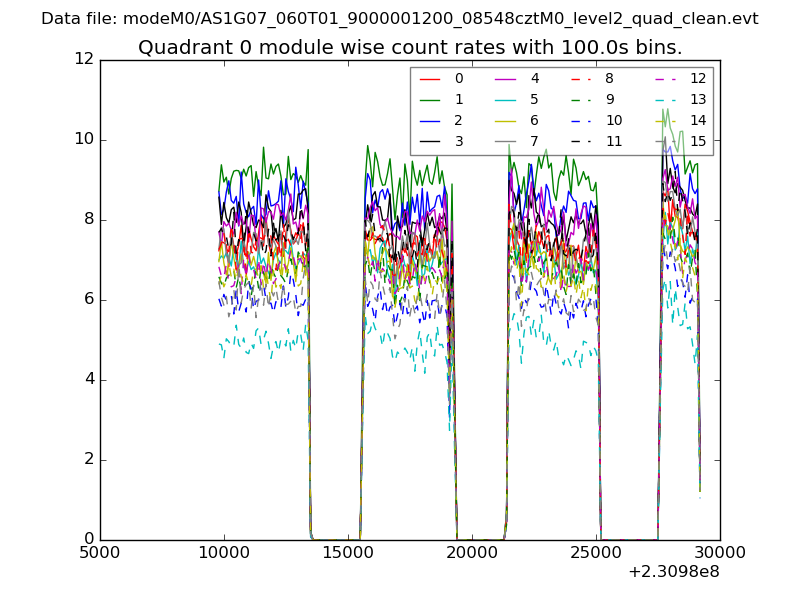 |
 |
| Module-wise count rates for Quadrant B Data is divided into 100 sec bins |
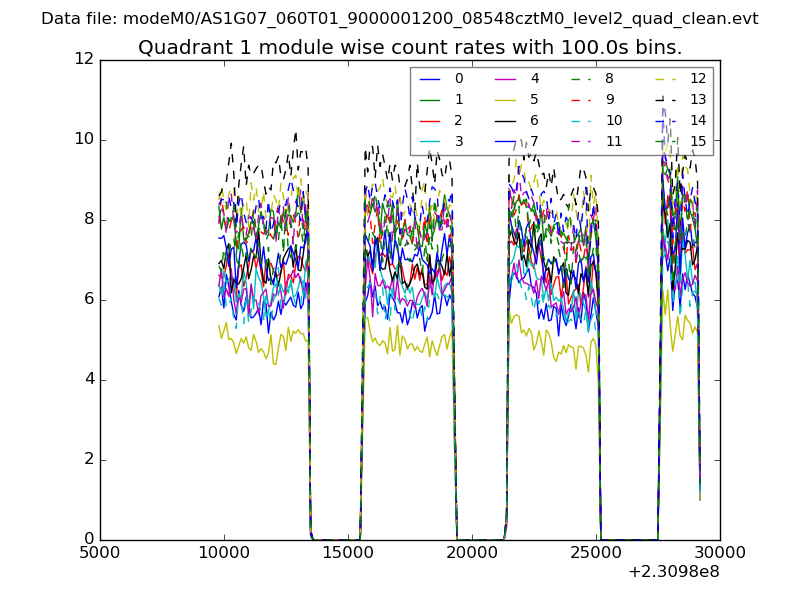 |
 |
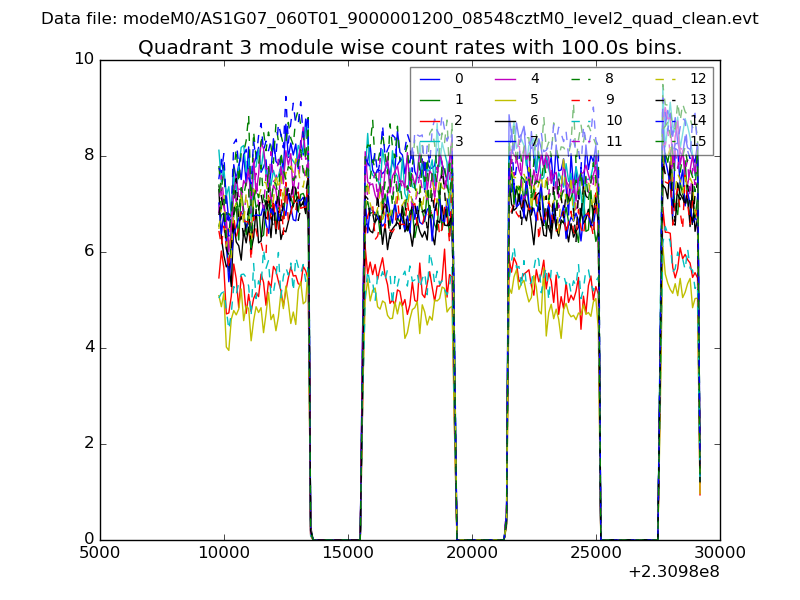
| Module-wise count rates for Quadrant C Data is divided into 100 sec bins |
 |
 |
| Module-wise count rates for Quadrant D Data is divided into 100 sec bins |
 |
 |
| Parameter | Plot |
|---|---|
| CZT HV Monitor | 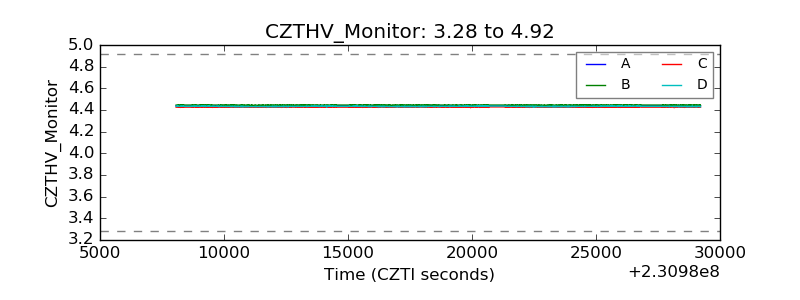 |
| D_VDD |  |
| Temperature 1 | 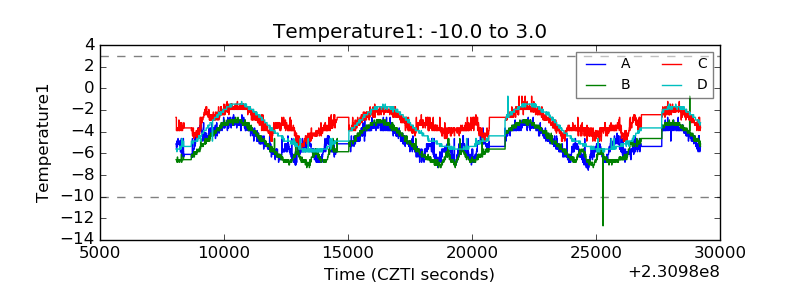 |
| Veto HV Monitor | 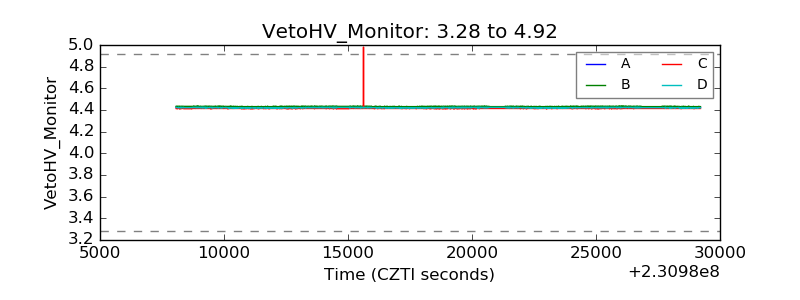 |
| Veto LLD | 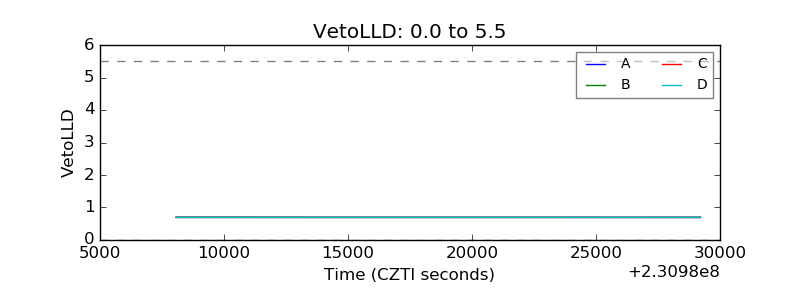 |
| Alpha Counter | 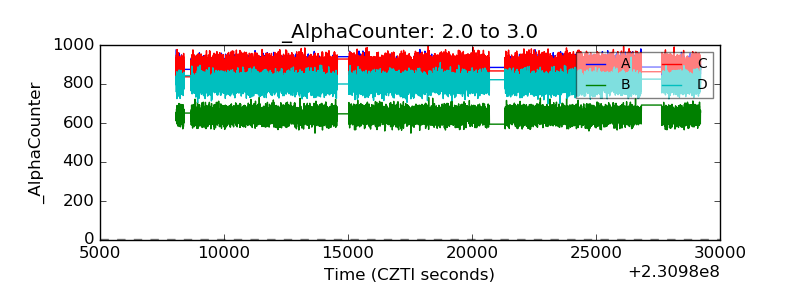 |
| _CPM_Rate | 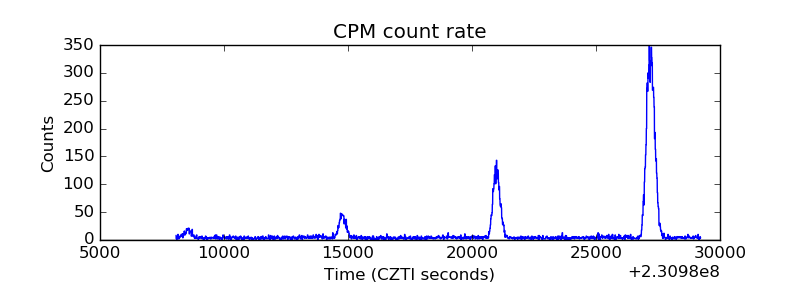 |
| CZT Counter | 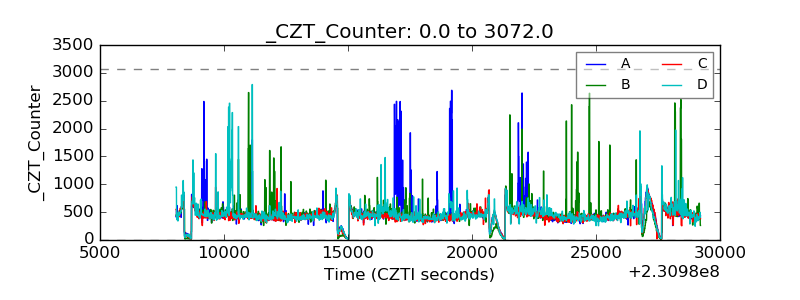 |
| +2.5 Volts monitor |  |
| +5 Volts monitor |  |
| _ROLL_ROT | 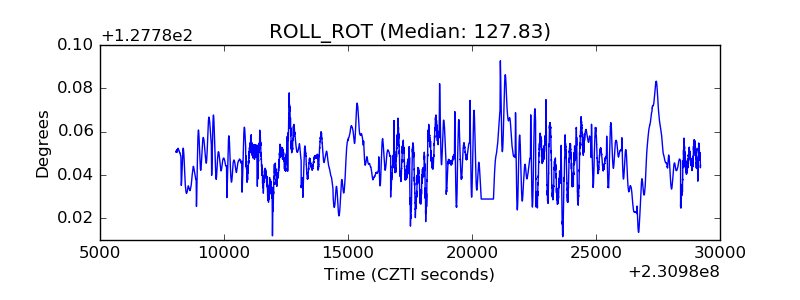 |
| _Roll_DEC | 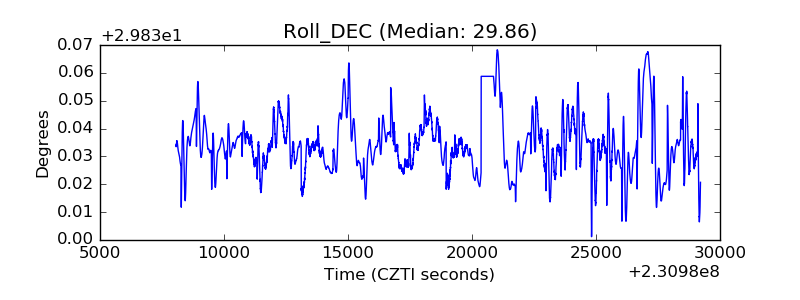 |
| _Roll_RA | 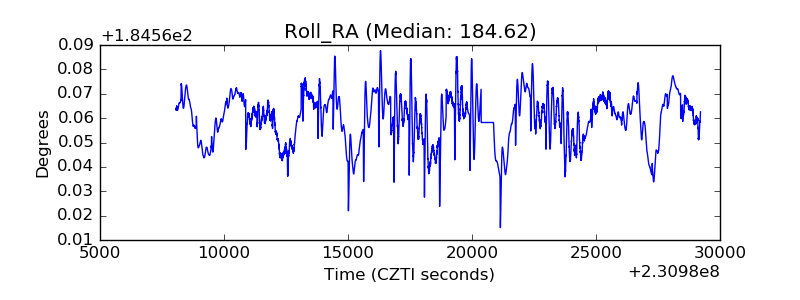 |
| Veto Counter | 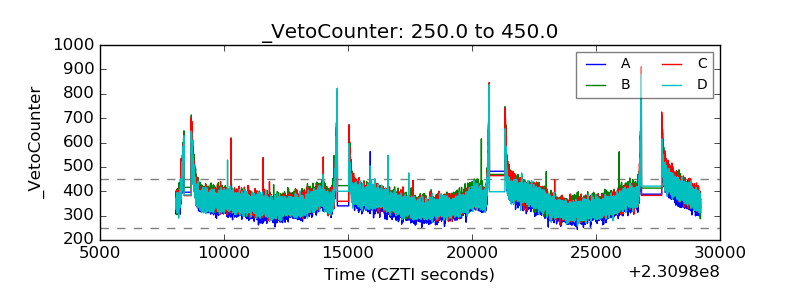 |